Multi-Element Doppler Imaging of the Ap star Ursae Majoris
Abstract
The surface distribution of five elements: , , , and on the magnetic A0pCr star UMa, have been calculated using the Doppler imaging technique. We found that , and are correlated with the assumed dipole magnetic field geometry of this star, which is apparently not the case of and .
Key words: Stars: abundances – Stars: chemically peculiar – Stars: magnetic fields – Stars: Doppler imaging – Stars: individual: UMa
1 Introduction
The scientific goal of applying the Doppler imaging technique to Ap stars, is to provide observational constraints on the diffusion mechanism in the presence of a global magnetic field. UMa (HD 112185, HR 4905), an A0pCr star, is known as the brightest member (V=1.77) of the class of peculiar A type stars. Bohlender and Landstreet (1990) measured a weak, reversing magnetic field for UMa, that appears to be dominated by a dipole component with a polar magnetic field strength in the order of 400 Gauss. Furthermore, maps of , (Rice & Wehlau, 1997), and (Babel et al., 1995) have been published, whereby the distribution of each of these elements appears to be correlated with the assumed dipole magnetic field geometry.
2 Observations
Observations of UMa were done in June 1994 and in March 1995 at the Observatoire de Haute-Provence using the spectrograph AURÉLIE (attached to the 1.52-m telescope) in two spectral regions: 4060 - 4260 Å and 4440 - 4640 Å. The spectral resolution is about 20000 and the Signal-to-Noise ratio above 150.
3 Input data for Doppler Imaging
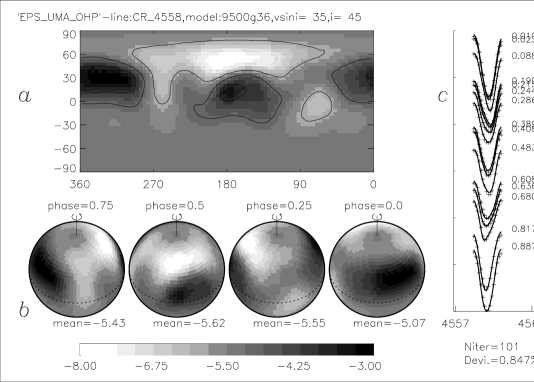
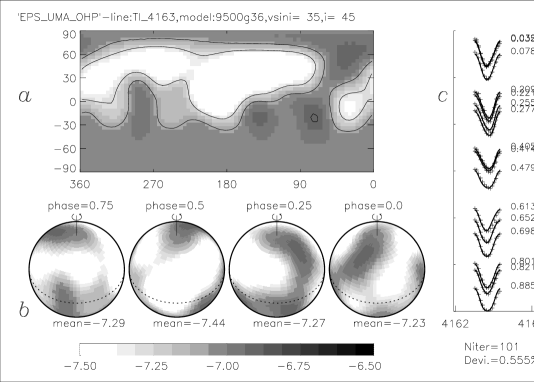
The maps were calculated by using the surface imaging technique described by Piskunov and Rice (1993). A Kurucz ATLAS9 model atmosphere with K and was used for computing the local line profile tables. The value of was assumed to be km s-1 and the inclination angle was chosen as 45 ∘ . Both values give a minimal deviation of the observed line profiles from the computed ones. The rotation phases of the spectra we used for mapping were computed according to: .
4 Discussion
The surface abundance distributions of the five elements we treated can be divided into two groups.
The and (Figure 1) distributions show a clear depleted band which coincides with the assumed magnetic equator, confirming the results of Rice & Wehlau. The distribution is very similar to that of these elements, which accumulate near the magnetic poles. They are all slightly overabundant compared to solar values: and are about 0.8 dex above solar values, while is 1 dex above.
However, the (Figure 2) and surface structures have much less contrast in terms of peak-to-peak abundances and are apparently not significantly correlated with the magnetic dipole geometry. So far, seven different elements have been mapped for UMa.
Together with the and maps published by Babel et al. (1995), which reveal abundance enhancements located at the magnetic equator, the maps of , , , and provide important constraints for building models of diffusion in the presence of a global magnetic field. This should provide a better understanding of the hydrodynamics in the atmospheres of Ap stars.
References
- 1 Babel, J., Donati, J.-F., Gonzalez, J.-F.: 1995, IAU Symp.176, Poster proc., ed. K.G. Strassmeier, Vienna, 135
- 2 Bohlender, D.A., Landstreet, J.D.: 1990, Astrophys. J.358, L25
- 3 Piskunov, N.E., Rice, J.B.: 1993, Publ. Astron. Soc. Pac.105, 1415
- 4 Rice, J.B., Wehlau, W.H.: 1997, Astron. Astrophys.326, 988