Cosmic ray propagation and star formation history of NGC 1961
Abstract
We present new radio continuum data at 4 frequencies on the supermassive, peculiar galaxy NGC 1961. These observations allow us to separate the thermal and the nonthermal radio emission and to determine the nonthermal spectral index distribution. This spectral index distribution in the galactic disk is unusual: at the maxima of the radio emission the synchrotron spectrum is very steep, indicating aged cosmic ray electrons. Away from the maxima the spectrum is much flatter. The steep spectrum of the synchrotron emission at the maxima indicates that a strong decline of the star formation rate has taken place at these sites. The extended radio emission is a sign of recent cosmic ray acceleration, probably by recent star formation. We suggest that a violent event in the past, most likely a merger or a collision with an intergalactic gas cloud, has caused the various unusual features of the galaxy.
keywords:
galaxies: individual: NGC 1961 – galaxies: ISM – galaxies: magnetic fields – cosmic rays – radio continuum: galaxies1 Introduction
NGC 1961 (Arp 184) is a very massive (dynamical mass , Gottesman et al. 1983) Sb spiral galaxy with a peculiar and asymmetric optical appearance. It is among the most massive and largest known spiral galaxies (Romanishin 1983); its optical diameter of arcmin (de Vaucouleurs et al. 1991, RC3) translates to 110 kpc (adopting a distance of 82.9 Mpc for km s-1 Mpc-1). It is a member of a group of 6 galaxies where it is by far the largest and most massive member.
Despite its size and peculiar appearance, NGC 1961 has received relatively little attention. A detailed study of its H i structure and kinematics by Shostak et al. (1982, SHSVV) found an unusual asymmetric morphology with an extensive “wing” of gas extending 30 kpc to the north-west and a sharp edge to the south-east. SHSVV suggested that the disturbed appearance is due to stripping of the gas in NGC 1961 by a hot intergalactic medium (IGM). They discarded the possibility of tidal interaction with another galaxy since there is no galaxy with a large enough mass sufficiently close to NGC 1961. They also dismissed the possibility of a merger with another galaxy or an intergalactic gas cloud since they found no trace of a merger remnant such as a second nucleus, or disturbed velocity distribution in the H i gas. In favour of the stripping hypothesis SHSVV noted the following points. i) The displacement of the H i with respect to the optical disk in the south of the galaxy. ii) The presence of increased radio continuum emission in the south-east which they interpreted as being caused by an enhancement of the magnetic field or by an increase in the cosmic ray (CR) density due to a high star formation rate (SFR). iii) The blue colour of the optical emission of the NW wing and the south-eastern ridge indicating recent star formation. iv) A curved X-ray emission feature in the south-east of the galaxy detected by the Einstein satellite (Shostak et al. 1982) which they interpreted as emission from hot IGM. However, recent ROSAT observations have shown that the X-ray emission of NGC 1961 is fairly typical for a spiral galaxy and comes mainly from the central region (Pence & Rots 1997). The cause of the asymmetric H i distribution therefore remains unclear.
In this paper we present multi-frequency radio continuum data which we use to identify thermal and nonthermal (synchrotron) emission. The thermal radio emission reveals the sites and intensity of present day star formation, whereas the synchroton emission, and in particular its spectral shape, contains information about the star formation in the past (on time-scales of a few yr which is related to the life-time of the CR electrons and of supernova (SN) progenitors), and also about the acceleration and propagation mechanisms of CRs.
2 Observations
1.46 GHz 4.92 GHz


8.41 GHz 15.4 GHz


NGC 1961 was mapped with the VLA111 The VLA is operated by the National Radio Astronomy Observatory for Associated Universities Inc., under a cooperative agreement with the National Science Foundation. at 8.41 GHz and with the Cambridge 5-km Ryle Telescope (RT) at 4.92 and 15.4 GHz. Additionally, existing VLA data (B-array) at 1.46 GHz (Condon 1983) were available. When the observations of NGC 1961 were made (between 1990 and 1993), the RT had a band-width of 280 MHz split into 28 10-MHz frequency channels; together with the minimum baseline of 18 m this provides excellent temperature sensitivity at both 4.92 and 15.4 GHz.
1.46 GHz 8.41 GHz


For the RT observations a total of five telescope configurations at each observing frequency were employed giving a nearly fully filled aperture out to a baseline of approximately 1 km. A minimum of two 12-hour runs in each configuration were obtained. This gave a resolution of approximately arcsec2 at 15.4 GHz and arcsec2 at 4.92 GHz. At 4.92 GHz observations of phase-calibrators were made at the beginning and end of each run, while at 15.4 GHz calibration observations were interleaved with those of NGC 1961. 3C 286 and 3C 48 were observed regularly as flux calibrators. Calibration and data-editing was performed in the MRAO package postmortem, with subsequent reduction in aips and the MRAO package anmap.
The 8.41-GHz VLA observations were in the B, C and D arrays and were carried out during 1990/91. Reduction of the data followed standard VLA procedures with calibration, editing and imaging performed in aips. The 1.46 GHz data were from Condon (1983) and no additional reduction was required. A number of maps were made at each frequency by tapering the aperture-plane to highlight structure on different angular scales.
The data in this paper which are most seriously affected by the lack of short baselines are those at 1.46 GHz, which are only sensitive to structures on scales smaller than about 2 arcmin. Very faint emission from the whole of the optical disc of NGC 1961 will not be adequately represented in our maps. The optical diameter of NGC 1961 is 4.6 arcmin; however the extent of the continuum emission at 1.46 GHz as determined by Shostak et al. (1982) using the WSRT with a shortest baseline of only 36 m is approximately 2.5 arcmin, with very little low-brightness emission outside that region. A further test of the completeness of our mapping is to compare our measured flux densities with single dish data; these comparisons are reported in Table 1. It is apparent that to within the quoted uncertainties our flux densities are consistent with those determined by other workers (including single dish measurements at 1.40 GHz and 4.85 GHz), although the best estimates represent a shortfall of 18% of the flux density at 1.46 GHz and 12% at 4.92 GHz. These results suggest that we are able to image the extent of the continuum emission satisfactorily at all our observing frequencies.
So as to make the spectral index comparison as accurate as possible it is crucial to ensure that the spectral index is determined from images all of which are sensitive as far as possible to the same range of spatial structure. To achieve such a match, the UV-range of the data in the aperture plane used in the construction of the images above 1.46 GHz was restricted during the mapping programs so that the minimum and maximum baselines (measured in wavelengths) used in the imaging were the same; this involved removing baselines from all of the high-frequency data. While it is not possible to ensure that the precise sampling of the aperture plane is the same in all cases, for both the VLA and RT the dense sampling near the shortest baselines leads to similar overall coverage of the UV plane. Furthermore the use of CLEAN does, to some extent, compensate for the resulting marginally different beamshapes. A possible problem results from the fact that the extended, low-brightness structure often has a steep radio-frequency spectrum. Missing the short baselines could lead to a negative region (“negative bowl”) around the source and hence a (frequency-dependent) error in the zero level of the image. The final images were checked for the existence of such an effect and in each case any offset of the local zero level was found to be less than the thermal noise (this is clear from Figs. 1 and 2 where no evidence of a significant negative bowl exists). We are confident that the procedures that we have adopted here are sufficient to reduce any artefacts resulting from the sampling of the aperture to levels significantly below those of the thermal noise.
All the maps were CLEANed and a set of maps at a common resolution of arcsec2 were used for the multi-frequency comparison (at 1.46 GHz this was achieved by convolving the supplied image). All maps have been corrected for the primary beam response of the telescope used to make the observations.
| Frequency | Flux Density | Reference |
|---|---|---|
| 38 | 3.40 0.85 | Howarth (1990) |
| 57.5 | 2.0 0.5 | Israel & Mahoney (1990) |
| 151 | 1.17 0.21 | Howarth (1990) |
| 1400 | 0.191 | White & Becker (1992) |
| 1465 | 0.149 0.015 | this work |
| 1490 | 0.182 0.023 | Condon (1987) |
| 4850 | 0.057 0.009 | Becker, White & Edwards (1991) |
| 4919 | 0.050 0.006 | this work |
| 8414 | 0.028 0.003 | this work |
| 10550 | 0.031 0.005 | Niklas et al. (1995) |
| 15360 | 0.019 0.002 | this work |
3 Results
3.1 Radio images
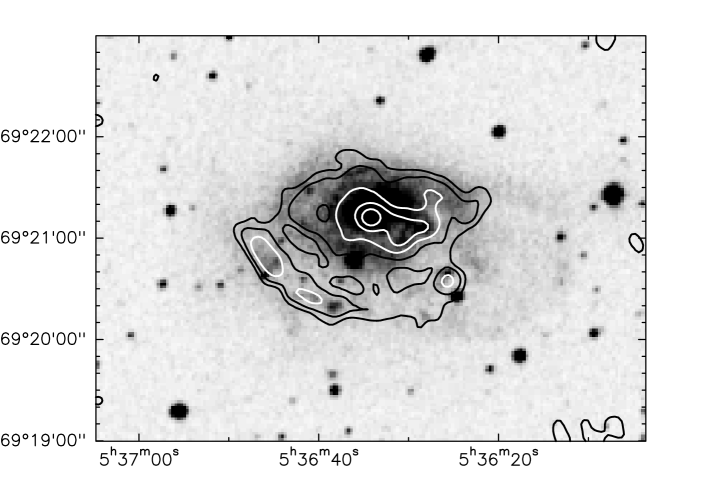
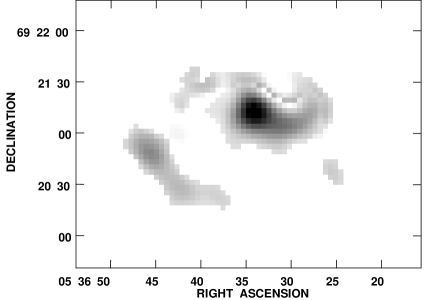
Fig. 1 shows the radio maps at the four frequencies at a resolution of 16 arcsec; maps at a resolution of 8 arcsec are shown in Fig. 2. In Fig. 3 the 1.46 GHz radio map is overlaid on an optical image obtained from the Digitized Sky Survey produced by the Space Telescope Science Institute. The radio images at all frequencies show a peculiar morphology which are similar to the optical image. The bright central nucleus is resolved in the higher resolution images and consists of two peaks – one which corresponds to the optical peak and a second peak which coincides with a dust lane. Furthermore, a bright radio arm is visible in the south-east, coinciding with the bright optical south-eastern arm. The optical spiral arm extending from of the west of the nucleus and to the south is also visible in the radio image. At all frequencies, except for 15.4 GHz, there is an extended envelope of radio emission visible which surrounds the nucleus and the south-eastern arm and which contains, at 1.46 GHz, about 50 of the total radio flux.
3.2 Radio spectrum and spectral index distribution
Integrated flux densities at the four observing frequencies were determined from the low-resolution maps and in Table 1 the results are summarized together with flux densities taken from the literature. The integrated spectrum is shown in Fig. 4; the spectrum is well-fitted by a power law with a spectral index (), which is not unusual for a spiral galaxy; the average spectral index for a sample of spiral galaxies is 0.74 (Gioia et al. 1982).
As discussed in Section 2 there may be some flux missing from our images due to the restricted UV-coverage on the shortest baselines; our estimate of this is 18% (33 mJy) at 1.46 GHz and 12% (7 mJy) at 4.92 GHz. The spectral comparison has been performed using images with matched UV-coverage and resolution so that the spectra of structure of similar spatial scales may be compared. If the emission is regarded as features superimposed on a background of emission, then on those scales which are properly represented in our imaging the spectral results will be accurate. A problem may exist, however, in those regions which do not show significant structural variation. In this case we can quantify the likely errors. If we take a worst case of 33 mJy missing flux density at 1.46 GHz distributed over an area of 9 armin2 (slightly larger than the observed mappable extent of the source), then this would correspond to an error of 0.26 mJy/beam over the source at 1.46 GHz, which is less than the thermal noise and at a level of approximately 40% of the lowest contour in Fig. 1. Since we would expect the spectrum of the most extended material to be steep, this effect becomes less important at the higher frequencies. The effect of the missing short spacings is therefore in the worst case to underestimate very slightly the flux density at 1.46 GHz relative to the higher frequencies and therefore to underestimate also the spectral index. However, this effect will lead to a systematic error which is considerably smaller than the statistical error due to the thermal noise and in what follows it will be ignored.

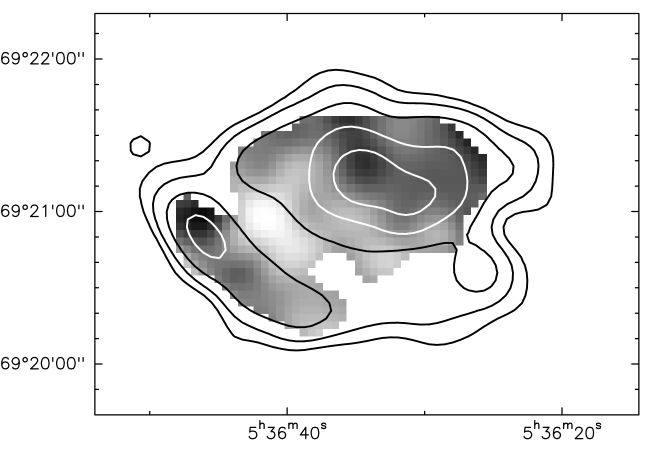
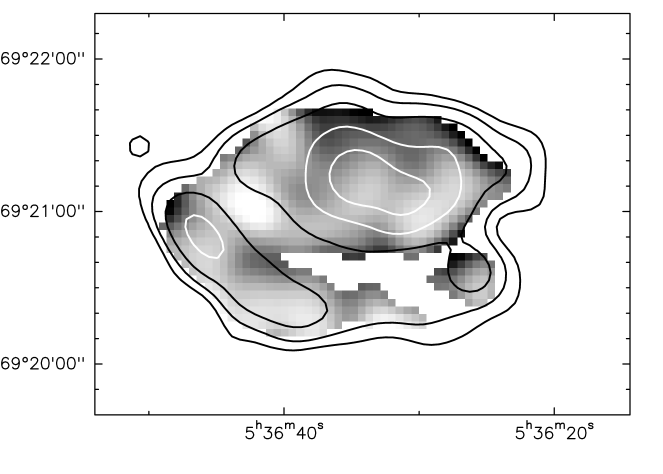
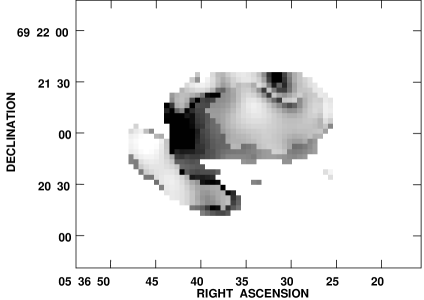
Fig. 5 shows spectral index maps between 1.46 and 4.92 GHz and between 1.46 and 8.41 GHz, each at 16-arcsec resolution and gated so that the spectral index is only calculated where the flux density exceeds 3 at both frequencies. The spectral index between 1.46 and 4.92 GHz () shows a peculiar behaviour in the sense that at the maxima of the radio emission (i.e. at the nucleus and on the south-eastern arm) the spectral index is steep. Away from these sites the spectral index flattens, except towards the north and west of the nucleus and towards the north of the arm. The behaviour of is less uniform which is largely due to the contribution of thermal emission at the higher frequency. The most noticeable flattening of the spectral index in Fig. 5 is between the nucleus and the south-eastern arm where and . The spectral index variation that would normally be expected due to synchrotron and inverse Compton aging of the CR electrons is a gradual steepening of the spectrum away from the sites of acceleration. However, at the distance of NGC 1961 our 16-arcsec beam corresponds to 6.4 kpc which is larger than the typical scale of electron diffusion, and we are effectively averaging over a CR electron population of varying ages.
4 Separating the thermal and synchrotron emission
The maps at 4 frequencies allow us to separate the radio-continuum emission into thermal and nonthermal components. A spectral-fitting technique is used to estimate the two contributions and determine spatial variations in the form of the synchrotron spectrum. For a set of maps at a common resolution a function of the following form is fitted at each pixel
| (1) |
where is the emission from optically thin thermal Bremsstrahlung and is the synchrotron emission from an aged electron population with injection index which has been radiating for a time ; , where is the break frequency. During the fitting procedure the minimum in is found by varying , and with the additional constraint that they are positive definite. The form of the synchrotron spectrum depends on many processes, but to simplify the problem we make the following approximations.
-
1.
The dominant electron energy loss mechanisms are synchrotron and inverse Compton emission. These energy losses are proportional to the energy density of the magnetic field, , and the energy density of the radiation field, , respectively. The magnetic field can be estimated from the standard minimum energy assumption. With a high-frequency cut-off of 10 GHz, a low-frequency cut-off of 100 MHz, a spectral index of 0.8, and a ratio of CR proton-to-electron energy density of , this yields G. can be estimated from the bolometric luminosity, , of the galaxy by assuming that the radiation emitting matter is distributed in a flat cylinder:
(2) We approximate as the sum of the far-infrared and blue emission (yielding W) and hence find eV cm-3.
-
2.
Diffusion in the disc of the galaxy is negligible on scales larger than our observing beam, which in this case is a good approximation.
-
3.
The electrons which are radiating within a given resolution element were all accelerated (injected) a time ago (the electron age).
-
4.
The electron loss time is much greater than the pitch angle randomization time — the so-called JP model (Jaffe & Perola 1974).
-
5.
The electron injection index is .
With these assumptions the electron energy distribution with an injection index is given by:
| (3) |
with , being the Thompson cross section, and . The synchrotron spectrum is obtained by convolving this electron energy distribution with the spectrum for a single electron. The break frequency is given by:
| (4) |
where is the gyrofrequency.
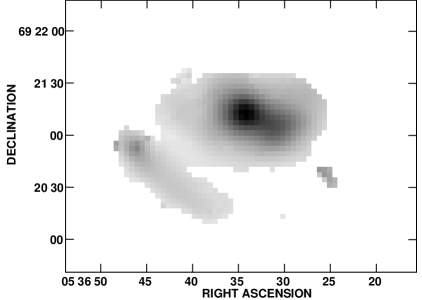
The fitting procedure was applied to all pixels at which the flux density exceeded 3 times the noise at 1.46, 4.92 and 8.41 GHz and 1.5 the noise at 15.4 GHz. The lower gate value at 15.4 GHz was chosen in order included the extended, predominantly nonthermal, radio emission in the analysis. Since the fitting procedure takes full account of the error in the data, the quality of the separation is not affected by this. In Fig. 6 the results of this separation are shown in the form of maps of the thermal emission, synchrotron emission and electron age derived from the breaks in the synchrotron emission. The synchrotron emission is more extended than the thermal emission which is mainly concentrated around the maximum of the radio emission and the south-eastern arm. The electron age reflects the peculiar behaviour which is seen in the spectral index maps and noted above. The ages are highest at the maxima of the radio emission where the spectrum between 1.46 and 4.92 GHz is steepest. The total thermal radio continuum emission found from this fitting procedure is 16 mJy at 1 GHz (i.e. of the total emission).
1 2 3


4 5 6


Fig. 7 shows selected radio-continuum spectra of NGC 1961 and the fits associated to these data together with their positions relative to a 1.46 GHz map. The steep spectrum at the nucleus and at the maximum of the south-eastern spiral arm can be seen (positions 3 and 4). At these locations the flattening of the spectra towards higher frequencies due to a high thermal component is clearly visible and the thermal emission can be determined with good accuracy. The thermal fraction is relatively high (25 at 1 GHz) and the nonthermal spectrum steep ( between 1.46 and 4.92 at both positions). The derived break frequency is low, suggesting that acceleration has not taken place for a considerable period. Away from these positions, the radio spectra show less flattening towards higher frequencies (positions 5 and 6), or none at all (position 1 and 2) and therefore indicate a lower thermal contribution. The radio spectra at the positions 1 and 2 are flat at low frequencies and steepen toward higher frequencies. The break frequency is high, indicating recent acceleration of CR electrons.
5 Discussion
5.1 FIR and radio luminosity
| Distance | 82.9 Mpc | SHSVV1 |
|---|---|---|
| 4.6 arcmin | RC3 | |
| Inclination | SHSVV | |
| 1.5 1023 W Hz-1 | Condon (1987) | |
| 6.4 Jy | IRAS Faint Source Cat. | |
| 21.6 Jy | IRAS Faint Source Cat. | |
| 0.30 | ||
| 2 | 3.9 1037 W | |
| 11.01 | RC3 | |
| 9.5 1037 W | ||
| 0.57 | RC3 | |
| 1.2 1011 | SHSVV1 | |
| 4 1010 | Young et al. (1995)3 | |
| 2.3 1012 | SHSVV1 |
1 adjusted to km s-1 Mpc-1
2
3 assuming a conversion factor of
In Table 2 observational properties of NGC 1961 are presented. Because of its size, NGC 1961 is luminous at all wavelengths. The colour is typical for an Sb galaxy (Huchra 1977) as is the ratio (e.g. Lisenfeld et al. 1996b). This latter value is a measure of the ratio of the SFR averaged over the last yr to the SFR averaged over the last yr, and indicates that the global SF has proceeded constantly during the past yr.
The ratio of the far-infrared (FIR) to radio luminosity, , is a factor of 3-5 lower than for spiral galaxies. The average values derived for galaxy samples range from (bright galaxies, Condon Anderson & Helou 1991) to (normal spiral galaxies, e.g. Condon et al. 1991, Lisenfeld et al. 1996a) with a typical standard deviation of 0.2 in the logarithm. This result is most likely due to an unusually high radio luminosity; the FIR luminosity does not appear unusually low compared to its blue luminosity (), or the inferred H2 mass (; for our Galaxy , Solomon et al. 1992). On the other hand, the radio luminosity is high compared to luminosities in other bands. For example the radio to blue luminosity ratio is a factor of 7.5 higher than found for a sample of Sb galaxies (Hummel et al. 1988). Furthermore, the radio surface brightness is high as reflected in the magnetic field strength, G, estimated using the minimum energy method in which . Hummel et al. (1988) derived for a sample of Sb galaxies (with the same assumption for the minimum energy calculation) an average value of 8 G.
Deviations from the FIR/radio correlation have been found before for cluster (Niklas, Klein & Wielebinski 1995) and interacting galaxies (NGC 2276, Hummel & Beck 1995). Also in these cases the conclusion by the authors was that the radio emission is enhanced compared to normal galaxies. The reasons for this enhancement have been suggested to be either an additional production of CRs by shock acceleration at interstellar shocks produced by the interaction of the galaxy with the intercluster medium (Völk & Xu 1993), or an enhanced magnetic field (Hummel & Beck 1995).
5.2 The spectral analysis
The diffusion scale of the CR electrons in NGC 1961 is approximately 3.7 kpc at 1.46 GHz (taking G, eV cm-3, and a typical diffusion coefficient of cm2s-1). At the distance of NGC 1961 the 16-arcsec beam corresponds to 6.4 kpc; to a good approximation, therefore, the observations average over the synchrotron emission of both newly accelerated and aged CR electrons. The spectral variations reflect variations in the thermal fraction, differences in the conditions of the ISM and in the CR injection, but not effects due to propagation of the CR electrons.
5.2.1 Star formation history
The shape of the non-thermal spectrum reflects temporal variations of past CR acceleration and therefore of the star-formation history if SN remnants are the most important source for the acceleration of CR electrons. The steep synchrotron spectrum at the centre and in the south-eastern arm (positions 3 and 4 in Fig. 7) indicate aged CR electrons; the spectra cannot be explained by continous CR acceleration since this would require an injection spectral index of . In the region between the centre and the south-eastern arm the synchrotron spectrum is much flatter, indicating recent electron acceleration. The electron age distribution derived from the spectral fitting analysis gives a time since acceleration for the CR electron population at the maximum of the radio emission and in the south-eastern arm (positions 3 and 4) of yr, whereas the electrons between these sites are considerably younger ( yr).
This leads to the following picture of the star formation history. The end of CR injection yr ago indicates that the SN activity ceased at that time. The life-time of SN progenitor stars is at maximum years (corresponding to a stellar mass of 5 ), which suggests an epoch of intense SF which ended yr ago. The beginning of the star formation epoch cannot be constrained by our data. The recent acceleration of CR electrons deduced from the flat spectral index of the extended radio emission means that the CR injection and thus SN activity at these sites has recently started. The spectra are too flat to be explained by continous CR acceleration because in this case the contribution from aged CR electrons to the radio emission would steepen the spectrum, and approximating this situation to that of a steady-state we would expect a synchrotron spectral index of . Taking , the expected synchrotron spectral index on the basis of a steady state model is much steeper than the observed one, which is, attributing as an upper limit all of the observed flux density at 15 GHz to the thermal emission, . These results are most consistent with a recent burst of star formation yr ago followed by a peak SN rate about yr ago.
The time-scales derived from this analysis imply that a causal connection between the star formation epochs is possible, in the sense that the earlier star formation period in the arm may have triggered an episode of star formation in the inter-arm region. The width of the south-eastern arm is about 10 kpc and taking a typical sound speed to be 10 km/s a SN shock would take approximately yr to cross the arm which is consistent with the time-scale inferred for the star formation history.
SHSVV suggested that an encounter of NGC 1961 with an intergalactic cloud took place less than yr ago (the rotation time-scale), and triggered an episode of intense star formation in the south-eastern arm. They presented an optical colour image showing that the south-eastern arm has indeed a blue colour, indicating recent star-formation. This is consistent with the star-formation history that we infer.
5.2.2 Variations of the magnetic field
In the above analysis we have assumed that the magnetic field strength is constant over the galactic disk; this is very likely not the case. Compression of the ISM and/or the presence of shocks throughout the disc will lead to enhanced magnetic field strengths and hence increased radio synchrotron luminosity relative to FIR. Such processes were inferred by SHSVV from the morphology of the H i distribution. However, an enhanced magnetic field strength in the south-eastern arm alone cannot explain the large radio-to-FIR ratio since the radio flux density at 1.46 GHz of the south-eastern arm contributes only about 15 to the total flux density of the galaxy.
If the magnetic field varies on scales shorter than that of the CR electron propagation it has an effect not only on the local synchrotron emission but also on the integrated spectral index. In particular, if the magnetic field strength decreases (increases) away from the source of CR electrons, the spectrum can become significantly flatter (steeper). The problem can be solved in a one-dimensional model in which the magnetic field strength and the energy density of the radiation field change with increasing height over the galactic disk, z. Assuming that the magnetic field strength varies as , the energy losses as and the energy dependence of the diffusion coefficient is , then the resulting spectral index is, in the steady state,
| (5) |
(Berezinsky et al. 1990). Taking , we see that in the case (i.e. spatially constant inverse Compton losses dominate the energy losses) the difference of the spectral index with respect to the case of a constant magnetic field is
| (6) |
For an increasing magnetic field with this yields and for . Thus a significant steepening of the spectrum is possible. If however synchrotron losses () dominate then, since , we set and get:
| (7) |
In this case only a very weak steepening of the spectrum is possible; for is zero for all values of and .
For NGC 1961 the high radio surface brightness suggests that synchrotron losses dominate. In this case, the above analysis shows that under steady-state conditions variations in the field strength do not lead to significant variation in the spectral index. Steep spectra in the south-east arm could, however, result from a non-steady-state scenario in which enhancement of the field was followed by a burst of star formation with increased synchrotron loss rate – it is not possible to modify the spectrum significantly without incorporating into a model variation in the star-formation rate.
5.3 A dynamical history for NGC 1961
SHSVV suggest that a collision with an intergalactic cloud has resulted in the unusual H i distribution in NGC 1961. Such an interaction with the IGM can explain in addition to the optical and H i morphology many features of the radio emission provided the interaction triggered an episode of intense SF in the south-eastern arm. The main difficulty with this model is that the massive intergalactic cloud required has not been observed either as ionized (Pence & Rots 1997) or in neutral (SHSVV) gas.
An alternative view is that the disturbed appearance of NGC 1961 could be the result of a merger. SHSVV discarded this possibility since they found no evidence for it either in the optical (i.e. there is no second nucleus) or in the H i distribution. However, our high resolution radio images reveal the presence of a second nucleus in the centre of the galaxy consistent with an advanced merger; the disturbed optical and H i appearance is then naturally explained as a merger remnant. Near-infrared observations will provide an important indication as to whether a highly obscured optical nucleus is present.
6 Conclusions
We have presented radio data at 4 frequencies of the supermassive spiral galaxy NGC 1961. Using these data we fitted a combined aged-synchrotron plus thermal emission spectrum to each point in the galaxy. The most recent star formation, that is traced by the thermal radio emission, is mainly taking place in the centre and the south-eastern arm of the galaxy, whereas the underlying extended radio emission is predominantly nonthermal.
The spectral index distribution between 1.46 and 4.92 GHz over the disk of the galaxy shows a peculiar behaviour. At the maxima of the radio emission the nonthermal spectral index is very steep whereas the extended radio emission has a much flatter spectrum. We discuss various possibilities to explain this peculiar behaviour. The most likely explanation is that the steep spectrum is due to the end of the CR injection about years ago. Assuming that CRs are accelerated mainly in SNRs this means that a phase of intense SF has ceased yr ago. The flat spectrum of the extended emission is a sign of recent CR acceleration in these regions. This could be due to CR acceleration in the shocks of SNRs of a recently formed stellar population. The radio-to-FIR ratio exceeds the average value of spiral galaxies by a factor of 3-4. An overall increase of the magnetic field with respect to the radiation field could account for this high FIR/radio ratio. Spatial variations of the magnetic field, which are likely to be present if the magnetic field is frozen into the gas, are however unable to give the observed distribution of the spectral index.
The discovery of a second radio nucleus leads us to suggest that NGC 1961 is most likely the result of a merger rather than collision with a massive intergalactic gas cloud.
ACKNOWLEGDEMENTS
This research has made use of the NASA/IPAC extragalactic database (NED) which is operated by the Jet Propulsion Laboratory, Caltech, under contract with the National Aeronautics and Space Administration. UL gratefully acknowledges the receipt of a grant of the Deutsche Forschungsgemeinschaft (DFG) and by the Comisión Interministerial de Ciencia y Technología (Spain).
References
- [] Becker R.H., White R.L., Edwards A.L., 1991, ApJS, 75, 1
- [] Berezinsky V.S., Bulanow S.V., GinzburgV.L., Dogiel V.A., Ptsuskin V.S., 1990, Astrophysics of Cosmic Rays, North Holland, p. 189
- [] Condon J.J., 1983, ApJS, 53, 459
- [] Condon J.J., 1987, ApJS, 65, 485
- [] Condon J.J., Anderson M.L., Helou G., 1991, ApJ, 376, 95
- [] de Vaucouleurs G., de Vaucouleurs A., Corwin H., et al., 1991, Third Reference Catalog of Galaxies, Springer-Verlag, New York (RC3)
- [] Gioia I.M., Gregorini L., Klein U., 1982, A&A, 116, 164
- [] Gottesmann S.T., Hunter Jr. J.H., Shostak G.S., 1983, MNRAS, 202, 21p
- [] Howarth N.A., 1990, Ph.D. thesis, University of Cambridge
- [] Huchra J.P., 1977, ApJS, 35, 171
- [] Hummel E., Davies R.D., Wolstencroft R.D., van der Hulst J.M., Pedlar A., 1988, A&A, 199, 91
- [] Hummel E., Beck R., 1995, A&A, 303, 691
- [] IRAS Faint Source Catalog, 1990, Version 2.0, Morshir M., Kopon G., Conrow T., et al., Infrared Processing and Analysis Center
- [] Israel F.P., Mahoney M.J., 1990, ApJ, 352, 30
- [] Jaffe W. J., Perola G.C., 1974, A&A, 26, 423
- [] Lisenfeld U., Völk H.J., Xu C., 1996a, A&A, 306, 677
- [] Lisenfeld U., Völk H.J., Xu C., 1996b, A&A, 314, 745
- [] Niklas S., Klein U., Wielebinski R., 1995, A&A, 293, 56
- [] Niklas S., Klein U., Braine J., Wielebinski R., 1995, A&AS, 114, 21
- [] Pence W., Rots A., 1997, ApJ, 478, 107
- [] Romanishin W., 1983, MNRAS, 204, 909
- [] Shostak G.S., Hummel E., Shaver P.A., van der Hulst J.M., van der Kruit P.C., 1982, A&A, 115, 293 (SHSVV)
- [] Völk H.J., Xu C., 1993, Infrared Phys.Technol. 35, 527
- [] White R.L., Becker R.H., 1992, ApJS, 79, 331
- [] Young J., Xie S., Tacconi L., et al., 1995, ApJS, 98, 219