G309.2–00.6 and jets in supernova remnants
Abstract
We present Australia Telescope Compact Array observations of the supernova remnant (SNR) G309.2–00.6. In a 1.3-GHz continuum image the remnant appears as a near-circular shell, but with two brightened and distorted arcs of emission on opposite sides. H i absorption against the SNR yields a distance in the range 5.4 to 14.1 kpc, corresponding to an age yr.
On the basis of the SNR’s morphology we argue that it is a younger analogue of the W 50 / SS 433 system, and that its unusual appearance is a result of opposed jets or outflows from a central source. A jet-like feature and breaks in the shell can both be seen along the axis of proposed outflow, providing further support for this interpretation; the central source itself is not detected. The SNR may be interacting with the adjacent H ii region RCW 80 through an extension of the proposed outflow beyond its shell. This would put the SNR at the lower limit of its distance range and would imply an age 4000 yr. We consider other SNRs similar to G309.2–00.6, and propose remnants whose shells are affected by jets as one of several classes of SNR from which the presence of a central source can be inferred.
keywords:
H ii regions: individual (RCW 80) – ISM: jets and outflows – radio lines: ISM – shock waves – supernova remnants: individual (G309.2–00.6)1 Introduction
Radio observations of supernova remnants (SNRs) demonstrate a vast range of shapes (e.g. Whiteoak & Green 1996). While most SNRs have a distorted and complicated appearance reflecting their interaction with an inhomogeneous interstellar medium (ISM), some SNRs have striking symmetry properties which require other explanations (e.g. Manchester 1987; Roger et al. 1988; Różyczka et al. 1993; Gaensler 1998).
G309.2–00.6 was first identified as a SNR on the basis of its non-thermal spectrum [Green 1974, Clark, Caswell & Green 1975a]. Subsequent higher resolution observations [Caswell, Milne & Wellington 1981, Kesteven & Caswell 1987, Whiteoak & Green 1996] have shown a distorted shell with two opposed, symmetric bright ends, and a weak compact source in the interior. Continuing a programme to study unusual southern SNRs (Gaensler, Manchester & Green 1998a, hereafter Paper I), we present high resolution 1.3-GHz continuum and H i absorption observations of G309.2–00.6, as well as observations of the region in H, in X-rays and in the near-infrared. In Section 2 we briefly describe our observations and analysis, before presenting our results in Section 3. In Section 4 the morphology of SNR G309.2–00.6 is discussed, and is compared to that of other SNRs.
2 Radio observations and reduction
Radio observations were carried out with the Australia Telescope Compact Array (ATCA; Frater, Brooks & Whiteoak 1992), a six-element synthesis telescope near Narrabri, New South Wales. Three different array configurations were used, as shown in Table 1. Observations were made simultaneously in the radio continuum (centre frequency 1.344 GHz) and in the H i line (centre frequency 1.420 GHz, channel separation 0.83 km s-1) towards a pointing centre RA (J2000) , Dec (J2000) . All other details of the observations, calibration and analysis are as in Paper I.
| Date | Array | Maximum | Time on |
|---|---|---|---|
| Configuration | Baseline (m) | Source (h) | |
| 1996 Jan 18 | 0.75C | 750 | 13 |
| 1996 Feb 03 | 0.75B | 765 | 12 |
| 1996 Feb 25 | 1.5C | 1485 | 13 |
| Resolution | , PA 14∘ |
|---|---|
| rms noise in image | 160 (Stokes ) |
| (Jy beam-1)a | 50 (Stokes ) |
| Geometric centre (, ; J2000) | –62°53′ |
| Geometric centre (, ) | 30917 –0068 (, ) |
| Diameter (arcmin) | , PA –40°(shell) |
| , PA +45°(ears) | |
| Flux density at 0.4 GHz (Jy)a,d | |
| Flux density at 0.8 GHz (Jy)b,d | |
| Flux density at 1.3 GHz (Jy)c,d | |
| Spectral index |
aMills Cross data [Green 1974]
bMOST data [Whiteoak & Green 1996]
cATCA data (this paper)
d 1 jansky (Jy) W m-2 ; errors of 10 per cent have
been assumed in Mills Cross and MOST data
3 Results
3.1 Total Intensity
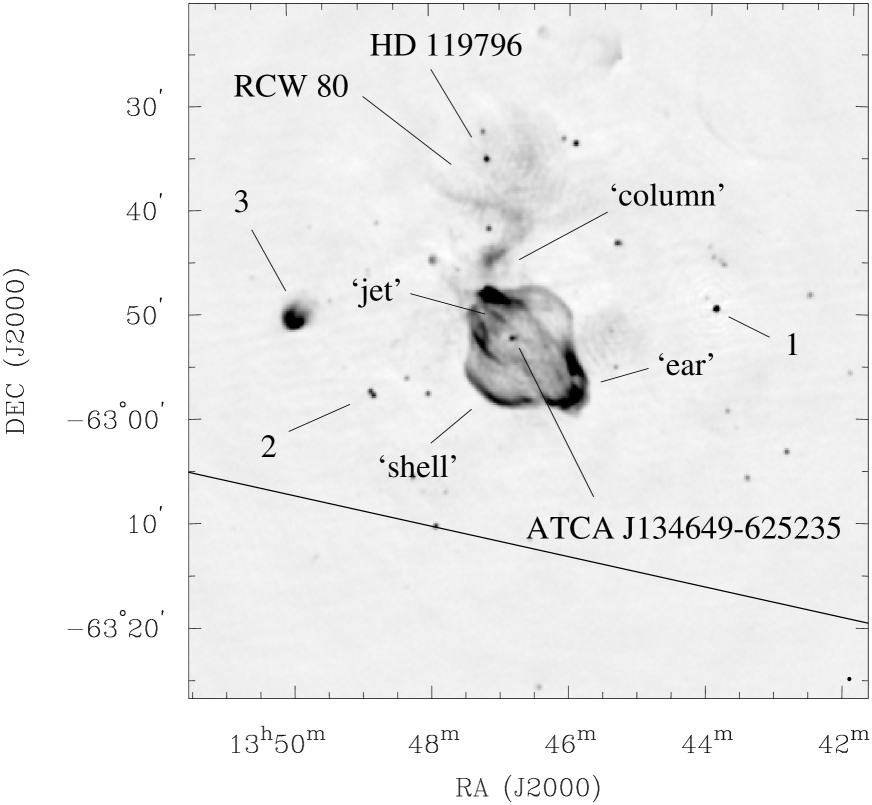
Fig 1 shows total intensity images of G309.2–00.6, while Fig 2 shows an image of the entire field. Properties of sources of note are given in Table 3. Source 3 corresponds to the H ii region G309.548–0.737 [Haynes, Caswell & Simons 1979, Caswell & Haynes 1987].
| Source | Position | Spectral indexa | Other names | ||
| Equatorial (J2000) | Galactic | (Jy) | (, ) | ||
| 1 | 13h43m53s –62°49′41″ | 30888 –0056 | 0.08 | ||
| central source | 13h46m49s –62°52′35″ | 30920 –0068 | 0.02 | +0.60.6 | ATCA J134649–625235 |
| HD 119796 | 13h47m10s –62°35′20″ | 30930 –0041 | 0.06 | 0.0 | HR 5171, IRAS 13436–6220 |
| RCW 80 | 13h47m –62°38′ | 3093 –004 | 0.7 | +0.30.5 | Gum 48d |
| column | 13h47m –62°45′ | 3092 –006 | 0.6 | –0.60.5 | |
| jet | 13h47m –62°50′ | 3092 –006 | 0.02 | — | |
| 2 | 13h48m50s –62°57′51″ | 30940 –0082 | 0.06 | ||
| 3 | 13h50m –62°50′ | 3096 –007 | 1.7 | G309.548–0.737, PMN J1349–6250 | |
a Calculated between 1.344 GHz (this paper) and 843 MHz [Green, Cram & Large 1998].
The remnant is comprised of two morphological components: firstly two roughly circular arcs of emission to the south-east and north-west which we subsequently refer to as the ‘shell’, and secondly two bright, sharply curved arcs to the south-west and north-east (the ‘ears’). The two parts of each component are diametrically opposed with respect to the SNR’s geometric centre, and the two components are oriented at position angles perpendicular to each other. Although no connecting structure is apparent, the two arcs of the shell can be construed to form a single circular ring.
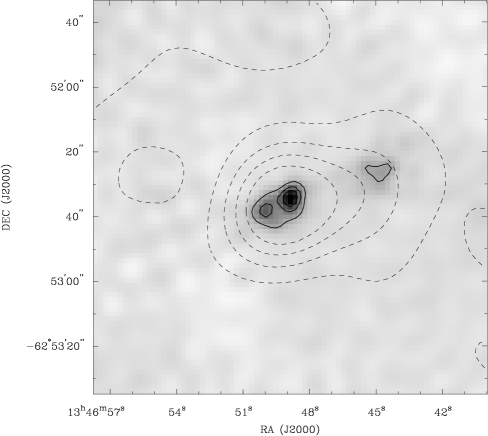
Within the remnant, to the north-east of centre, is a slightly extended source which we designate ATCA J134649–625235. At the available resolution (20 arcsec – see Table 2), this source has a cometary appearance, with a tail trailing out to the west. In Fig 3 is shown an image of ATCA J134649–625235 made using the observations in Table 1, but including the sixth ATCA antenna, 3 km west of the track upon which the other five antennae are stationed. This increases the maximum baseline to 5000 m, corresponding to a resolution of 5 arcsec. (Note that this gives a significant gap in the coverage between 1500 m and 5000 m, and so is not appropriate for imaging the entire remnant.) At this higher resolution, the source breaks into a double source to the east, and a fainter extended source to the west.
To the north of the remnant is a narrow column of emission. Extending northwards from the SNR’s north-eastern ear, this column bends around to the west and then to the north again, before opening up into a broader diffuse region forming a semi-circular arc. The arc is coincident with the H nebula RCW 80 [Rodgers, Campbell & Whiteoak 1960, Georgelin et al. 1988], while within it is a point source coincident with the position of the double star HD 119796 [Humphreys, Strecker & Ney 1971, Hirshfeld & Sinnott 1985].
Between ATCA J134649–625235 and the north-eastern ear, is a collimated feature extending away from the SNR’s centre, which we dub the ‘jet’. There is a distinct break in the emission from the north-eastern ear where it intersects the jet. The jet and the break both lie along the symmetry axis defined by the two ears. The bright linear component of the jet is 15 long. At its south-west end the jet abruptly fades, although a faint continuation can be seen extending to the SNR’s centre. Beyond the break in the north-eastern ear is faint emission extending 3 arcmin beyond the SNR.
The south-west ear also shows a break, although it is less distinct, and does not lie along the symmetry axis. Faint emission which might correspond to a less distinct and less collimated counterpart to the jet is seen just within this ear.
Derived parameters for the SNR are given in Table 2, and were determined by methods described in Paper I. Total flux density measurements of G309.2–00.6 are shown in Table 2 – we exclude single dish observations [Day, Thomas & Goss 1969, Clark, Caswell & Green 1975a, Duncan et al. 1995], which are confused by emission from RCW 80 to the north. We consequently compute a spectral index for SNR G309.2–00.6 of , where . The spectral index calculated here is somewhat steeper than previous results (; Clark et al. 1975a), probably due to confusion with RCW 80. We note that the largest spatial scale sampled in our image is 17 arcmin, only slightly larger than the remnant. Although our data include additional spacings corresponding to scales of 13 and 10 arcmin, one could argue that we are missing some of the SNR’s flux density, and that its spectrum is consequently flatter than that we have just determined. However, the ATCA flux density is greater than that extrapolated from lower frequency data, and we argue that little flux is missing.
Although ATCA J134649–625235, RCW 80 and the column feature are of low surface brightness, we can put rough constraints on their spectra, as listed in Table 3. The lack of resolution in the MOST image of Whiteoak & Green [Whiteoak & Green 1996] prevents a calculation of the jet’s 843 MHz flux density and hence of its spectrum.
3.2 Polarization
3.2.1 SNR G309.2–00.6
Images of polarized emission were produced as in Paper I, the effects of bandwidth depolarization being minimised by imaging Stokes and in 13 distinct frequency channels, forming for each channel, and then combining. No circular polarization was detected from G309.2–00.6; linear polarization from the SNR is shown in Fig 4. We put a lower limit of 75 mJy on its linear polarization, corresponding to an overall fractional polarization of 1.4 per cent (instrumental polarization at the field centre is negligible). However as a function of position, the fractional polarization in some places reaches the theoretical maximum of 70%. Much of the SNR’s outer edge is polarized, correlating roughly with total intensity, with a rough consistency in position angle over a given region. There is no suggestion that the ear components have different polarimetric properties from the shell. No polarization is detectable from ATCA J134649–625235 or from the jet.

As demonstrated in Paper I, the multiple channels recorded in the ATCA’s continuum mode can be used to derive a rotation measure (RM) towards linearly polarized sources. In Fig 5 we show the frequency dependence of polarization position angle for four regions of the SNR. Towards the two shell components and towards the north-eastern ear, we find a consistent RM of –930 rad m-2 with fluctuations (1 ) of 60 rad m-2. The south-western ear has a distinctly different RM of –570 rad m-2, with 20 rad m-2 fluctuations. As discussed in Paper I, the frequency range across which measurements have been made is relatively small, resulting in large errors when extrapolating the position angles to infinite frequency. Thus from the current data we cannot determine the intrinsic orientation of polarization vectors in the source.

3.2.2 Other sources
No linear polarization is detected from RCW 80 or from the column, either formally at the 5- level, or by eye at any lower level. Sources 1 and 3 are both 4 per cent linearly polarized after correction for instrumental polarization. Source 2 and HD 119796 are less than 3 per cent linearly polarized. No circular polarization is detected from any source in the field.
3.3 H i line
As in Paper I, we convert systemic LSR velocities into distances using the best fitting model for Galactic rotation of Fich, Blitz & Stark [Fich, Blitz & Stark 1989], and assume km s-1 uncertainties in velocities. We adopt a solar orbital velocity km s-1 and a distance to the Galactic Centre kpc, as recommended by Kerr & Lynden-Bell [Kerr & Lynden-Bell 1986].
Our ATCA observations lack the data at short spacings required to produce useful H i emission spectra. Thus in considering H i absorption towards sources of interest, we compare with emission seen towards the nearby () SNR G311.5–00.3 [Caswell et al. 1975]. Their profile shows continuous emission from –60 km s-1 up to 0 km s-1, then a strong peak at +35 km s-1 and weaker emission near +100 km s-1. Emission in the surveys of Jackson [Jackson 1976] and Kerr et al. [Kerr et al. 1986] shows similar structure.
3.3.1 Nearby sources
Absorption was measured against sources 1, 2 and 3; the results are shown in Fig 6. Absorption towards source 1 is seen down to –50 km s-1, corresponding well to the observed tangent velocity in this direction [Jackson 1976, Kerr et al. 1986], and to that expected from the rotation curve of Fich et al. [Fich, Blitz & Stark 1989]. Absorption towards source 1 is also seen at –5 km s-1, and then again at +40 km s-1. These features are similar to those seen in emission towards G311.5–00.3 as described above. Towards source 2, significant absorption is seen at negative velocities out to –60 km s-1. A weak feature is seen at +40 km s-1. Absorption against source 3 is detected between –50 and –40 km s-1, then at –25 km s-1 and –5 km s-1. No absorption is detected at positive velocities. Other sources in the image, including the column, HD 119796 and RCW 80, were too weak or too far from the phase centre to obtain useful absorption against.


3.3.2 SNR G309.2–00.6
Useful absorption spectra were obtained against three parts of the remnant: towards each ear, and towards the south-east shell component, as shown in Fig 6.
Absorption towards the south-western ear is seen between –50 and –25 km s-1, possibly at –10 and then at 0 km s-1. No convincing absorption is seen at positive velocities. Towards the north-eastern ear, absorption is detected at –50 and –25 km s-1. Along the south-eastern shell component, we see absorption only between –60 and –25 km s-1.
Examination of individual velocity channels clearly shows the outline of the SNR in absorption, demonstrating that it is indeed continuum emission from the SNR which is being absorbed and not background H i features (cf. Landecker, Roger & Dewdney 1982). In any case, the brightness temperature of the SNR in the relevant regions is 20–25 K, significantly brighter than typical H i emission features.
3.4 Other wavelengths
3.4.1 Optical observations
A field containing G309.2–00.6 was observed by A.J. Walker on 1997 Apr 30, as part of a wide-field H survey of the Southern Galactic Plane being carried out at Siding Spring Observatory [Buxton, Bessell & Watson 1998]. Three 10 min exposures were made with a 400 mm, f/4.5 Nikkor-Q lens, through a filter centred at 657.0 nm with a width of 1.5 nm. The detector was a 20482048 CCD with a resolution of 12″ pixel-1. The images were bias and dark subtracted, flat-fielded and then combined with a median filter. A final image, without continuum subtraction, is shown in Fig 7(a).
RCW 80 is clearly delineated in H, having a similar arc-like appearance to its radio morphology. As in the radio, HD 119796 is visible at the centre of this region. No H emission from the SNR or from the column to its north is apparent. The open cluster NGC 5281 is visible in the remnant’s interior, at RA (J2000) , Dec (J2000) . Its distance has been estimated to be 1.3 kpc [Moffat & Vogt 1973].
3.4.2 X-ray observations
G309.2–00.6 was observed by the ROSAT Position Sensitive Proportional Counter (PSPC) in 1992 Aug for 3931 sec; the data are now available from the ROSAT public archive. In the energy range 0.1–0.4 keV, only a slight enhancement above the background is seen towards the SNR. However in Fig 7(b) is shown emission in the range 0.4–2.4 keV, where the compact X-ray source 1WGA J1346.5–6255 (White, Giommi & Angelini 1994a,b) can be seen near the remnant’s centre, and weak diffuse emission can be associated with the rest of the SNR. No significant emission can be seen along the column or from RCW 80.
3.4.3 Infrared observations
An IRAS 60 m image of the region, processed with the HIRES algorithm [Aumann, Fowler & Melnyk 1990], is shown in Fig 7(c). Strong IR emission is coincident with RCW 80 and with HD 119796 ( IRAS 13436–6220), but no obvious emission can be associated with the SNR or with the column to its north. The point source on the north-western edge of the SNR is IRAS 13428–6232.
4 Discussion
4.1 Field sources
H i absorption at +40 km s-1 towards source 1 puts it at a distance of at least 14 kpc. Although no absorption is seen at +100 km s-1 corresponding to emission seen towards G311.5–00.3, this may be due to the small angular size of absorbing clouds at this large distance. Source 1’s spectral index and low level of linear polarization is consistent with it being a background radio source. Similar arguments apply to source 2, which in addition has the characteristic double-lobed morphology of a radio galaxy.
Source 3 (G309.548–00.737) shows absorption out to the tangent point. Using a recombination line velocity towards it of –43 km s-1 [Caswell & Haynes 1987], we can thus (within the uncertainties) put this source at the tangent point, corresponding to a distance 5.41.6 kpc. The source’s morphology and flat spectrum are in accord with its identification as an H ii region. The low level of linear polarization we detect from it is not, however. Either there is a previously unidentified synchrotron component to its emission, or the instrumental polarimetric response of the ATCA is not being characterised correctly at this large distance from the phase centre. Examination of the position angle of polarized emission on a channel-by-channel basis shows no evidence for Faraday rotation as is observed towards the SNR. We thus consider instrumental effects to be a more likely explanation. We note that instrumental response near the phase centre is both minimal and well-characterised, and that polarimetry in that part of the field is reliable (cf. Paper I).
The infrared and H emission associated with RCW 80 and its flat spectrum are all consistent with it being a thermal H ii region. A radial velocity km s-1 [Georgelin & Georgelin 1970, Avedisova & Palous̆ 1989, Avedisova 1997] puts it at the tangent point ( kpc). One of the components of HD 119796 has been proposed as the exciting star for RCW 80 [Georgelin et al. 1988], but its photometric distance of 3.2 kpc [Humphreys, Strecker & Ney 1971] suggests that it may be unrelated.
4.2 SNR G309.2–00.6
4.2.1 Physical Parameters
The three absorption spectra obtained towards the SNR are all consistent, showing absorption out to the tangent point, but not at positive velocities. Thus we assign a lower velocity limit to the SNR of km s-1, and an upper limit km s-1, corresponding to emission seen at this velocity towards G311.5–00.3 [Caswell et al. 1975] and to absorption seen against source 1 and weakly against source 2.
These lower and upper limits on the kinematic velocity correspond to respective distances of 5.41.6 kpc and 14.10.7 kpc. This result immediately confirms NGC 5281 as an unrelated foreground object. Using the shell component to define the extent of the SNR, we thus find SNR G309.2–00.6 to have a diameter between 17 and 45 pc. Through arguments as in Paper I, this correponds to an age between 1000 yr (assuming the lower limit on the distance and free expansion) and 20 000 yr (assuming the upper limit and an SNR in the adiabatic phase). The low level of X-ray emission towards the SNR suggests a line-of-sight column density of cm-2 (cf. Hwang & Markert 1994, who made marginal and non-detections of SNRs using comparable exposure times), which for typical ISM densities is consistent with the distance range determined using H i absorption. The Scutum-Crux arm of the Galaxy lies in this direction at distances between 5 and 9 kpc [Georgelin & Georgelin 1976, Georgelin et al. 1988], which weakly favours a distance to G309.2–00.6 in the lower half of the quoted range.
4.2.2 Polarization
G309.2–00.6 is only weakly polarized; as for G296.8–00.3 in Paper I, this is most simply explained in terms of differential Faraday rotation within the beam, consistent with the observed fluctuations in RM and typical of polarimetric observations at this low frequency.
The RM measured towards most of the SNR (regions A, B and D of Fig 4), when combined with a model for the Galactic electron density distribution [Taylor & Cordes 1993], corresponds to a mean interstellar magnetic field along the line of sight in the range 1–9 G, directed away from us. Fig 5 demonstrates a distinct difference in RM between the south-western ear (region C) and the rest of the SNR, however. We now consider whether this difference can be explained in terms of conditions internal to the remnant.
We first require a well-ordered field within the SNR, and indeed the electric field vectors in this region are particularly uniform. For a distance to the SNR of kpc, the length of the line of sight through the tip of the south-west ear is pc. We assume a line-of-sight magnetic field within this region of G, consistent with adiabatic compression of the interstellar magnetic field by the SNR shock. The resultant thermal electron density required over the entire region is then at least cm-3, an improbably high value. Even when invoking turbulent amplification of the magnetic field, or compression by a radiative shock or by the outflow proposed below, it is difficult to see how such a large change in RM can be produced along such a small line of sight. A greatly amplified magnetic field would also cause depolarization resulting from internal Faraday rotation, yet the level of fractional polarization in region C is not significantly different from regions A, B or D. We thus ascribe the differences in RM to variations in fields and ionized gas in the ambient ISM along the line of sight. Variations (and even reversal of sign) of the RM have certainly been observed across other remnants [Dickel & Milne 1976].
4.2.3 Morphology
The shell and ear components of G309.2–00.6 have comparable H i absorption spectra and (at least for the north-eastern ear) similar rotation measures, and are of comparable angular size. Also, the shell component cannot be seen at the position angles of the ears. This leads us to conclude that we are unlikely to be seeing two structures superimposed, and in further discussion we assume G309.2–00.6 to be a single object.
SNRs with multiple loops and/or significant variations in radius and brightness are reasonably common – a perusal of the catalogue of Whiteoak & Green [Whiteoak & Green 1996] suggests that 20 per cent of SNRs have some sort of multi-ringed structure, corresponding to Galactic SNRs of the 215 currently identified [Green 1996]. Such structures are usually interpreted in terms of expansion into multiple cavities in the ISM [Braun & Strom 1986, Pineault, Landecker & Routledge 1987, Milne et al. 1989, Dubner et al. 1994]. It is possible that G309.2–00.6 represents such a system: the shell component alone is quite undistorted and would represent the original SNR, while the ears would trace an ellipsoidal cavity into which the blast wave has then expanded. However the centres of the shell and ear components coincide to within 30 arcsec. For two interlocking cavities, we estimate the probability of such close alignment of their centres to the line of sight to be . Thus even if all multi-ringed SNRs are due to multiple cavities, it is unlikely that even one such remnant would show as good an alignment as seen for G309.2–00.6. We therefore consider it unlikely that the SNR’s appearance can be explained by simply invoking the inhomogeneity of the ISM.
The striking symmetry of the two ears in terms of brightness, shape and opposed positions around the shell suggest that the mechanism responsible for them has a characteristic axis. For example, an SNR evolving in a strong ambient magnetic field will become considerably elongated along the field direction [Insertis & Rees 1991, Różyczka & Tenorio-Tagle 1995], perhaps resembling the ears of G309.2–00.6. However such a model cannot explain the round and symmetric shell component, and in any case requires an ambient field 1000 times stronger than encountered in the ambient ISM. Another possibility is that the axis is defined by the progenitor star: Blondin, Lundqvist & Chevalier [Blondin, Lundqvist & Chevalier 1996] show that expansion of a SNR into a progenitor wind of axisymmetric density distribution causes the shell to develop opposed protuberances, producing a morphology quite like that of G309.2–00.6. However as we have discussed in Paper I, this shaping occurs when the remnant is very young, and it is not clear how the SNR might ‘remember’ the effects of its progenitor wind as it expands to large sizes.
The alternatives we have just discussed cannot be ruled out, but we argue that the appearance of G309.2–00.6 can be best explained if the SNR contains a central source which produces collimated outflows or jets in two opposed directions. The shell component represents the original, undistorted SNR. The outflows collide with the expanding remnant, their pressure distorting and brightening the two opposite sides and thus producing the ears. G309.2–00.6 is then similar to SNR G039.7–02.0 (W 50), in which the centrally located X-ray binary SS 433 generates opposed jets which distort the surrounding shell [Elston & Baum 1987, Murata & Shibazaki 1996]. G309.2–00.6 is much younger than W 50 (age yr), and indeed a rough progression in morphology can be seen from the former to the latter. G309.2–00.6 has a distinct, almost circular shell with ears protruding 30 per cent of the radius beyond it; in W 50, however, the original shell is much fainter and filamentary, with ears extending up to twice the radius of the shell from the remnant’s centre [Elston & Baum 1987].
Outflows such as those claimed here are generally associated with jets produced by an accreting binary system [Hjellming & Johnston 1988, Fender, Bell Burnell & Waltman 1997], but can also be produced by an isolated neutron star [Sulkanen & Lovelace 1990, Hester et al. 1995, Bell 1997]. An obvious candidate for such a source in SNR G309.2–00.6 is ATCA J134649–625235 (Fig 3). No X-ray counterpart to ATCA J134649–625235 is apparent, and examination of the Digitized Sky Survey shows no optical source within 8 arcsec. While the source’s radio morphology is suggestive of the episodic ejections seen in the X-ray binaries GRS 1915+10 [Mirabel & Rodriguez 1994] and SS 433 [Vermeulen et al. 1993], the axis so defined is not aligned with the axis for outflow implied by the SNR morphology, nor does the source itself lie on this symmetry axis. We thus think it most likely that this source is not associated with the SNR.
We put a 5- upper limit of 0.4 mJy on the 1.3 GHz flux density of any other central source. No X-ray counterpart is apparent either; while 1WGA J1346.5–6255 is suggestive, it is spatially coincident with and is probably associated with one or more stars in NGC 5281. The uncertainty in position, the low Galactic latitude and the proximity to NGC 5281 all make optical identification difficult. We thus find no observational evidence for the postulated central source. However the radio upper limit is consistent with a binary system in a quiescent state (cf. GRO J1655–40; Hjellming 1997) or an isolated pulsar which is beaming away from us, while the lack of X-rays can be attributed to absorption in the Galactic Plane, confusion with diffuse soft emission from the SNR, and the comparatively short exposure time. X-ray observations at higher energies and with greater sensitivity with ASCA or AXAF may be more successful (cf. Gotthelf, Petre & Hwang 1997).
The jet feature seen in our radio image aligns with the axis of symmetry defined by the two ears, and can be traced back faintly to the centre of the SNR. Thus it can be argued that this structure (and its less distinct counterpart in the remnant’s south-west) is indeed emission representing or surrounding a jet, and that it delineates the proposed outflow. That the brightest emission from the jet is produced along a segment just within the original SNR shell may be due to a sudden change in the jet’s environment, may represent episodic ejections of material, or may demarcate the progress of a reverse shock generated when the outflow collides with the SNR shell [Murata & Shibazaki 1996]. There is no evidence for an outflow in X-rays comparable to the X-ray lobes seen in the interior of W 50 [Seward et al. 1980, Watson et al. 1983, Yamauchi, Kawai & Aoki 1994]. However, the ROSAT observations described in Section 3.4.2 extend only up to 2.4 keV, so that absorption along the line of sight may prevent detection. As for the central source, hard X-ray observations may overcome this problem.
Comparison of our observations with the 843 MHz image of Whiteoak & Green [Whiteoak & Green 1996] shows no evidence that the ears have a different spectral index to the rest of the shell. The lack of sufficient separation in frequency betweem the 843 MHz and our observations prevents a sensitive analysis of spatial spectral index variations (e.g. Anderson & Rudnick 1993; Gaensler et al. 1998b). However, we note that the ears contribute 50 per cent of the total flux density of SNR G309.2–00.6: thus if we demand the ears to have a significantly flatter spectral index than the mean for the SNR, the rest of the remnant must be steeper by the same amount. No such effect is apparent in the data, and it is thus unlikely that the brightening observed in the ears is due to an injection of relativistic particles from the central outflow.
The distinct break in the north-eastern ear at the point where it is crossed by the jet suggests that the pressure of the outflow carries emitting particles away from the point of impact, thus producing the apparent break in emission. Faint emission seen along the axis of the jet, just outside the north-eastern ear, may represent emitting electrons which were once part of the shell.
It is interesting to note that the brightest region of the north-eastern ear is immediately adjacent to the break; a similar situation exists for the south-western ear. This may be a result of additional shocks and turbulence driven into the shocked region of the SNR by the outflow. The resulting enhanced particle acceleration in these regions then produces the bright ears (cf. Frail et al. 1997).
The column appears to attach to the SNR at the break in the north-eastern ear, and may join with the jet in the remnant’s interior. The bends and turns along the column make it difficult to see how it might be a direct extension of the jet, but we note that radio emission associated with the possible jet in Vela X has a similarly twisted appearance [Frail et al. 1997]. One possibility is that the column could represent an interaction between the jet and a distorted old star trail [Nicholls & Le Strange 1995]. This can explain the bends seen along the length of the column, and also why no such structure is seen beyond the opposite ear.
The column broadens at its northern end to overlap with RCW 80 at the apex of its arc, suggesting that it joins onto RCW 80. If the column is unassociated with the SNR, one could interpet it and RCW 80 as being a single, complex thermal region. The lack of optical and infrared emission associated with the column might then be explained by absorption due to associated molecular material.
On the other hand, if the column is associated with both the SNR and the H ii region, then we have a single system, where the outflow and/or column connects the SNR with the thermal arc. Associating G309.2–00.6 with RCW 80 puts the SNR at the lower limit of the distance range inferred from its H i absorption, and implies a shell radius of pc. Assuming expansion into a homogenous medium of density cm-3, we find that the remnant has swept up between 20 and 170 , and is thus most likely in a transition between free expansion and the subsequent Sedov-Taylor phase. Assuming and as adopted in Paper I (where is the kinetic energy of the explosion in units of erg), we derive an upper limit on the remnant’s age of 4000 yr.
4.3 Other SNRs with jets
G309.2–00.6 bears a remarkable resemblance to G332.4+00.1 (Kes 32), a roughly circular shell which is distorted and brightened at one end. A flat-spectrum collimated structure extends through a break in the shell in the region of greatest distortion, broadening and kinking before terminating well outside the remnant in an extended thermal ‘plume’ [Roger et al. 1985, Kesteven et al. 1987]. Higher resolution ATCA observations of G332.4+00.1 (M. J. Kesteven 1997, private communication) show a collimated feature within the shell near the break. Thus both G309.2–00.6 and G332.4+00.1 have an undistorted shell component, a distorted and brightened ear component containing both a jet feature and a break in the shell, and a winding column which attaches the SNR to a thermal nebula. The main difference between the two SNRs is that G309.2–00.6 appears to be affected by twin outflows, while G332.4+00.1 seems to involve only a one-sided jet. The ‘column’ component of G309.2–00.6 may have a steeper spectrum than the equivalent component of G332.4+00.1, but the uncertainties in the former’s spectral index are large because of its low flux density.
G309.2–00.6 also has some resemblance to G320.4–01.2 (MSH 15-52), X-ray observations of which show a one-sided synchrotron jet emanating from the central pulsar B1509–58, which then appears to collide with the H nebula RCW 89 [Tamura et al. 1996, Brazier & Becker 1997, Gaensler et al. 1998b]. As for G309.2–00.6 and G332.4+00.1, the radio morphology of the remnant is significantly distorted where the outflow intersects the shell.
| SNR | Other name | Jets? | Reference |
| G039.7–02.0 | W 50 / SS 433 | XR | 1, 2 |
| G309.2–00.6 | R | This paper | |
| G320.4–01.2 | MSH 15–52 | X | 3, 4, 5 |
| G332.4+00.1 | Kes 32, MSH 16–51 | R | 6, 7 |
| 0540–693 | Hen N 158A | R? | 8 |
| G109.1–01.0 | CTB 109 | X | 9 |
| G290.1–01.8 | MSH 11–61A | X? | This paper |
| G308.8–00.1 | – | 10 | |
| G315.9–00.0 | R | 7 | |
| G327.6+14.6 | SN 1006 | – | 11 |
(1) Seward et al. [Seward et al. 1980] (2) Hjellming & Johnston [Hjellming & Johnston 1981] (3) Tamura et al. [Tamura et al. 1996] (4) Brazier & Becker [Brazier & Becker 1997] (5) Gaensler et al. [Gaensler et al. 1998b] (6) Roger et al. [Roger et al. 1985] (7) Kesteven et al. [Kesteven et al. 1987] (8) Manchester et al. [Manchester, Staveley-Smith & Kesteven 1993] (9) Gregory & Fahlman [Gregory & Fahlman 1983] (10) Kaspi et al. [Kaspi et al. 1992] (11) Willingale et al. [Willingale et al. 1996]
We summarise the SNRs which we have argued are similar to G309.2–00.6 in the first half of Table 4. In the second half of Table 4 we suggest some further candidates for such interactions. While somewhat speculative, they each satisfy at least some of the morphological criteria observed in G309.2–00.6 and in the other remnants discussed above. We now briefly discuss these additional candidates:
-
0540–693 (Hen N 158A): This young (1000 yr) composite SNR is in the Large Magellanic Cloud, and is associated with the Crab-like pulsar PSR B0540–69. The shell component of this remnant is distinctly brightest in the east in both radio [Manchester, Staveley-Smith & Kesteven 1993] and X-ray [Seward & Harnden 1994] images, with possible connecting structure to the central pulsar and its associated synchrotron nebula. Manchester et al. [Manchester, Staveley-Smith & Kesteven 1993] propose that injection of particles from the pulsar into the shell may cause the observed morphology.
-
G109.1–01.0 (CTB 109): This SNR is associated with the long-period, possibly accreting pulsar 1E 2259+586. Gregory & Fahlman [Gregory & Fahlman 1983] propose that a collimated X-ray feature and the unusual radio morphology are consistent with precessing jets originating from the pulsar. More recent observations (e.g. Rho & Petre 1997) do not support this interpretation, however.
-
G290.1–01.8 (MSH 11–61A): A radio image of this remnant [Whiteoak & Green 1996] shows it to have two opposed radio lobes protruding approximately 50 per cent of the SNR radius beyond its otherwise circular shell, resembling the ‘ears’ observed in W 50 and claimed here for G309.2–00.6. We thus propose this SNR as a possible new example of a shell SNR with jets. A distance to G290.1–01.8 of 7 kpc [Rho 1995, Rosado et al. 1996] corresponds to an age 10 000 yr [Rho 1995], similar to that of G309.2–00.6. In X-rays, an ASCA spectrum of G290.1–01.8 shows emission lines characteristic of hot plasma in the remnant’s interior [Rho 1995]. However, there is the suggestion in an earlier Einstein image of faint extensions along the axis defined by the lobes [Seward 1990], and we speculate that these may be possible analogues of the X-ray jets seen in W 50. We note that the inclusion of G290.1–01.8 in this class is mutually exclusive with a tentative association between it and the pulsar PSR J1105–6107, from the remnant’s centre [Kaspi et al. 1997]. Demonstration of either hypothesis would conclusively rule out the other.
-
G308.8–00.1: This SNR consists of two opposed arcs of completely different morphology. The northern arc has a bright, possibly filled-centre appearance, which Kaspi et al. [Kaspi et al. 1992] suggest may be due to an outflow from the associated pulsar PSR B1338–62.
-
G315.9–00.0: This faint shell has a narrow collimated protrusion extending well beyond its boundary [Kesteven et al. 1987]. The shell is brightest where the protrusion joins onto it.
-
G327.6+14.6 (SN 1006): The remnant of SN 1006 is a classic barrel SNR. Willingale et al. [Willingale et al. 1996] argue that its symmetric, bilateral appearance is produced by twin electron beams originating from an unseen central engine. We note, however, that many other explanations have been proposed [Kesteven & Caswell 1987, Roger et al. 1988, Reynolds 1996, Gaensler 1998].
There thus may be as many as ten SNRs for which jets from a central source interact with, brighten and/or distort the surrounding shell. Along with SNRs in which an associated pulsar or other source is detected directly [Kaspi 1996, Brazier & Johnston 1998], there is now a large and diverse collection of SNRs for which the presence of a compact stellar remnant can be inferred: there are SNRs affected by jets and outflows as discussed above, remnants which are distorted and re-energised by the passage of an associated pulsar through the shell [Shull, Fesen & Saken 1989] and SNRs containing traditional pulsar-powered components (‘plerions’; e.g. Helfand & Becker 1987). Evidence that plerions may also be powered by jets [Hester et al. 1995, Brazier & Becker 1997] suggests that the various interactions between a SNR and a compact source may all be manifestations of the same phenomenon, the differences depending on the details of the environment and position of the source within the SNR.
The fraction of SNRs in which a central source is observed or can be inferred is still well below the 80% of supernovae that are of type Ib or II [van den Bergh & Tammann 1991] and thus expected to produce such sources. This discrepancy has traditionally been explained in terms of a population of radio pulsars of low luminosity or which are not beaming towards us [Manchester & Taylor 1977, Taylor & Stinebring 1986, Manchester 1987]. However, we are now aware of a variety of new complications which prevent such detections:
-
1.
Observational selection effects may prevent the detection of a pulsar or its associated nebula. As mentioned above luminosity and beaming may account for a lack of associations, while emission from a pulsar nebula may be swamped by emission from the surrounding shell or from other sources. An instance in which several of these effects are operating simultaneously is PSR B1853+01 in the SNR G034.7–00.4 (W 44): the pulsar is particularly faint [Wolszczan et al. 1988], and its surrounding nebula is difficult to distinguish against the rest of the SNR in radio [Frail et al. 1996] and in X-rays [Harrus, Hughes & Helfand 1996]. SN 1987A may be another object in which emission from the remnant prevents detection of any central neutron star [McCray 1993], while we have argued above that SNR G309.2–00.6 also falls into this category;
-
2.
The environment surrounding a neutron star may prevent production of a detectable nebula and/or jets. For example, Bhattacharya [Bhattacharya 1990] has argued that the lack of a radio plerion around PSR B1509–58 can be explained if its progenitor supernova exploded into a low-density cavity;
-
3.
A compact stellar remnant may be given a high spatial velocity by its supernova explosion. Once such a source passes well beyond its SNR’s boundaries, it may not be identified as associated with the remnant, and will probably no longer influence the remnant’s morphology (e.g. Gaensler & Johnston 1995). A possible example of such a system is the X-ray binary Circinus X-1, which has been associated with the nearby SNR G321.9–00.3 [Clark, Parkinson & Caswell 1975b, Stewart et al. 1993];
-
4.
Some compact remnants may not produce detectable emission and/or may not interact appreciably with their environment. Examples include ‘injected’ neutron stars, born spinning slowly, and ‘magnetars’, neutron stars born with high magnetic fields which cause them to slow down at a rapid rate (see Frail 1998 for a review and discussion). Such sources may not emit radio pulses [Chen & Ruderman 1993, Baring & Harding 1998], and their nebulae will rapidly fade below detectability [Bhattacharya 1990]. An uncertain fraction of supernovae will produce isolated black holes [Brown & Bethe 1994], which are also undetectable and which are expected to show no interaction with their remnant.
5 Conclusion
We have presented H i and 1.3-GHz continuum observations of SNR G309.2–00.6, as well as H, ROSAT PSPC and IRAS 60 m data on the region. We put a lower limit on linear polarization from the SNR of 1.4 per cent, a low level which we attribute to beam depolarization. We find a rotation measure towards most of the SNR of –930 rad m-2, but a distinctly different RM of –570 rad m-2 towards one component. This difference is best explained in terms of ISM differences rather than by conditions within the SNR itself. H i absorption puts lower and upper limits on the SNR’s systemic velocity of –50 and +40 km s-1 respectively, putting it at a distance between 5.41.6 and 14.10.7 kpc and implying an age in the range yr. The nearby H ii region G309.548–00.737 shows absorption out to the tangent point, consistent with its recombination line velocity and putting it at a distance 5.41.6 kpc.
SNR G309.2–00.6 appears to be a typical shell SNR but with two brightened and distorted ‘ears’ at opposed position angles, which have a similar spectral index to the rest of the shell. No emission corresponding to the remnant is apparent in the infrared or in H, while diffuse emission can be seen in X-rays. The compact X-ray source 1WGA J1346.5–6255 within the SNR is probably associated with the foreground open cluster NGC 5281.
We consider various explanations for the morphology of SNR G309.2–00.6, and argue that the remnant’s appearance is best explained by the presence of opposed jets from a central source which collide with and distort the surrounding shell. We propose G309.2–00.6 as a possible younger analogue to the X-ray binary SS 433 and its associated SNR W 50. A faint jet-like structure oriented along the symmetry axis of G309.2–00.6 may correspond to the outflow itself, while breaks in the ears along this axis may represent this outflow travelling beyond the shell. The weak source ATCA J134649–625235 in the SNR’s interior is unlikely to be associated with the remnant. We do not detect any other central source in either X-rays or in radio. The former can be attributed to a lack of sensitivity in the observations and to absorption along the line of sight, while the latter may indicate a binary system in a quiescent state or a pulsar with radio beams directed away from us.
To the SNR’s north is an unusual column of radio emission, which at one end may connect with the proposed outflow from the SNR’s centre and, at the other end, with the H ii region RCW 80. Such an association puts the SNR at a distance 5.41.6 kpc and corresponds to an age of less than 4000 yr. The details of the physical process behind such an interaction are unclear, but we note that a similar combination of outflow, distortion and termination in a thermal region has been claimed for both G332.4+00.1 (Kes 32) and G320.4–01.2 (MSH 15–52).
Further observations of SNR G309.2–00.6 will be required to determine whether our interpretation for its appearance is valid. Higher frequency radio observations can be used to provide higher resolution images of the ‘ear’ and ‘jet’ regions and the interaction between them, to better study the polarimetric properties of the SNR and, together with lower frequency data, to better constrain any spectral index differences between the different components of the remnant. If G309.2–00.6 is similar to W 50, X-ray observations of greater sensitivity and at higher energies should be able to detect both a central source and evidence for outflow from it.
Apart from G309.2–00.6, we find at least eight other SNRs in which the shell may be affected in some way by jets or outflows from an associated compact source, and suggest G290.1–01.8 (MSH 11–61A) as a possible further example. While the characteristic morphology associated with such outflow may become another means of determining which supernovae have massive star progenitors, there is good reason to believe that a significant fraction of SNRs harbour compact remnants which, for various reasons, we still have not detected.
Acknowledgments
We are particularly grateful to Andrew Walker for carrying out the optical observations and reduction. We also thank Karen Brazier, Jim Caswell, Mike Kesteven, Neil Killeen, Vince McIntyre and Jessica Try for useful discussions, Simon Johnston for reading the manuscript, Veta Avedisova for supplying us with information from her catalogue of star formation regions, and the referee, Tom Landecker, for helpful comments which improved the paper. BMG acknowledges the support of an Australian Postgraduate Award. The Australia Telescope is funded by the Commonwealth of Australia for operation as a National Facility managed by CSIRO. This research has made use of the NASA Astrophysics Data System, the CDS SIMBAD database, the IPAC HIRES facility and the HEASARC Online Service, provided by the NASA/Goddard Space Flight Center.
References
- [Anderson & Rudnick 1993] Anderson M. C., Rudnick L., 1993, ApJ, 408, 514
- [Aumann, Fowler & Melnyk 1990] Aumann H. H., Fowler J. W., Melnyk M., 1990, AJ, 99, 1674
- [Avedisova & Palous̆ 1989] Avedisova V. S., Palous̆ J., 1989, Bull. Astron. Inst. Czechosl., 40, 42
- [Avedisova 1997] Avedisova V. S., 1997, Baltic Astronomy, 6, 307
- [Baring & Harding 1998] Baring M. G., Harding A. K., 1998, in Dermer C. D., Strickman M. S., Kurfess J. D., eds, Proceedings of the Fourth Compton Symposium (Williamsburg). AIP, New York, in press (astro-ph/9711211)
- [Bell 1997] Bell J. F., 1997, Vistas Astron., 41, 87
- [Bhattacharya 1990] Bhattacharya D., 1990, JA&A, 11, 125
- [Blondin, Lundqvist & Chevalier 1996] Blondin J. M., Lundqvist P., Chevalier R. A., 1996, ApJ, 472, 257
- [Braun & Strom 1986] Braun R., Strom R. G., 1986, AA, 164, 193
- [Brazier & Becker 1997] Brazier K. T. S., Becker W., 1997, MNRAS, 284, 335
- [Brazier & Johnston 1998] Brazier K. T. S., Johnston S., 1998, MNRAS, submitted, astro-ph/9803176
- [Brown & Bethe 1994] Brown G. E., Bethe H. A., 1994, ApJ, 423, 659
- [Buxton, Bessell & Watson 1998] Buxton M., Bessell M., Watson B., 1998, Publ. Astron. Soc. Aust., 15, 24
- [Caswell & Haynes 1987] Caswell J. L., Haynes R. F., 1987, AA, 171, 261
- [Caswell, Milne & Wellington 1981] Caswell J. L., Milne D. K., Wellington K. J., 1981, MNRAS, 195, 89
- [Caswell et al. 1975] Caswell J. L., Murray J. D., Roger R. S., Cole D. J., Cooke D. J., 1975, AA, 45, 239
- [Chen & Ruderman 1993] Chen K., Ruderman M., 1993, ApJ, 402, 264
- [Clark, Caswell & Green 1975a] Clark D. H., Caswell J. L., Green A. J., 1975a, Aust. J. Phys. Astr. Supp., 37, 1
- [Clark, Parkinson & Caswell 1975b] Clark D. H., Parkinson J. H., Caswell J. L., 1975b, Nat, 254, 674
- [Day, Thomas & Goss 1969] Day G. A., Thomas B. M., Goss W. M., 1969, Aust. J. Phys. Astr. Supp., 11, 11
- [Dickel & Milne 1976] Dickel J. R., Milne D. K., 1976, Aust. J. Phys., 29, 435
- [Dubner et al. 1994] Dubner G. M., Giacani E. B., Goss W. M., Winkler P. F., 1994, AJ, 108, 207
- [Duncan et al. 1995] Duncan A. R., Stewart R. T., Haynes R. F., Jones K. L., 1995, MNRAS, 277, 36
- [Elston & Baum 1987] Elston R., Baum S., 1987, AJ, 94, 1633
- [Fender, Bell Burnell & Waltman 1997] Fender R. P., Bell Burnell S. J., Waltman E. B., 1997, Vistas Astron., 41, 3
- [Fich, Blitz & Stark 1989] Fich M., Blitz L., Stark A. A., 1989, ApJ, 342, 272
- [Frail 1998] Frail D. A., 1998, in Alpar A., Buccheri R., van Paradijs J., eds, NATO Advanced Study Institute: “The Many Faces of Neutron Stars”. Kluwer, Dordrecht, in press
- [Frail et al. 1996] Frail D. A., Giacani E. B., Goss W. M., Dubner G., 1996, ApJ, 464, L165
- [Frail et al. 1997] Frail D. A., Bietenholz M. F., Markwardt C. B., Ögelman H., 1997, ApJ, 475, 224
- [Frater, Brooks & Whiteoak 1992] Frater R. H., Brooks J. W., Whiteoak J. B., 1992, J. Electr. Electron. Eng. Aust., 12, 103
- [Gaensler & Johnston 1995] Gaensler B. M., Johnston S., 1995, MNRAS, 275, L73
- [Gaensler 1998] Gaensler B. M., 1998, ApJ, 493, 781
- [Gaensler, Manchester & Green 1998a] Gaensler B. M., Manchester R. N., Green A. J., 1998a, MNRAS, in press (Paper I; astro-ph/9711331)
- [Gaensler et al. 1998b] Gaensler B. M., Brazier K. T. S., Manchester R. N., Johnston S., Green A. J., 1998b, MNRAS, submitted
- [Georgelin & Georgelin 1970] Georgelin Y. P., Georgelin Y. M., 1970, AA, 6, 349
- [Georgelin & Georgelin 1976] Georgelin Y. M., Georgelin Y. P., 1976, AA, 49, 57
- [Georgelin et al. 1988] Georgelin Y. M., Boulesteix J., Georgelin Y. P., Le Coarer E., Marcelin M., 1988, AA, 205, 95
- [Gotthelf, Petre & Hwang 1997] Gotthelf E. V., Petre R., Hwang U., 1997, ApJ, 487, L175
- [Green 1974] Green A. J., 1974, A&AS, 18, 267
- [Green 1996] Green D. A., 1996, A Catalogue of Galactic Supernova Remnants (1996 August Version). Mullard Radio Astronomy Observatory, Cambridge, (http://www.mrao.cam.ac.uk/surveys/snrs/)
- [Green, Cram & Large 1998] Green A. J., Cram L. E., Large M. I., 1998, ApJ, submitted
- [Gregory & Fahlman 1983] Gregory P. C., Fahlman G. G., 1983, in Danziger J., Gorenstein P., eds, Supernova Remnants and their X-ray emission IAU Symposium No. 101. Reidel, Dordrecht, p. 429
- [Harrus, Hughes & Helfand 1996] Harrus I. M., Hughes J. P., Helfand D. J., 1996, ApJ, 464, L161
- [Haynes, Caswell & Simons 1979] Haynes R. F., Caswell J. L., Simons L. W. J., 1979, Aust. J. Phys. Astr. Supp., 48, 1
- [Helfand & Becker 1987] Helfand D. J., Becker R. H., 1987, ApJ, 314, 203
- [Hester et al. 1995] Hester J. J. et al., 1995, ApJ, 448, 240
- [Hirshfeld & Sinnott 1985] Hirshfeld A., Sinnott R. W., 1985, Sky Catalogue 2000.0, Volume 2. Cambridge University Press, Cambridge
- [Hjellming & Johnston 1981] Hjellming R. M., Johnston K. J., 1981, Nat, 290, 100
- [Hjellming & Johnston 1988] Hjellming R. M., Johnston K. J., 1988, ApJ, 328, 600
- [Hjellming 1997] Hjellming R. M., 1997, in Wickramasinghe D. T., Ferrario L., Bicknell G. V., eds, Accretion Phenomena and Related Outflows, IAU Colloquium 163. Astronomical Society of the Pacific, San Francisco, p. 53
- [Humphreys, Strecker & Ney 1971] Humphreys R. M., Strecker D. W., Ney E. P., 1971, ApJ, 167, L35
- [Hwang & Markert 1994] Hwang U., Markert T. H., 1994, ApJ, 431, 819
- [Insertis & Rees 1991] Insertis F. M., Rees M. J., 1991, MNRAS, 252, 82
- [Jackson 1976] Jackson P. D., 1976, A&AS, 25, 433
- [Kaspi 1996] Kaspi V. M., 1996, in Johnston S., Walker M. A., Bailes M., eds, Pulsars: Problems and Progress, IAU Colloquium 160. Astronomical Society of the Pacific, San Francisco, p. 375
- [Kaspi et al. 1992] Kaspi V. M., Manchester R. N., Johnston S., Lyne A. G., D’Amico N., 1992, ApJ, 399, L155
- [Kaspi et al. 1997] Kaspi V. M., Bailes M., Manchester R. N., Stappers B. W., Sandhu J. S., Navarro J., D’Amico N., 1997, ApJ, 485, 820
- [Kerr & Lynden-Bell 1986] Kerr F. J., Lynden-Bell D., 1986, MNRAS, 221, 1023
- [Kerr et al. 1986] Kerr F. J., Bowers P. F., Jackson P. D., Kerr M., 1986, A&AS, 66, 373
- [Kesteven & Caswell 1987] Kesteven M. J., Caswell J. L., 1987, AA, 183, 118
- [Kesteven et al. 1987] Kesteven M. J., Caswell J. L., Roger R. S., Milne D. K., Haynes R. F., Wellington K. J., 1987, Aust. J. Phys., 40, 855
- [Landecker, Roger & Dewdney 1982] Landecker T. L., Roger R. S., Dewdney P. E., 1982, AJ, 87, 1379
- [Manchester & Taylor 1977] Manchester R. N., Taylor J. H., 1977, Pulsars. Freeman, San Francisco
- [Manchester 1987] Manchester R. N., 1987, AA, 171, 205
- [Manchester, Staveley-Smith & Kesteven 1993] Manchester R. N., Staveley-Smith L., Kesteven M. J., 1993, ApJ, 411, 756
- [McCray 1993] McCray R., 1993, ARA&A, 31, 175
- [Milne et al. 1989] Milne D. J., Caswell J. L., Kesteven M. J., Haynes R. F., Roger R. S., 1989, in Kundt W., ed, Supernova Shells and their Birth Events, Lecture Notes in Physics 316. Springer-Verlag, Berlin, p. 98
- [Mirabel & Rodriguez 1994] Mirabel I. F., Rodriguez L. F., 1994, Nat, 371, 46
- [Moffat & Vogt 1973] Moffat A. F. J., Vogt N., 1973, A&AS, 10, 135
- [Murata & Shibazaki 1996] Murata K., Shibazaki N., 1996, Proc. Astr. Soc. Jap., 48, 819
- [Nicholls & Le Strange 1995] Nicholls J., Le Strange E. T., 1995, ApJ, 443, 638
- [Pineault, Landecker & Routledge 1987] Pineault S., Landecker T. L., Routledge D., 1987, ApJ, 315, 580
- [Reynolds 1996] Reynolds S. P., 1996, ApJ, 459, L13
- [Rho & Petre 1997] Rho J., Petre R., 1997, ApJ, 484, 828
- [Rho 1995] Rho J., 1995, PhD thesis, University of Maryland
- [Rodgers, Campbell & Whiteoak 1960] Rodgers A. W., Campbell C. T., Whiteoak J. B., 1960, MNRAS, 121, 103
- [Roger et al. 1985] Roger R. S., Milne D. K., Kesteven M. J., Haynes R. F., Wellington K. J., 1985, Nat, 316, 44
- [Roger et al. 1988] Roger R. S., Milne D. K., Kesteven M. J., Wellington K. J., Haynes R. F., 1988, ApJ, 332, 940
- [Rosado et al. 1996] Rosado M., Ambrocio-Cruz P., Le Coarer E., Marcelin M., 1996, AA, 315, 243
- [Różyczka & Tenorio-Tagle 1995] Różyczka M., Tenorio-Tagle G., 1995, MNRAS, 274, 1157
- [Różyczka et al. 1993] Różyczka M., Tenorio-Tagle G., Franco J., Bodenheimer P., 1993, MNRAS, 261, 674
- [Seward & Harnden 1994] Seward F. D., Harnden F. R. J., 1994, ApJ, 421, 581
- [Seward 1990] Seward F. D., 1990, ApJS, 73, 781
- [Seward et al. 1980] Seward F., Grindlay J., Seaquist E., Gilmore W., 1980, Nat, 287, 806
- [Shull, Fesen & Saken 1989] Shull J. M., Fesen R. A., Saken J. M., 1989, ApJ, 346, 860
- [Stewart et al. 1993] Stewart R. T., Caswell J. L., Haynes R. F., Nelson G. J., 1993, MNRAS, 261, 593
- [Sulkanen & Lovelace 1990] Sulkanen M. E., Lovelace R. V. E., 1990, ApJ, 350, 732
- [Tamura et al. 1996] Tamura K., Kawai N., Yoshida A., Brinkmann W., 1996, Proc. Astr. Soc. Jap., 48, L33
- [Taylor & Cordes 1993] Taylor J. H., Cordes J. M., 1993, ApJ, 411, 674
- [Taylor & Stinebring 1986] Taylor J. H., Stinebring D. R., 1986, ARA&A, 24, 285
- [van den Bergh & Tammann 1991] van den Bergh S., Tammann G. A., 1991, ARA&A, 29, 363
- [Vermeulen et al. 1993] Vermeulen R. C., Schilizzi R. T., Spencer R. E., Romney J. D., Fejes I., 1993, AA, 270, 177
- [Watson et al. 1983] Watson M. G., Willingale R., Grindlay J. E., Seward F. D., 1983, ApJ, 273, 688
- [White, Giommi & Angelini 1994a] White N. E., Giommi P., Angelini L., 1994a. IAU Circ. No. 6100
- [White, Giommi & Angelini 1994b] White N. E., Giommi P., Angelini L., 1994b, BAAS, 185, 4111
- [Whiteoak & Green 1996] Whiteoak J. B. Z., Green A. J., 1996, A&AS, 118, 329
- [Willingale et al. 1996] Willingale R., West R. G., Pye J. P., Stewart G. C., 1996, MNRAS, 278, 749
- [Wolszczan et al. 1988] Wolszczan A., Cordes J. M., Dewey R. J., Blaskiewicz M., 1988. IAU Circ. No. 4694
- [Yamauchi, Kawai & Aoki 1994] Yamauchi S., Kawai N., Aoki T., 1994, Proc. Astr. Soc. Jap., 46, L109