Astronomical detection of the cyanobutadiynyl radical C5N
Abstract
We report the detection of the elusive carbon-chain radical C5N in the dark cloud TMC1 and its tentative detection in the circumstellar envelope IRC+10216. C5N appears to be two orders of magnitude less abundant than the related molecule HC5N and much less abundant than expected from current gas phase chemistry models. In comparison the HC3N to C3N abundance ratio is of the order of 10, in reasonable agreement with model predictions.
We have also detected in IRC+10216 two lines arising from the C3H radical in its excited state.
Key Words.:
Molecular data – circumstellar matter – ISM: molecules – Radio lines: stars1 Introduction
That long carbon chain radicals could be abundant and play a large role in interstellar chemistry was first recognized with the discoveries of C3N in the circumstellar envelope IRC+10216 (Guélin & Thaddeus 1977) and in the dark cloud TMC1 (Friberg et al. 1980). To date seven acetylenic chain radicals, CnH, , and five cyanopolyyne molecules, HC2nCN, , are identified in TMC1 and/or IRC+10216 (Bell et al. 1997, Guélin et al. 1997). Surprisingly, no cyanopolyyne radicals heavier than C3N were so far detected, despite model predictions that at least C5N should be abundant (Herbst et al. 1994).
The non-detection of C5N was first blamed on a small dipole moment and on the lack of spectroscopic data. The dipole moment and the rotation constant of the C-chains radicals depend critically on the nature of their electronic ground state. The two lowest states, and , are close in energy (Pauzat et al. 1991). Pauzat and co-workers predicted from unrestricted Hartree-Fock calculations that the state of C5N lay below the state and that was very small. The line strengths scaling with , it was no wonder that C5N escaped detection.
Things changed when Botschwina (1996) showed from more elaborate coupled cluster calculations that the C5N ground state was in fact and that was as large as 3.385 D, even larger than the dipole moment of C3N. It then became clear that C5N could be detected at least in the laboratory. Kasai et al. (1997) succeeded to synthetize this species, to measure its microwave spectrum, and to derive its rotational, fine and hyperfine constants, making at last possible a sensitive search for C5N in space. In this Letter, we report the astronomical detection of this radical.
2 Observations and results
The long carbon-chain molecules and radicals are nearly thermalized in TMC1 and IRC+10216 with rotation temperatures, , in the ranges 6–10 K and 20–50 K, respectively. Since, for C5N, K, the strongest lines in these two sources lie in the 1 cm and mm atmospherical windows. We thus searched for C5N at these wavelengths, using the Effelsberg 100-m telescope and the Pico Veleta 30-m telescope.
The Effelsberg observations were made in October 1997, January and March 1998. The telescope was equipped with the K-band maser receiver. The weather was mostly clear and the system temperature K. We used the new AK90 autocorrelator split into two 20 Mhz-wide bands of 4048 channels each. One of the bands covered both fine structure components of the transition of C5N (25.250 GHz, Kasai et al. 1997), the other the transition of C8H (25.227 GHz). The local oscillator frequency was switched by kHz or kHz and the spectra folded accordingly. The average spectrum obtained in TMC1 at the position of the cyanopolyyne peak (1950.0: ), smoothed to 15 kHz (0.17 kms-1), has a r.m.s. noise of 3.5 mK (units of ).
In addition to C5N and C8H, we observed briefly the line of HC5N (23.96 GHz) and the lines of C3N (19.79 GHz). All the data were calibrated following the procedure described by Schilke & Walmsley (1991) by observing at every frequency the planetary nebula NGC 7027, whose flux was taken equal to 5.8 Jy. The calibration uncertainty, which results mostly from the atmospheric absorption correction and from beam efficiency variations, is estimated to be . The HC5N and C3N line intensities we measure are consistent with those reported by Tölle et al. (1981) and Guélin et al. (1982).
Figure 1 (see also Table 1) shows the spectrum covering the C5N transitions. We see two 0.3 kms-1-wide spectral lines, each detected at . The lines are separated by MHz, which is very close to the value of the spin-rotation constant measured by Kasai et al. (1997), MHz. Their half-power width is comparable to the C3N linewidth, kms-1. Their rest frequencies coincide within the small uncertainties with the C5N N=9–8 transition frequencies calculated by Kasai et al. (1997), if we adopt the source LSR velocity of kms-1 measured for C3N and C4H (see Guélin et al. 1982). Since there are no other comparable lines in the 20 MHz-wide spectrum we observed, the probability for a chance coincidence is . We thus conclude that we have detected C5N in TMC1.

The 30-m observations were made in Nov. 1997 and April 98. The telescope was equipped with two SIS mixer receivers with orthogonal polarizations. The zenith atmospheric opacity was below 0.1 and the system temperature K. The observations were made by wobbling in azimuth the secondary mirror at a rate of 0.5 Hz and with an amplitude of 90′′. We searched for the N=32–31 line, the next two lower lines being partly blended with lines of unrelated species. The average spectrum obtained toward IRC+10216 is plotted in Figure 2a. It has an r.m.s. noise per 1 MHz channel of 0.90 mK in the scale.
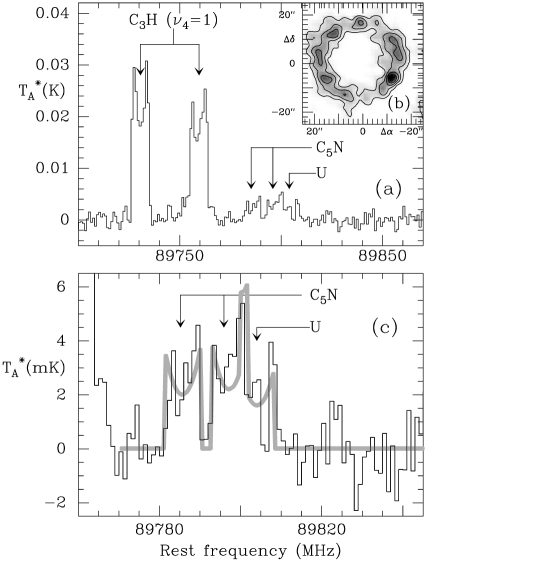
The carbon-chain molecules observed in IRC+10216 are concentrated in a thin shell of radius (see Fig.2b). Observed with the 30-m telescope, the profiles of their 3 mm lines have the same cusped shape and the same width (29.5 kms-1). They are all centred at = -26.5 kms-1. The spectrum of Fig. 2a shows two cusped lines, near 89.75 GHz and three weaker features near 89.80 GHz. The former can be readily assigned to the and fine structure components of C3H in its first excited bending state, (Yamamoto et al. 1990) since they have the right frequencies and the right intensity ratio (, whereas the expected LTE ratio is 1.30).
We have fitted 3 cusped lines (assuming standard line shapes and 29.5 kms-1 widths) to the 3 weak spectral features of Fig. 2a. The derived intensities and rest frequencies are given in Table 1; the fitted spectrum is compared in Fig. 2c to the observed spectrum. The first two lines agree in frequency with the and transitions of C5N and very probably arise from this radical. Indeed, although the 3 mm spectrum of IRC+10216 is more crowded than the 1 cm spectrum of TMC1, there are not many lines that we cannot assign to the rotational transition of a known circumstellar molecule: in our 30-m telescope spectral survey of IRC+10216, the density of unidentifed lines stronger than mK is only of 1 per 80 MHz (see Guélin et al. 1997). The probability that two unrelated lines lie within 1 MHz from the C5N lines is thus lower than 1 per one thousand. Whereas the first two features can be tentatively assigned to C5N, the third, which is weaker and lies 7 MHz higher in frequency, remains unidentified.
Table 1: Observed line parameters
Rest. frequ.
Obs.-Calc.
Transition
Species
(MHz)
(MHz)
(mK.kms-1)
TMC1
19799.956
.005
2,1.5,1.5-1,0.5,0.5
C3N
23 (8)
19800.121
.000
2,1.5,2.5-1.0.5,1.5
C3N
58 (8)
19780.801
.001
2,2.5,2.5-1,1.5,1.5
C3N
60 (8)
19780.826
.000
2,2.5,1.5-1,1.5,0.5
C3N
34.5 (8)
19781.096
.002
2,2.5,5.5-1,1.5,1.5
C3N
86 (8)
23963.897
0.000
9-8
HC5N
2240 (100)
25249.938 (4)
.018 (40)
9,9.5-8,8.5
C5N
7.3 (9)
25260.649 (4)
-.017 (40)
9,8.5-8,7.5
C5N
6.4 (9)
IRC+10216
89730.54(10)
-.07 (10)b
4,4.5 - 3,3.5
C3H()
880(20)
89759.17(12)
-.18 (12)b
4,3.5 - 3,2.5
C3H()
660(20)
89785.6 (4)
.4 (13)
32,32.5-31,31.5
C5N
95 (15)
89797.0 (3)
1.1(13)
32,31.5-31,30.5
C5N
105(20)
89804.0 (10)
–
–
U
75 (20)
Notes to the Table:
b: weighted average of the two blended
hyperfine components.
The calculated frequencies are taken from Kasai et
al. (1997) for C5N, Yamamoto et al. (1990) for C3H, and Guélin et
al. (1982) for C3N (see also Gottlieb et al. 1983). The observed rest
frequencies of C3N and C5N were derived
assuming VLSR= 5.65 kms-1 in TMC 1 and -26.5 kms-1 in
IRC+10216; that of HC5N was derived assuming VLSR= 5.75 kms-1
(see Guélin et al. 1982). The number
in parenthesis represent the r.m.s. uncertainty on the last digit. The
uncertainties on the line integrated intensities, given in the Table,
do not include the calibration uncertainty which is . Note that
the intensity ratio between the rotational transitions in the C3H
ground state and in the excited bending state, hence
presumably the population ratio between these two states, is .
3 The abundance of C5N
In the direction of the TMC 1 cyanopolyyne peak, the rotational populations of HC5N and HC3N can be described by Boltzmann distributions with rotation temperatures of K (see e.g. Takano et al. 1997). We adopt therefore Trot= 8 K. The H2 column density in this direction is N(H2)= cm-2 (Cernicharo & Guélin 1987). That of C5N can be calculated from the standard expression for the optically thin lines of thermalized linear molecules:
where
and where Kkms-1 is the sum of the integrated intensities of the two doublet components. In equation [1], is in cm-2, the dipole moment = 3.385 D (Botschwina 1996) in debye, and the line frequency GHz in gigahertz. We find:
.
The abundance of C5N can be compared to those of the related species HC5N and C3N in the light of the chemical model predictions. We calculate first the abundance of the 13C isotopomers of HC5N, whose 1 cm lines are optically thin, by setting in equation [1] D, GHz and Kkms-1, which is the average of the integrated intensities of the J=9–8 lines of HC13CC3N and HC13CN, observed with the Effelsberg telescope (Takano et al. 1998). We find N(HC13CN)= 1.0 cm-2, from which we derive N(HC5N)= 7 1013 cm-2, adopting the ‘standard’ elemental abundance ratio 12C/13C70 in the local interstellar medium (see Wilson & Rood 1994). The value of 7 1013cm-2 is close to the value of Suzuki et al. (1992), as well as to the value we estimate with an LVG code from the main isotopomer line intensity (5 1013cm-2). We arrive at:
N(HC13CN/C5N)= 3
N(HC5N/C5N).
For C3N, we find, using in eq. [1] K, D
(Pauzat et al. 1991), and the line parameters
of Table 1: N(C3N)= 8.2 1012
cm-2. Finally, we take for HC3N
the column densities derived by
Takano et al. (1998),
N(HC13CCN)=
2.1 1012 cm-2 and
N(H12C3N)= 1.6 1014 cm-2. This yields:
N(HC13CCN/C3N)= 0.26
N(H12C3N/C3N)= 19.
The C5N/HC5N abundance ratio is an order of magnitude smaller than the C3N/HC3N ratio. According to neutral-neutral gas phase chemical models, the cyanopolyyne mole-cules are mainly formed by reactions of N and CN with polyacetylenes or polyacetylic ions (Herbst & Leung 1990). The cyanopolyyne radicals are formed in TMC1 by the reaction of atomic C with cyanopolyynes (Herbst et al. 1994), and in IRC+10216 by photodissociation (Cherchneff & Glassgold 1993). They are destroyed by reactions with N atoms, O atoms, polyacetylenes and photodissociation.
According to model predictions, HC3N/HC5N varies in TMC1 by several orders of magnitude between the “early times” and steady state. The C3N/HC3N and C5N/HC5N ratios, on the other hand, remain constant within a factor of 2. They are comprised between 0.1 and 0.2 (see Table 3 of Herbst et al. 1994). Whereas the observed C3N/HC3N ratio (0.2, Cernicharo et al. 1987) agrees with the predicted one, C5N/HC5N is more than one order of magnitude too low. The most recent models, which take into account the destruction of acetylene and polyacetylenes by C atoms and the reaction of CN with O, form enough C5N but too little C3N, HC3N and HC5N (Herbst et al. 1994).
In the case of IRC+10216, we adopt for C5N the same rotation temperature as for HC5N (= 29 K, Kawaguchi et al. 1996). We then derive from the integrated intensities of Table 1 a line-of-sight column density in the direction of the central star (twice the radial column density across the shell) N(C5N) cm-2. This is times less than the column densities of C3N and HC5N. Here also, C5N is underabundant with respect to model predictions (Cherchneff & Glassgold 1993), and C5N/HC5N one order of magnitude smaller than C3N/HC3N.
The unexpectedly low C5N/HC5N abundance ratio in found both sources shows that the formation of long carbon-chain molecules is not fully understood, and that is difficult to predict the abundances of unobserved species. The very long carbon chains could be more abundant than expected. We note, however, that the species of medium size, such as the chains consisting of C,N, or O atoms and the rings with less than 10 heavy atoms, which would give rise in TMC 1 to a rich centimetric spectrum, are probably not very abundant in that source: we have covered so far a 100 MHz-wide band in TMC 1 with a very good sensitivity and did not detect any unidentified line down to a level of 10 mK. The acetylenic chains and cumulene carbenes appear in this respect exceptional.
Acknowledgements.
We thank W. and H. Wiedenhöver of the MPIfR who built the new autocorrelator and made it available to us, W. Zinz who helped us to configurate it for our observing runs, Dr. P. Schilke for advice on data calibration, and the referee for helpful comments.4 References
Bell M.B. et al. 1997, ApJ. 483, L61
Botschwina, P. 1996, Chem. Phys. Lett. 259, 627
Cernicharo, J., Guélin, M. 1987, A&A 176, 299
Cernicharo, J. Guélin, M., Menten, K.M., Walmsley, C.M. 1987, A&A 181, L1
Cherchneff, I., Glassgold, A.E. 1993, ApJ 419, L41
Friberg, P., Hjalmarson, A., Irvine, W.M., Guélin, M. 1980, ApJ 241, L99
Gottlieb, C.A., Gottlieb, E.W., Thaddeus, P., Kawamura, H. 1983,
ApJ. 275, 916
Guélin, M., Thaddeus, P. 1977, ApJ 212, L81
Guélin, M., Friberg, P., Mezaoui A. 1982, A&A 109, 23
Guélin, M., Lucas, R., Cernicharo, J. 1993, A&A 280, L19
Guélin et al. 1997, A&A 317, L1
Herbst, E., Leung, C.M. 1990, A&A 233, 177
Herbst, E., Ho-Hsin Lee, Howe, D.A., Millar, T.J. 1994, MNRAS 268, 335
Kasai, Y., Sumiyoshi, Y., Endo, Y., Kawaguchi, K. 1997, ApJ, 477, L65
Kawaguchi, K,, Kasai, Y., Ishikawa, S., Kaifu, N. 1995, PASJ 47, 853
Pauzat, F. , Ellinger, Y., McLean, A.D. 1991, ApJ 369, L13
Schilke, P., Walmsley, C.M. 1991, MPIfR Technischer Bericht Nr. 70,
July 1991
Suzuki, H. et al. 1992, ApJ 392, 551
Takano, S. et al. 1998, A&A in press
Tölle et al. 1981, A&A 95, 143
Wilson, T.L., Rood, R.T. 1994, ARA&A 32, 191
Yamamoto, S., Saito, S., Ohishi, M. 1990, ApJ 348, 363.