A Group–Group Merger at a Redshift of ?
Abstract
We present a dynamical study of the CL0023+0423 system at a redshift of . This system consists of two components separated in velocity space by and on the plane of the sky by . A kinematic analysis indicates that the two components are a poor cluster with a velocity dispersion of and a mass of and a less massive group with a velocity dispersion of and a mass of (Postman, Lubin & Oke 1998). The dynamics of galaxy groups at high redshift can provide important insights into the creation of present-day galaxy clusters. Therefore, we have performed a dynamical study on this system in order to determine whether the two groups are infalling. This analysis includes an analytic two-body calculation and N-body simulations. The results of both studies indicate that the system is most likely not bound but simply a chance projection on the sky; however, within the observational uncertainties, there do exist bound solutions where the two galaxy groups are currently moving toward each other and will eventually merge into a larger system of galaxies. We have run one-thousand N-body simulations with random initial conditions based on the observed parameters of the CL0023+0423 groups. A statistical analysis of these simulations indicates that there is an 20% chance that the two groups will merge. If the CL0023+0423 system does merge, it will appear as a cluster on the sky, as well as in velocity space, within Gyrs. The cluster will evolve dynamically for more than 3 Gyrs, appearing during this time more similar to an open, irregular cluster. The final merged system has a velocity dispersion which is consistent with a local Abell richness class 1 cluster.
The morphological analysis of the galaxy populations of CL0023+0423 suggests that both groups are largely dominated by spiral galaxies. Early-type fractions are 33% or less (Lubin et al. 1998). These modest early-type fractions have implications for both cluster formation and group evolution. Studies of open clusters at indicate that that they have early-type fractions between (Dressler et al. 1997; Andreon, Davoust & Helm 1997; Stanford, Eisenhardt & Dickinson 1997; Couch et al. 1998). If the CL0023+0423 system is the predecessor of such a cluster, the comparison may suggest that some fraction of early-type galaxies are formed between redshifts of and ; however, the morphological fractions are still highly uncertain. In addition, the modest early-type fractions in both groups may be inconsistent with the strong correlation between velocity dispersion and early-type fraction observed in nearby groups of galaxies (Zabludoff & Mulchaey 1998). Both groups apparently have relatively low early-type populations, irrespective of their velocity dispersion. If the groups of CL0023+0423 are typical of galaxy groups at high redshift, and if high-redshift groups are the progenitors of local groups, this result may also imply that some early-type formation is occurring at redshifts of . These results do not preclude the formation of early-type galaxies at very high redshift as many observations suggest (e.g. Steidel et al. 1996; Ellis et al. 1997; Stanford, Eisenhardt & Dickinson 1997; Postman, Lubin & Oke 1998); however, the observations of the CL0023+0423 system may imply that a fraction of the early-type population is forming and/or undergoing significant evolution at redshifts of .
Accepted for publication in the Astronomical Journal
1 Introduction
In hierarchical clustering models, clusters of galaxies are formed by a progressive coalescence of an inhomogeneous system of subclusters (e.g. White 1976; Evrard 1990; Lacey & Cole 1993,1994). The early stages of these models provide a natural description of the formation of open, irregular clusters like Virgo or Hercules. These systems show no single, central condensation, though the galaxy surface density is at least five times as great as the surrounding field. They often have high degrees of asymmetry and significant amounts of subclustering. The progressive stages of evolution in cluster formation produces centrally-concentrated, compact clusters of galaxies. These clusters are dense, have a single, prominent concentration among the bright member galaxies, and typically display a high-degree of spherical symmetry (Abell 1958; Oemler 1975; Bahcall 1975; Dressler 1978; Dressler 1980a,b).
The remnants of hierarchical structure formation can be easily observed in the local universe. Substructure and more significant merger events are common characteristics of the optical and X-ray properties of nearby clusters of galaxies (e.g. Geller & Beers 1982; Dressler & Shectman 1988; West & Bothun 1990; Jones & Forman 1992; Mohr, Fabricant & Geller 1993; Zabludoff & Zaritsky 1995). These studies indicate that of all clusters have substantial substructure where the subclump contains a significant fraction of the cluster galaxies (Dressler & Shectman 1987; West & Bothun 1990; Jones & Forman 1990). Simulations have shown that, when a cluster accretes smaller groups of galaxies, the effect of such a merger, such as optical or X-ray morphologies, can last for Gyr (Evrard 1990). For a more significant merger of two equal-mass subclusters, it takes more than 4 Gyr after the first encounter until the collisionless dark matter (and galaxy) density contour shows a single peak. The exact time depends on the density and velocity distribution of the dark matter. A longer relaxation time is required when the dark matter is spatially extended and/or when the velocity distribution has a Gaussian shape (Nakamura, Hattori & Mineshige 1995). It is worthwhile to note that hydrodynamic simulations indicate that the collisional, X-ray emitting intracluster gas can relax on timescales much shorter than the dark matter (see e.g. Evrard 1990).
Spectral studies of rich clusters with significant substructure indicate that of the early-type cluster members have signs of current or on-going star formation (Caldwell & Rose 1997). These observations may imply that merger activity can alter the star formation histories of the early-type members. Starbursts may be the result of shocks which are induced in the collision between the intracluster medium of the cluster and that of the subcluster. Zabludoff & Mulchaey (1998) find that a similar fraction of the early-type galaxies in groups of galaxies in the field have experienced star formation within the last Gyr. Therefore, if some of the subclusters in these rich clusters are actually groups which have fallen into the cluster environment, the similarity between the star formation histories of the early-type galaxies in the subclusters and those in the galaxy groups indicate that the group environment may be the site of recent star formation. The modest intragroup medium and low velocity dispersions would argue that galaxy-galaxy collisions would be the dominant means to alter the star formation history of the early-type galaxies in these systems (Aarseth & Fall 1980; Barnes 1985; Merritt 1995; Zabludoff & Mulchaey 1998). The results suggest that both group and cluster environments should be examined as important sites for evolution in the star formation history of galaxies.
In order to understand the evolution of galaxies and their environments, it is essential to study groups and clusters of galaxies in their early stages of formation. Unfortunately, because of the substantial background contamination rates at high redshift, finding systems which are in the process of forming is very difficult. However, we have found such a system as part of a high-redshift cluster survey. At a redshift of , the CL0023+0423 system is part of an extensive photometric, spectroscopic, and morphological study of nine candidate clusters of galaxies at (Oke, Postman & Lubin 1998, hereafter Paper I). First detected as a likely cluster by Gunn, Hoessel & Oke (1986), more detailed spectroscopic data reveal that this system is actually made up of two substructures separated closely in velocity, as well as position on the sky. The radial velocity histograms of the individual structures more closely resemble local groups or poor clusters of galaxies (Postman, Lubin & Oke 1998, hereafter Paper II). In addition, the morphological analysis of the galaxy population in this system indicates that these groups do not have a morphological composition which is typical of a massive, relaxed cluster. Their galaxy population is almost totally dominated by spiral galaxies, with early-type fractions that are 33% or less (Lubin et al. 1998, hereafter Paper III). This study provides the first observational data on a possible group-group merger at high redshift.
Because of the intriguing nature of this system and its potential to reveal important information on the hierarchical formation of larger systems such as clusters of galaxies, we have decided to study in detail the dynamical state of this two group system. In this paper, we present the results of an analytic analysis of the system dynamics, as well as N-body simulations of the group-group system. We address the possibility that this system is bound and will eventually merge, or that the system is simply a chance projection of two groups on the sky. A brief description of the observations are given in Sect. 2. In Sects. 3 and 4, we describe the analytic dynamical analysis and the N-body simulations, respectively. A discussion of the results and their implications for the formation and evolution of groups and clusters of galaxies is presented in Sect. 5. In the following analyses, we have assumed and .
2 The Observations
As part of our observational program on high-redshift clusters of galaxies, the CL0023+0423 system has been observationally well studied. The details of the Keck optical observations, both broad band and spectroscopic, and the HST imagery are presented in Papers I, II and III. In this section, we discuss briefly only those observational parameters which are applicable to the following dynamical analyses.
2.1 Velocity Histograms and Group Masses
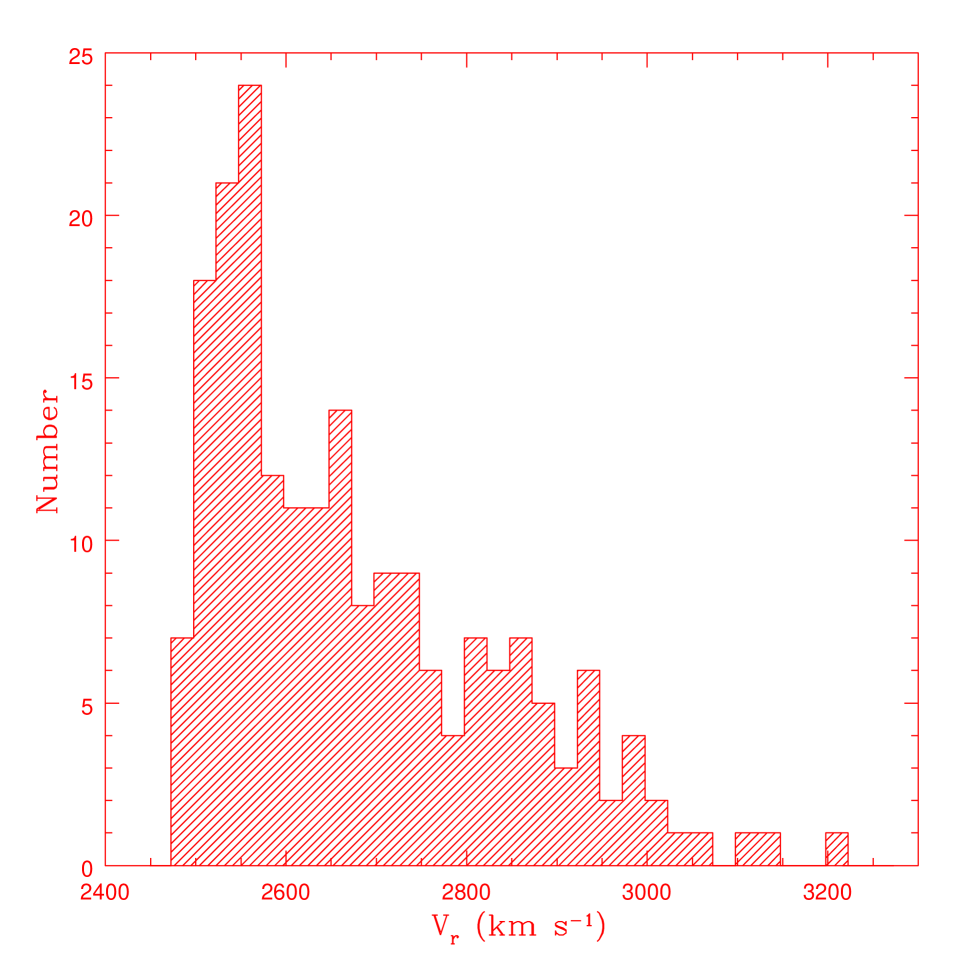
From the observations described above, we have analyzed the kinematic properties of the CL0023+0423 system. The procedure for computing the cosmologically and relativistically corrected velocity histograms are discussed in Sect. 3 of Paper II. The resulting velocity distribution for this system is shown in Figure 1. It is clear from this figure that there is a clear bimodal distribution in redshift space, corresponding to peaks at (7 galaxies) and (17 galaxies). This implies a cosmologically-corrected radial velocity difference of . Following the convention of Paper II, we refer to the low-velocity system as CL0023A and the high-velocity system as CL0023B. The velocity dispersions of the individual components are and for CL0023A and CL0023B, respectively. The uncertainty in the dispersion is computed following the prescription of Danese et al. (1980). The Danese et al. prescription assumes the errors in velocity dispersions can be modeled as a distribution and that the velocity deviation from the mean cluster redshift is independent of galaxy mass (that is, the cluster is virialized). For more details on the velocity dispersion measurements, see Paper II. We have also calculated the harmonic radius () for each system (Equation 2 of Paper II). These values are and for CL0023A and CL0023B, respectively. Following the formalism in Ramella, Geller & Huchra (1989), the radius and velocity dispersion of each system imply virial crossing times (in units of the Hubble time) of 0.02. Such short crossing times are consistent with other bound systems of galaxies, such as groups and rich clusters (Ramella, Geller & Huchra 1989).
We have used three separate estimators to determine the masses of virialized systems given a set of galaxy positions and redshifts. These estimators include the pairwise mass (), the projected mass (), and the ringwise mass estimators (). The exact formalisms are described in detail in Sect. 3.1 of Paper II. The differences in the mass estimates are due primarily (but not solely) to the difference in the radius estimators. The pairwise estimator gives a high weight to close pairs; the other two estimates are less sensitive to this and, therefore, give more similar values (see Paper II and references therein). For the following analyses, we have chosen the ringwise mass estimate as the actual mass of each structure (Carlberg et al. 1996). This corresponds to a total system mass of . The velocity dispersion, the harmonic radius, and all three masses of each system are listed in Table 1. All of these parameters are very similar to those of local galaxy groups and poor (Abell richness class 0) clusters (e.g. Huchra & Geller 1982; Ramella, Geller & Huchra 1989; Zabludoff & Mulchaey 1998 and references therein). The number of confirmed members, the physical properties, and the short crossing times of both CL0023A and CL0023B suggest that these systems are real, physically-bound groups of galaxies.
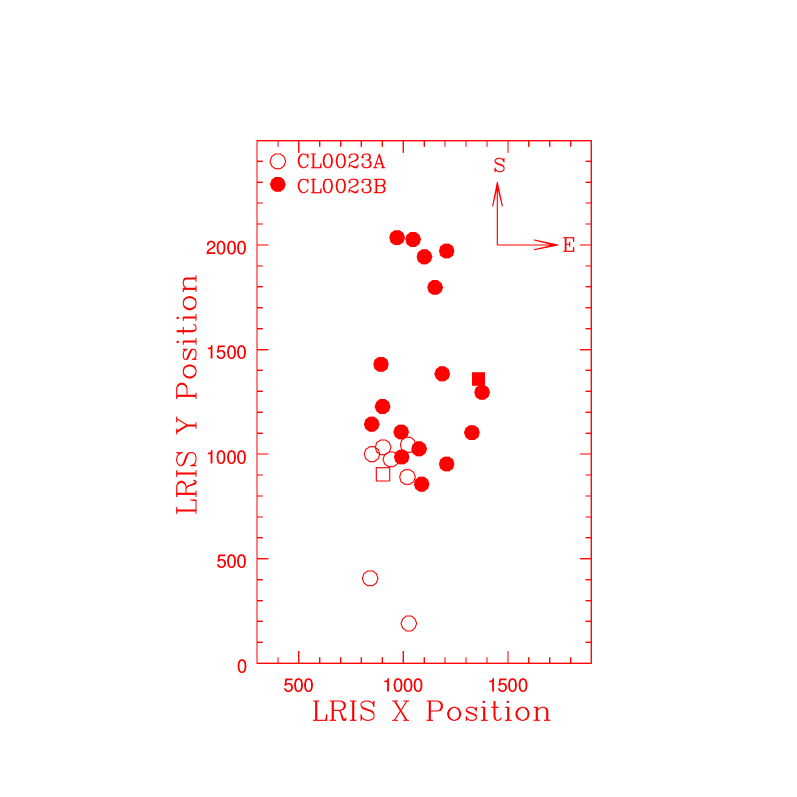
2.2 Group Separation
As further indication of the distinctiveness of each group, the two velocity peaks are also separated on the sky (see Figure 2). The groups do not have well-defined galaxy profiles. Such galaxy distributions are not uncommon for local groups of galaxies (see Figure 3 of Zabludoff & Mulchaey 1998). However, because we need an estimate of the projected separation between the two galaxy groups for the dynamical analysis presented in Sect. 3, we must calculate the centroid of CL0023A and CL0023B. It is obvious from Figure 2 that more confirmed group members are necessary to get an accurate measure of the group center (see Figure 4 of Paper II). Because of this uncertainty, we have estimated the projected separation in two ways. In both methods we have used only the positions of the confirmed members in each group. Firstly, we have calculated the separation between the median positions of each subsystem. The RA and Dec of the median positions of CL0023A and CL0023B are given in Table A Group–Group Merger at a Redshift of ?. This projected separation between these two positions is or a physical separation of . Secondly, we have computed the separation between the brightest group members. The brightest confirmed member in CL0023A is Keck #2055 with an absolute AB magnitude of mag; the brightest confirmed member in CL0023B is Keck #2348 with an absolute AB magnitude of mag (see Paper II). The RA and Dec of these two galaxies are listed in Table A Group–Group Merger at a Redshift of ?. The projected separation between their positions is or a physical separation of . Because of the reasonably large disparity between the two calculated separations, we perform an analytic analysis of the dynamics using each of the projected separations.
3 The Dynamics
3.1 The Analytic Analysis
We examine three possible solutions : (1) the system is bound but still expanding, (2) the system is collapsing, and (3) the two galaxy groups are not bound to each other but merely a chance projection on the sky. We assume that, if the system is bound, that we are seeing the system prior to complete merging and virialization.
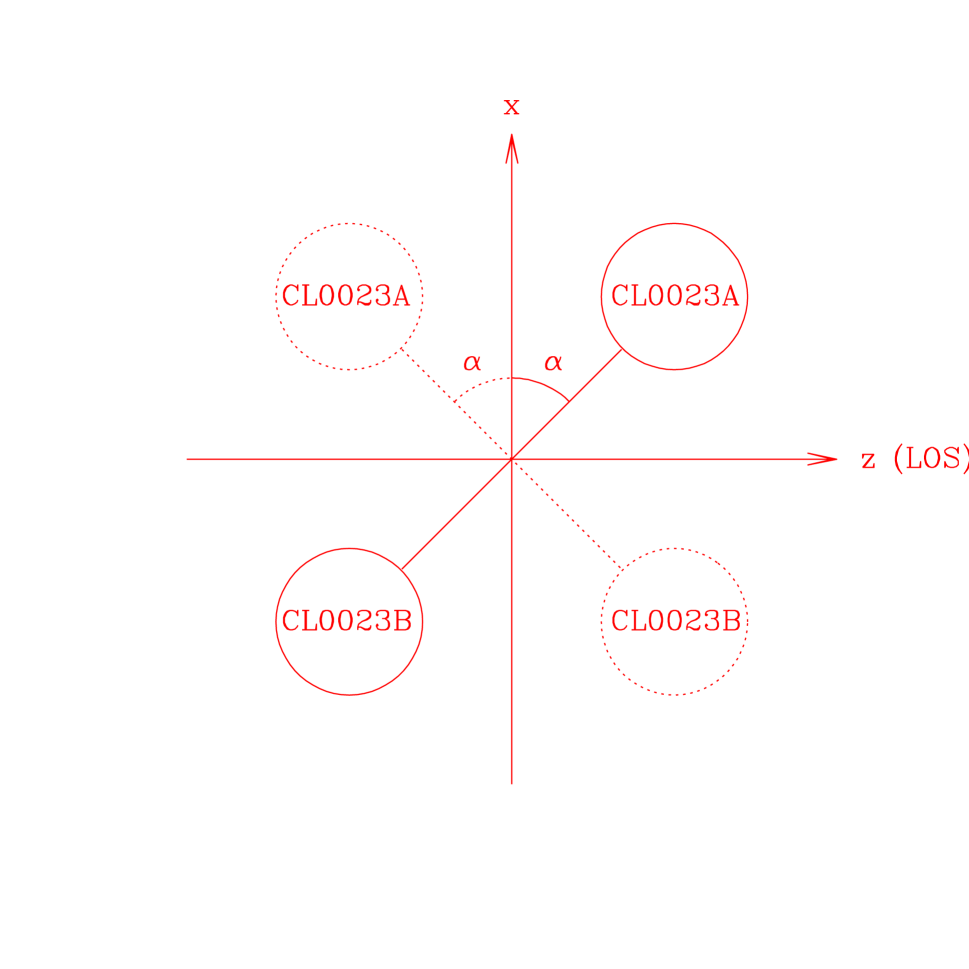
We have analyzed the CL0023+0423 system based on the analytic prescription used in Beers, Geller & Huchra (1982) for Abell 98. The system is considered a two-body problem with each galaxy group having a linear orbit and being a point source with all of the mass concentrated at the group center (see Sect. 2.2). The dynamical state of the system is studied by solving the equations of motion as a function of , the angle between the line connecting CL0023A and CL0023B (see Figure 3). We assume that at the two groups are at zero separation and that they are now coming together or moving apart for the first time. If the system is still expanding, the high-velocity component CL0023B must be more distant than the low-velocity component CL0023A because the individual clumps must have collapsed out of the Hubble flow. If the cluster has already reached maximum expansion and begun to collapse, CL0023B must be nearer than CL0023A.
For the bound case, the parametric solutions to the equations of motion are :
| (1) | |||||
| (2) | |||||
| (3) |
where is the separation of the two groups at maximum expansion, is the total mass of the system, and is the developmental angle.
For the unbound case, the parametric solutions to the equations of motion are :
| (4) | |||||
| (5) | |||||
| (6) |
where is the asymptotic expansion velocity. The observed parameters of radial velocity difference and the projected separation are related to these equations by
| (7) | |||||
| (8) |
where is the angle between the line connecting the two groups and the axis (see Figure 3).
As described in Sect. 2.2, we will explore two possible projected separations : case (1) , the separation between the median positions of each group; and case (2) , the separation between the two brightest galaxies in each group (see Table A Group–Group Merger at a Redshift of ?). We can solve these systems of equations by constraining the time to be , the age of the universe at the mean redshift of the two systems () for a and universe. In addition, the Newtonian criterion for gravitational binding places a limit on the bound solution from the observable parameters. That is,
| (9) |
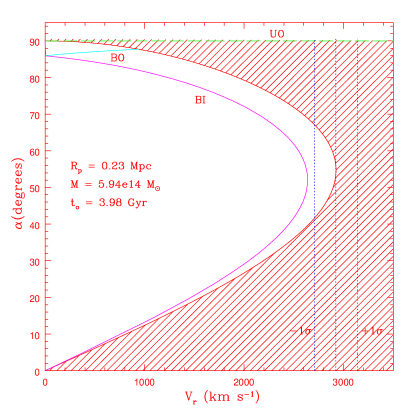
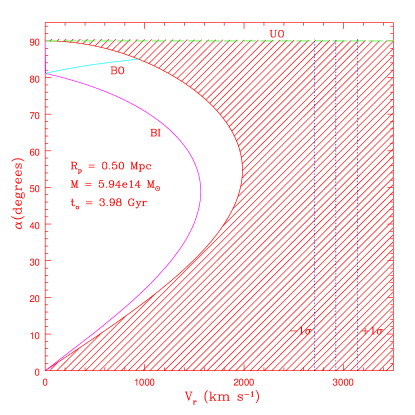
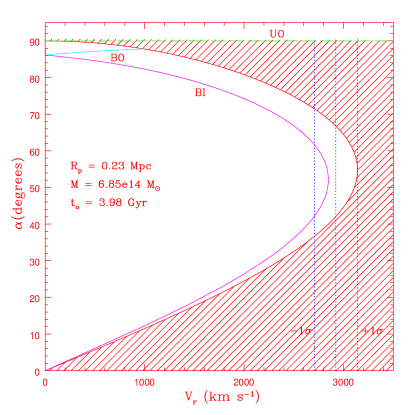
Using the above equations and constraints, we can solve the equations of motion iteratively to find the projection angle as a function of radial velocity difference . Therefore, we adopt the time condition of and the observed total mass of the system (see Table 1) to solve the equations of motion. The results are plotted in Figure 4 which shows the plane for each value of . The shaded region specifies where all unbound solutions would lie, while the unshaded region specifies where all bound solutions would lie. The solutions for our particular two-body problem are indicated by solid and dashed lines in this figure. The two solid lines indicate our bound solutions, bound-incoming (BI) and bound-outgoing (BO), while the dashed line indicates our unbound (UO) solution. It is obvious from this plot that there are no bound solutions for this system. For case (1) of , there is in principle an incoming-bound solution for the observed which does not violate energy conservation; however, there are no formal incoming or outgoing-bound solutions given the constraints of the equations of motion. For case (2) of , the observed lies far from the bound region of this plane, indicating that the two-body system in this configuration is definitely unbound.
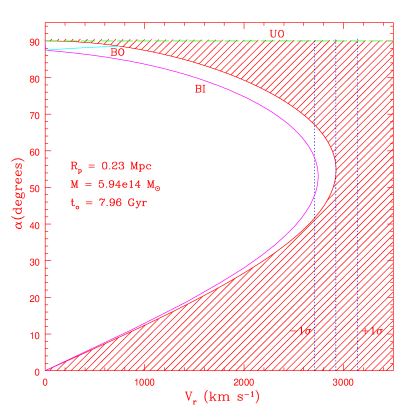
Because in case (1) the system is extremely close to having an incoming-bound solution, we have examined the effect of varying the two additional parameters, the total mass of the system and the present age of the system . Based on Equations 1–3, it is clear that only more mass or a longer lifetime will make this system bound. We examine both of these possibilities in Figure 5. In the left panel, we show the plane for a system which has more mass that the observed value, i.e. (see Sect. 2.1 and Table 1); the projected separation and the age remain the same at and , respectively. In the right panel, we show the plane for a system which is twice as old with ; the projected separation and the total mass remain the same at and , respectively. For each of these cases, there are now bound solutions within of the observed radial velocity difference . Table 3 lists the possible range of values of the calculated parameters , , and for all bound-incoming solutions that give a radial velocity difference that is within of the observed value of . We note that if the two groups are not virialized, the masses derived from any estimator (see Sect. 2.1) will tend to be overestimates (Small et al. 1998). Hence, it may be unlikely that we have underestimated the total mass of the system. Only if the two groups are fully virialized will a deviation be as equally plausible as a deviation.
These inbound solutions imply that maximum expansion was achieved Gyrs ago. The groups are now less than apart and are moving at over relative to each other. They will cross () within years. The separation is so small and the relative velocity so high that the two groups should already be experiencing significant dynamical interactions and be well into the process of merging.
4 N-Body Simulations
In addition to the analytic calculations, we have used an N-body tree code to simulate the time evolution of our group-group system. This code is described in Barnes & Hut (1986,1989) and is available publically at the website ftp://hubble.ifa.hawaii.edu/pub/barnes/treecode/. Hierarchical tree codes are based on the concept of approximating the long-range force field of a localized region with a multipole expansion. A tree-structure partitions the system into a hierarchy of such regions. The gravitational field at any point is approximated by making a partial recursive descent of the tree to obtain a detailed description of the nearby mass distribution and a coarser description of the more distant parts of the system (see also Hernquist 1987). If a better approximation is necessary, the algorithm may either examine a finer level of the hierarchy or include more moments of the mass distribution for each region.
The usefulness of the N-body simulations is that we are able to run many simulations with a variety of initial conditions. The initial conditions relating to the particles themselves include their total number, the mass of each particle, and the three-dimensional position and velocity of each particle. We use the current observational configuration of the CL0023+0423 system to create the initial setup of our simulations. We begin by creating two groups of particles which we refer to as Group A and Group B. These two systems are analogous to the actual groups CL0023A and CL0023B and have properties based on the observed values. Because the mass ratio of CL0023B to CL0023A is approximately 17:1 (see Table 1), we include 17 times more particles in Group B; this ensures that each particle in the system has roughly equal mass. We include 100 particles in Group A in order to have a reasonable statistical sample for this group, as well as a sufficient number of total particles (1800). The specific numbers and ratios of particles do not seriously affect the statistical outcome of the simulations (see below). The exact particle mass is determined by choosing the total mass of each group and dividing by the respective number of particles in that group. In order to explore a wide range of parameter space, we randomly choose a mass of each group that is within of the observed value (see Table 1).
We must now place each of these particles in three-dimensional space. The adopted coordinate system is that shown in Figure 3 where is the transverse direction, is the vertical direction (coming out of the page), and is the direction along the line-of-sight. The configuration of the two group system is taken to be that in a bound-incoming solution (the dotted line in Figure 3). We have shown in Sect. 3 that, in order for the system to be bound, the smaller value of the projected separation is necessary (see Sect. 2.2 and Table A Group–Group Merger at a Redshift of ?); that is, . Therefore, for the simulations, we assume that the center of the two groups of particles are separated by in the transverse direction. This implies that the separation in the direction is (see Figure 3). For simplicity, we assume an value of degrees (see Table 3). We also assume that the groups are separated only in the plane, i.e. there is no displacement in the direction. Each particle in the group is now given an initial position around the group center. Because of the small number of confirmed group members, the radial profiles of the CL0023+0423 groups are highly uncertain; therefore, for each simulated group we randomly choose a radius which is within of the observed harmonic radius (see Table 1). We have chosen such wide range in radius, rather than as we have done with the group masses, because the harmonic radius may be a significant underestimate of the typical group radius because it is biased toward close pairs (see Paper II). When the radius is chosen, each particle is given a random position within a three-dimensional sphere of this radius.
In order to calculate the initial velocity of each particle, we first need to adopt a radial velocity difference () between the two groups. We do this by randomly choosing a value based upon the observed . We randomly choose an initial which is within of this value. Each particle, therefore, has an additive velocity due to relative motion between the two groups. For the particles in Group A, this means an additional velocity of in the (line-of-sight) direction and a velocity of in the direction. Similarly, for the particles in Group B, this velocity is in the direction and in the direction (see Figure 3). We assume no additive velocity in the direction. In addition to this relative velocity, each particle has a velocity due to its internal motion within the group. This motion is the result of the group’s velocity dispersion. Therefore, we first randomly choose a velocity dispersion that is within of the observed values (see Table 1). Each particle in the group is then given an extra velocity in each dimension based on this dispersion, assuming that the velocities within the group are isotropic and have a Gaussian distribution (see Figure 1).
We have now specified all the initial conditions for an individual simulation. In addition, the total number of timesteps, the duration of a timestep, the accuracy parameter , and the softening length must be specified. The accuracy parameter determines the size of the largest cell, in units of cell distance, which is not subdivided further (Barnes & Hut 1986,1989). The softening parameter is defined such that the maximum force between two particles occurs at distance of (see e.g. Binney & Tremaine 1987). We run each simulation for yrs with timesteps of . Based on empirical tests of our own and the error analysis of Barnes & Hut (1989), we have chosen an accuracy parameter of and a softening parameter of . With these parameters energy is conserved to better than 5%.
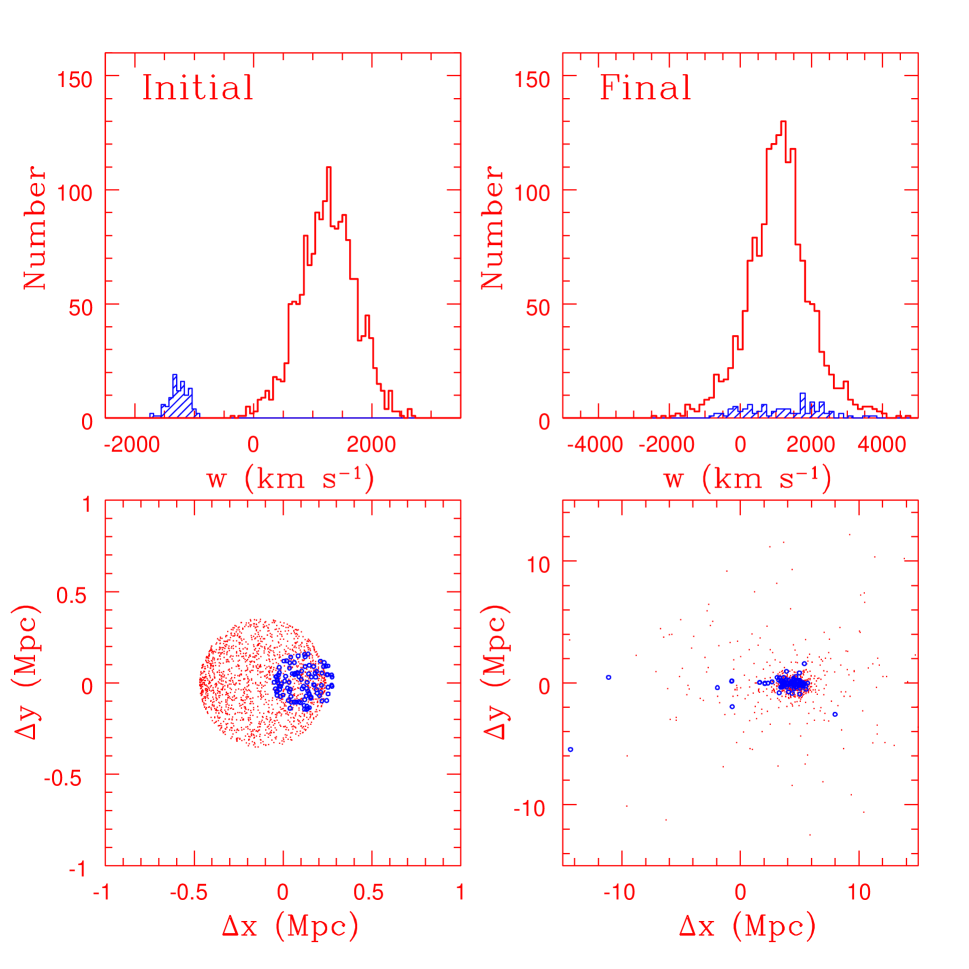
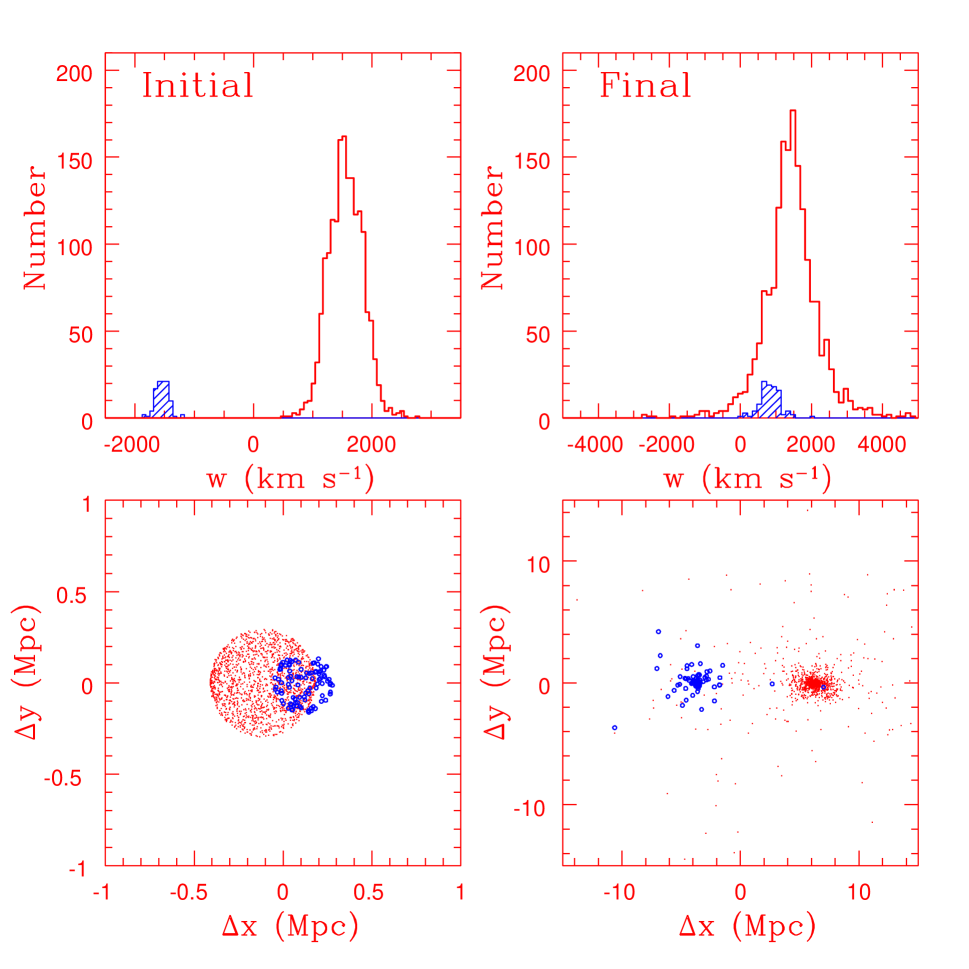
In order to perform a statistical analysis of the results, we have run 1000 individual simulations. We consider a final system to be “merged” if two criteria are satisfied at the final timestep of (or ). The median position of the particles that were originally in Group A and B are calculated. The separation between these two positions must be less than 4 Mpc. Secondly, their median radial velocities are calculated. The final velocity difference between the Group A and Group B particles must be less than the half-width of velocities in the entire system. Based on these criteria, we find that the two groups of particles have merged in 201 out of 1000 simulations. We have examined the final configuration for each of these simulations. The adopted merger criteria is quite conservative. All systems visually appear merged in the observable plane, as well as in the radial velocity distribution. A sample simulation which has successfully merged is shown in Figure 6. The radial velocity dispersion of the final system of particles is , typical of an Abell richness class 1 cluster. A sample simulation which has not merged is shown in Figure 7. It is clear from the resulting figure that this system is still separated in both radial velocity and position on the sky. The results of the simulations are fairly insensitive to the total number of particles or the number of particles per group. We have rerun the simulations with varying total particle number and ratio of particles in Group B to Group A (B:A always less than 1). We find that in all cases of the simulations satisfy our criteria for a merger, consistent with the percentage found above.
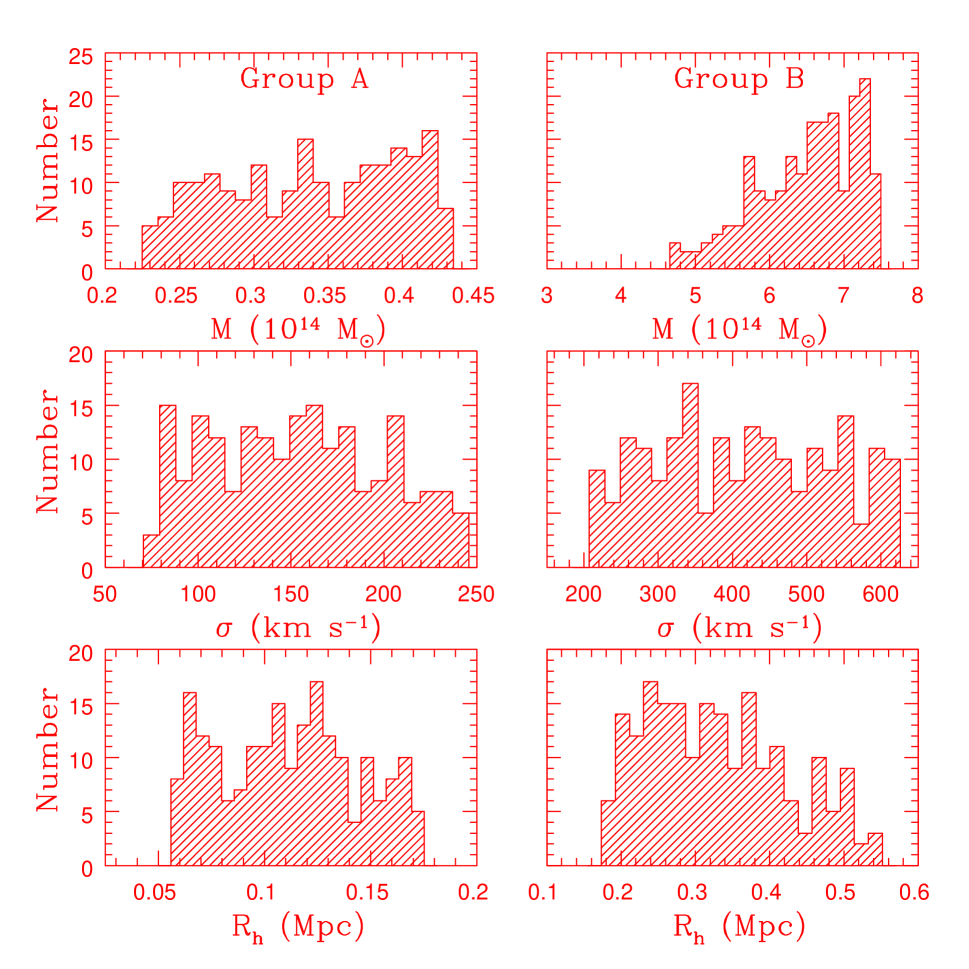
In Figure 8, we show the distributions of initial parameters (, and ) for Group A and B in those simulations where the two groups successfully merge. The median value (and the deviation as determined by the interquartile range) for each parameter is given in Table 4. The distributions of the parameters for the less massive system, Group A, are almost flat, indicating that the simulations are relatively insensitive to this system; however, there is a clear trend in the mass of the more massive system, Group B. This distribution is much more heavily weighted to larger masses. These results are consistent with the analytic analysis of Sect. 3 where we have also shown that more mass is required to bind this system. The median value of the mass of Group B is , or approximately 1 more than the observed mass of CL0023B. In addition, in Figure 9 we show the distribution of the radial velocity separation () for those simulations which have produced mergers. As expected, this distribution favors lower values of with the median value of .
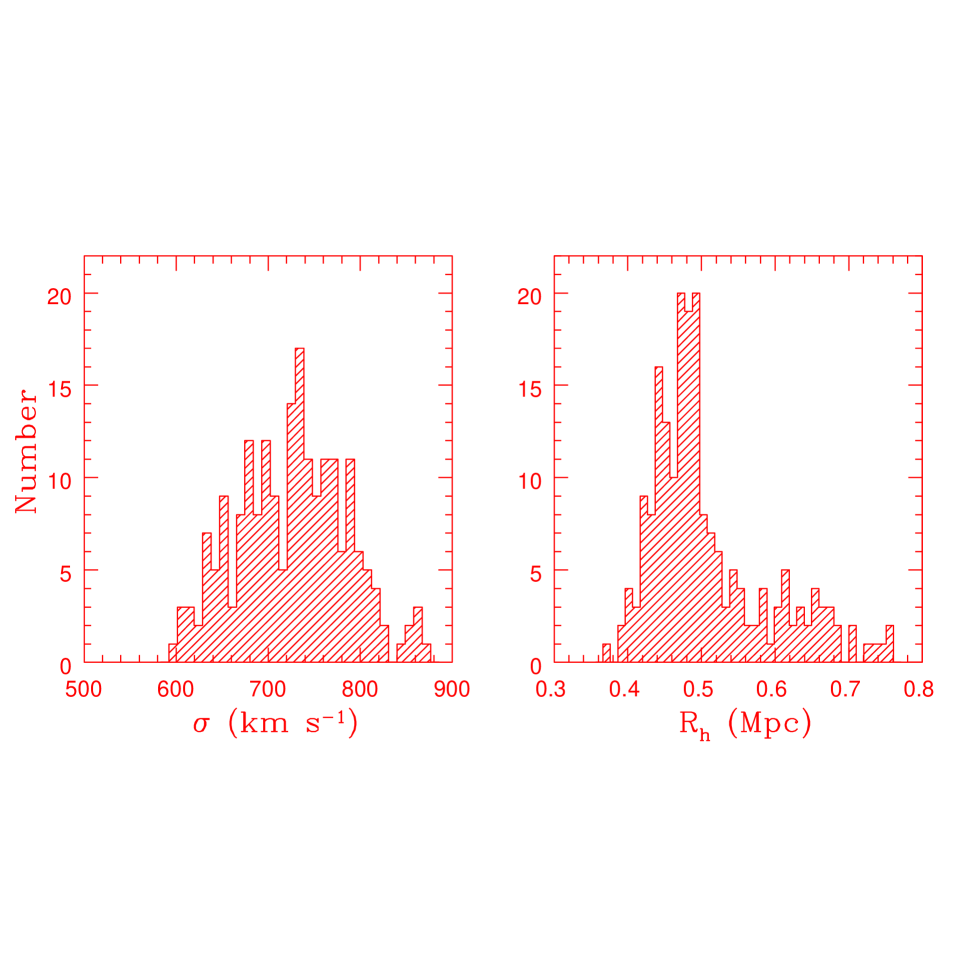
We can now examine the properties of the final systems of particles in those simulations where the two initial groups have merged. The final system of particles has properties which are typical of larger associations of galaxies, i.e. a cluster of galaxies. In Figure 10, we show the distributions of the velocity dispersion () and the harmonic radius in the merged systems at the final timestep of 4 Gyr. For both calculations, we have used only those particles which have a radial velocity difference relative to the mean cluster velocity of less than . The median radial velocity dispersion is ; these values are consistent with an Abell Richness class 1 cluster (Dressler 1980a; Bahcall 1981; Struble & Rood 1991). The median harmonic radius is . The values of are consistent with those found in local clusters where is typically less than 1.0 Mpc (e.g. Beers, Geller & Huchra 1982; Chapman, Geller & Huchra 1987; Postman, Geller & Huchra 1988). After 4 Gyrs, the cluster has had sufficient time to relax and form a central, compact core. During the first few Gyrs, the two groups make several passes through each other, finally merging at the second or third encounter (see also Nakamura, Hattori & Mineshige 1995). During this period, the cluster appears more analogous to local irregular or open clusters (such as Virgo) which exhibit a more uniform galaxy overdensity and a higher degree of irregularity (e.g. Abell 1958; Dressler 1980a,b; Abell, Corwin & Olowin 1989). All of the merged systems already appear as clusters Gyr after the start of the simulations, though the velocities of the system particles are not yet completely randomized. At the redshift of CL0023+0423 (), this implies that these systems will be observable clusters at redshifts of .
In summary, we have shown that, within the observational uncertainties, the group-group system of CL0023+0423 has enough mass and is close enough in both positional and velocity space to merge into a verifiable cluster of galaxies. If these two groups do merge, the resulting system will appear as a cluster of galaxies within Gyr or at a redshift of . Because the system is relatively young, noticeable dynamic evolution within the cluster is still taking place after 3 Gyr ().
5 Discussion
In this paper, we have used an analytic analysis, as well as N-body simulations, to examine whether the observed group-group system of CL0023+0423 will eventually merge. Both studies have shown that this system is most likely unbound and simply a chance projection on the sky. However, within the observational uncertainties, there do exist some system configurations where the two groups are bound and are in the process of merging. In the analytic analysis of the system dynamics, we have shown that there are bound-incoming solutions for this two body system if the radial separation of the two groups is on the order of , the total mass of the system is larger by 1 (), and the radial velocity difference between the two groups is smaller by 1 (). In addition, we have run 1000 N-body simulations with initial parameters that are randomly chosen to be within of the observed values. We find that the two groups have successfully merged in 201 simulations. Therefore, if the formal errors are an accurate measure of the uncertainty in the observational parameters, the group-group system of CL0023+0423 has an 20% chance of merging within a few Gyrs. This probability is, however, optimistic as the successful mergers depend strongly on certain parameters, specifically the mass of CL0023B and the radial velocity difference between the two groups. The N-body simulations indicate that, for a merger to occur, the system must have a mass which is on the high end and a radial velocity difference which is on the low end of the possible range in observed values. However, if the groups are not truly virialized, the mass will be overestimated by as much as a factor of 2 (Small et al. 1998); therefore, the choice of a large mass would go in the opposite direction of the likely systematic bias. If the two groups eventually merge, the resulting system has a characteristic velocity dispersion and harmonic radius which are typical of a richness class 1 or 2 cluster.
For the discussion of the implications for cluster formation, we will assume that the group-group system in CL0023+0423 will eventually merge. The simulations indicate that the merged systems will appear as a cluster of galaxies within (at ); therefore, the groups of galaxies in CL0023+0423 are likely to be the progenitors of some intermediate-redshift clusters. As discussed in Sect. 4, the resulting cluster is still evolving dynamically after 3 Gyrs or at redshifts of . Therefore, over this time period, the system would appear more like an open cluster which are irregular, loose, and presumably dynamically young. Several clusters belonging to this class have been studied at redshifts of . High-resolution HST imagery of these clusters have been used to measure the morphological composition of the galaxy populations. Because the number of spectroscopically confirmed cluster members is limited, the morphological fractions are determined statistically using background-corrected distributions of morphologies. These studies imply elliptical fractions between and total early-type (E + S0) fractions between (Dressler et al. 1997; Stanford, Eisenhardt & Dickinson 1997; Andreon, Davoust & Heim 1997; Couch et al. 1998). Classifiers of these galaxies estimate that the errors in a particular morphological bin is approximately (see Smail et al. 1997; Andreon, Davoust & Heim 1997; Andreon 1998). Comparisons between independent studies confirm these uncertainties and may imply even larger ones; for example, take the open cluster CL0939+4713 at a redshift of . Andreon, Davoust & Heim (1997) find an elliptical fraction of 15%, while Dressler et al. (1997) find 37% (). These fractions are statistically different and are not the result of small number statistics (Andreon 1998). The fractions for the total early-type population appear more consistent. For this cluster, independent classifiers find early-type fractions of 49, 56, and 60%, respectively (Andreon, Davoust & Heim 1997; Dressler et al. 1997; Stanford, Eisenhardt & Dickinson 1997). However, as implied by the large discrepency in the elliptical fraction, there is contention about the ratio of elliptical to S0 galaxies in both open and compact clusters at these redshifts. Dressler et al. (1997) have examined 10 clusters at and find that, compared to local clusters, the fraction of S0 galaxies is smaller by a factor of . However, other classifiers of the same clusters do not find this discrepency (Stanford, Eisenhardt & Dickinson 1997; Andreon, Davoust & Heim 1997). Therefore, it is fair to say that the exact morphological fractions in intermediate-redshift clusters are still not accurately known.
In Paper III, we have performed a similar morphological analysis on the two groups in CL0023+0423 using both high-resolution HST imagery and the spectral characteristics of the member galaxies. The morphological classifications of the galaxies within the HST field-of-view () were made according to the Revised Hubble system of nearby galaxies (e.g. Sandage 1961; Sandage & Bedke 1994). The spectroscopic coverage of the HST field is limited with only 12 confirmed members. Seven are classified as spiral or irregular galaxies. The remaining five have been classified as either an elliptical or compact galaxy; none were classified as S0 galaxies. We expect that these identifications are relatively robust and directly comparable to the classifications of nearby galaxies as we are morphologically classifying these high-redshift galaxies just slightly bluewards of the well-studied band and to roughly the same limiting surface brightness as local samples (see Paper III). Of the five galaxies classified as ellipticals, three show old, red absorption spectra typical of present-epoch ellipticals. The other two have asymmetric disks and are identified as possible mergers (see Paper III). Their spectra show strong star-forming features and are consequently bluer than the other ellipticals. Their properties are more consistent with those of blue compact galaxies found at redshifts of in previous HST observations (Koo et al. 1994, 1995). All other galaxies in the HST field-of-view with strong O II emission (equivalent widths of greater than 10 Å) are classified as spirals or irregular/peculiar galaxies. Therefore, based on both spectral and morphological evidence, we find an early-type fraction of 25% (3 out of 12) in the central region of the CL0023+0423 system. If we try to improve the statistics by examining the spectral characteristics of the confirmed group members over the larger LRIS field-of-view (; see Paper I), we find that only 17% (4 out of 24) of the confirmed members have old, red absorption spectra (ages of Gyrs; see Paper II). Two-thirds of all group members have active star formation with O II equivalent widths which are typically much larger than 10 Å; the average O II equivalent width is 35 Å. If we assume that all of these galaxies are spirals or irregulars (as is the case for those galaxies with HST morphologies; see above), the spectral results imply early-type fractions of 33% or less.
We have examined the effect of sample completeness on these percentages, i.e. the possibility that some of the galaxies in this field which have spectra but no redshift measurement are actually system members with an absorption spectra that is consistent with a very faint, early-type galaxy. Based on the numbers listed in Table 1 of Paper II, we present a statistical argument to estimate the number of such galaxies. We use the fraction of galaxies in this field that have an absorption spectrum and are also confirmed system members (25%), as well as the number of galaxies down to our limiting magnitude which have spectra but no redshift measurement (14). If we assume that all 14 of these galaxies have faint absorption spectra, we expect that four (or less) are system members which have been missed. This implies that purely absorption spectra galaxies comprise less than 29% of the system population. Therefore, we conclude that our early-type fractions as estimated spectroscopically should not be significantly biased by incompleteness.
Because the number of confirmed group members with HST morphologies is small, we have also examined the background-subtracted distribution of galaxy morphologies in this system. This study indicates that CL0023+0423 has a galaxy population which is more typical of the field. The numbers are consistent with 100% of the galaxies in this two group system being normal spirals. Of all the galaxies brighter than in the central of this system, early-type galaxies may comprise only of the total population. The formal uncertainties are large because of the small number statistics (see Paper III); however, there are consistent with the spectral results. If these groups are in the process of forming a cluster, a comparison between the morphological fractions in the CL0023+0423 system and those in open, intermediate-redshift clusters may indicate that a non-negligible fraction of early-type galaxies are formed between redshifts of and . These results are only suggestive because of the large uncertainties in the morphological fractions at both intermediate and high redshift.
If formation of early-type galaxies is occurring during this time period, we would expect that a significant fraction of these galaxies in open clusters would have spectral features which are characteristic of star formation activity within the last Gyr. Preliminary spectral studies indicate that early-type galaxies in intermediate-redshift clusters (both open and compact) show no signs of current or recent star formation; however, there is a non-negligible fraction which show post-starburst spectral features (Dressler et al. 1994; Barger et al. 1996; Oemler, Dressler & Butcher 1997; Poggianti 1997; Couch et al. 1998). Starbursts are thought to be the result of mergers or interactions between galaxies. Such events can drive substantial evolution in not only the stellar population, but also the morphological appearance of the galaxy (e.g. Schweizer 1986; Hibbard et al. 1994). The morphological signatures of a merger between two disk galaxies, such a long, bright tidal tail, would be visible for only Gyrs. After this time, the tidal debris becomes indistinguishable from the main merger remnant, a morphologically normal elliptical galaxy (Mihos 1995, 1998). These timescales are consistent with the transformation of disk galaxies to spheroids between redshifts of and . In fact, the fraction of galaxies in intermediate-redshift clusters which exhibit signs of merging events, such as distorted morphologies or tidal tails, is as large as 20% (e.g. Lavery & Henry 1988; Lavery, Pierce & McClure 1992; Dressler et al. 1994; Barger et al. 1996; Oemler, Dressler & Butcher 1997; Couch et al. 1998). In the CL0023+0423 system, we also find that 41% (5 out of 12) of the confirmed cluster members with HST morphologies have either a ring structure, an asymmetric disk, or a double nuclei which may indicate an interaction or merger. In addition, Koo et al. (1995) suggest that blue compact galaxies (of which there are two in this system; see above) are galaxies which have undergone a recent, strong burst of star formation. The galaxy luminosity will eventually fade by several magnitudes, resulting in a system with a surface brightness and velocity width which are typical of nearby low-luminosity spheroids (see Kormendy & Bender 1993). The wide range in redshift () over which these galaxies are found also implies that major star formation episodes have occurred in some spheroids over many Gyrs. Because the group velocity dispersion is on the order of the internal velocity of its member galaxies, the kinematics of poor groups makes them a favorable environment for galaxy-galaxy encounters (Aarseth & Fall 1980; Barnes 1985; Merritt 1985). Therefore, it is conceivable that groups of galaxies like those of CL0023+0423 may be the sites of morphological evolution in galaxies.
Signatures of past starburst activity are not uncommon in local environments. For example, studies of nearby rich clusters with substantial substructure, as well as local groups of galaxies, indicate that of the early-type member galaxies have experienced recent or ongoing star formation (Caldwell & Rose 1997; Zabludoff & Mulchaey 1998). Field ellipticals also show remnants of past violent activity. Line strengths indicate that approximately 25% of all field ellipticals have produced 10% or more of their stars since redshifts of (Trager 1997). These fractions are even higher for S0 galaxies where show such activity (Fisher, Franx & Illingworth 1996; Trager 1998). These results also suggest that some early-type galaxies have experienced and are still experiencing considerable evolution since (see also Schweizer 1997).
If the results of the study of CL0023+0423 do support early-type formation at relatively recent epochs, it does not preclude in any way the formation of these galaxies at very high redshift or, subsequently, the existence of large populations of early-type galaxies in high-redshift clusters. In fact, much data, including galaxy age and color scatter, support a very early epoch () for the formation of early-type galaxies (e.g. Dickinson 1995; Steidel et al. 1996; Ellis et al. 1997; Oke, Gunn, Hoessel 1997; Stanford, Eisenhardt & Dickinson 1997; Paper II). Additionally, already well-formed clusters at appear to have fractions of early-type galaxies which are comparable to local clusters (Stanford, Eisenhardt & Dickinson 1997; Stanford et al. 1997; Dickinson 1997; Lubin et al. 1998). The relaxed, well-formed nature of these systems suggest that they formed at a much earlier epoch, allowing for perhaps enough time to create a significant population of early-type galaxies. The observations of the CL0023+0423 system may simply imply that a fraction of the early-type population is forming and/or undergoing significant activity at redshifts of .
On the other hand, the fact that a sizable portion of the early-type population in certain clusters are formed at redshifts of may be difficult to reconcile with the tight color-magnitude relation found in clusters of galaxies between redshifts of and (e.g. Stanford, Eisenhardt & Dickinson 1995, 1997; Ellis et al. 1997). The small intrinsic color scatter in early-type galaxies implies that the fractional differences in age between the stellar population in these galaxies are small (Bower, Lucey & Ellis 1992). Because the color scatter in the E/S0 populations remains roughly constant to , this suggests that the last period of major star-formation took place at redshifts significantly greater than 1 (see also Aragón-Salamanca et al. 1993; Stanford, Eisenhardt & Dickinson 1995; Paper II). The majority of the clusters in these studies have been centrally-concentrated, compact clusters. Cluster concentration, which correlates well with degree of regularity, is measured by the compactness parameter where and refer to the radii containing 60% and 20% of the cluster population, respectively (Butcher & Oemler 1978). It is conceivable that open, irregular clusters () have systematically larger E/S0 color scatters which are the result of their more recent evolutionary history. Five open clusters have been well-studied at intermediate redshifts, CL0303+17, CL0412-65, CL0939+47, CL1447+23, and CL1601+42. The color scatter in their early-type populations are all consistent with the mean scatter of the entire cluster sample (Ellis et al. 1997; Stanford, Eisenhardt & Dickinson 1997). However, the relatively large uncertainties in the estimated scatters may still allow for a systematic difference between open and compact clusters. There are other apparent differences between these types of clusters; for example, the morphology-density relation which is characteristic of both open and compact clusters locally is qualitatively similar in compact clusters at intermediate redshift but completely absent in the loose, open clusters (Dressler et al. 1997).
Even if the two CL0023+0423 groups are not in the process of merging, the observations of this system may have implications for the evolution of groups of galaxies. CL0023A and CL0023B have similar kinematic characteristics to local groups. Their velocity dispersions and estimated masses are typical of well-studied groups in the nearby universe (Hickson 1982; Ramella, Geller & Huchra 1989; Mulchaey et al. 1996; Zabludoff & Mulchaey 1998). Locally, there exists a well-established correlation between the early-type fraction and the group velocity dispersion (Hickson, Kindl & Huchra 1988; Zabludoff & Mulchaey 1998). As the velocity dispersion increases from 100 to , the early-type fraction rises from effectively zero to 55%. These calculations include all member galaxies which are brighter than the absolute magnitude limit of to and within a radius of . Systems with larger velocity dispersions move into the more massive cluster regime. Here, the relation between early-type fraction and velocity dispersion flattens out with clusters of galaxies typically having an early-type fraction of within these magnitude and radial limits (Dressler et al. 1980a; Whitmore, Gilmore & Jones 1993). Most clusters at are not sampled to such faint limits. If a brighter magnitude limit were adopted on the local group data (), the statistics worsens though the early-type fraction does increase as the brightest galaxies in groups and clusters are normally early-types. For the groups with the highest velocity dispersion, the early-type fraction approaches 80% or more, again consistent with the morphological composition of present-day clusters (Oemler 1974; Dressler et al. 1980a; Whitmore, Gilmore & Jones 1993; Dressler et al. 1997).
Based on the local correlation between early-type fraction and velocity dispersion described above, the modest early-type fractions in both CL0023+0423 groups may imply that the galaxy populations in groups of galaxies have evolved (see also Paper III). We explore this possibility by examining the spectroscopically-confirmed group members. These data corresponds to an absolute magnitude limit of to (see Paper II). In CL0023A, four of the 7 galaxies are morphologically classified as spirals (see Paper III). Of the remaining three galaxies, one is classified as an elliptical. The other two are not within the HST field-of-view and, therefore, have no direct morphological information; however, they both have very high equivalent width O II emission (20 and 28.6 Å, respectively). Based on the spectroscopic and morphological data from the two cluster fields presented in Papers II and III, we find that 86% of all galaxies with such strong O II emission are classified as either a spiral or irregular/peculiar; the other 14% are classified as ellipticals though their photometric and spectral properties indicate that they are more similar to blue compact galaxies (see above). This correlation between morphology and O II emission would suggest that the remaining two galaxies in CL0023A are most likely late-type galaxies. Therefore, the elliptical fraction would be only 14% (1 out of 7). Indeed, only 29% (2 out of 7) of the confirmed members have a typical K star absorption spectra which is old and red. These two galaxies are classified as an elliptical (MDS ID #17; see Sect. 5.3.1 of Paper III) and a peculiar Sa (MDS ID #82; see Sect. 5.3.2 of Paper III). Based on the local relation, we would expect an early-type fraction of for this low dispersion system of . The expected fraction should actually be higher, perhaps 33%, as the local data goes over two magnitudes fainter. In addition, with only 7 redshifts, the velocity dispersion of this group is likely biased low by a factor of (Zabludoff & Mulchaey 1998). This bias would also imply a predicted early-type fraction which is higher.
CL0023B has 17 confirmed members, of which 7 have direct morphological information. Of these seven, three are spirals, two are blue compact galaxies (classified as ellipticals), one is an elliptical, and one is classified as compact (see Paper III). Only 2 of these 7 galaxies have both spectroscopic and morphological properties which are characteristic of an elliptical galaxy. Overall, 11 out of 17 confirmed group members have extremely strong O II emission (an average equivalent width of 43 Å). If we assume that all of these are late-type galaxies as is true for the vast majority of galaxies with direct morphological information (see above), this suggests an early-type fraction of 35% or less. In fact, only 12% (2 out of 17) of the confirmed group members have an old, red K star absorption spectrum. These two galaxies are morphologically classified as an elliptical (MDS ID #20) and a compact galaxy (MDS ID #115; see Sect. 5.3.1 of Paper III). For CL0023B with a velocity dispersion of , the local relation would predict an early-type fraction of . For the brighter magnitude cut which is characteristic of our high-redshift data, this fraction would be 80% or more.
These observations suggest that there is no strong correlation between early-type fraction and velocity dispersion in the CL0023+0423 system. Consequently, the difference between our observations and that predicted by the local relation may imply early-type formation and, therefore, a change in the morphological composition of groups of galaxies between redshifts of and the present epoch. This evolution would suggest that, in order to create the correlation between velocity dispersion and early-type fraction that exists in local groups of galaxies, the new early-type galaxies will form only in the more massive systems. These hypotheses are only valid if we assume that the groups of CL0023+0423 are typical of all groups at high redshift and that high-redshift groups are the progenitors of local galaxy groups. It is also important to stress that the very limited number of confirmed members with direct morphology imply large statistical (and perhaps systematic) errors in both the velocity dispersion and early-type fractions of both components. Therefore, we cannot say for certain that the properties of the CL0023+0423 groups are truly inconsistent with the early-type fraction versus velocity dispersion relation observed locally. Indeed, even the nearby relation contains a large scatter with many local groups being significant outliers from the best-fit correlation (Zabludoff & Mulchaey 1998).
The observations of CL0023+0423 have provided us with the first detailed data on the optically-selected groups of galaxies and a potential group-group merger at high redshift. Though broad conclusions certainly cannot be made based on only two high-redshift groups, the results are suggestive, implying that there may be substantial evolution in galaxy morphology occurring at redshifts of .
We would like to thank the referee Ann Zabludoff for very useful comments on the text. We also thank J.S. Mulchaey and S.C. Trager for helpful discussions and P. Brieu and L. Hernquist for expert advice on the N-body simulations. The W.M. Keck Observatory is operated as a scientific partnership between the California Institute of Technology, the University of California, and the National Aeronautics and Space Administration. It was made possible by generous financial support of the W. M. Keck Foundation. Support for LML was provided by NASA through Hubble Fellowship grant HF-01095.01-97A awarded by the Space Telescope Science Institute, which is operated by the Association of Universities for Research in Astronomy, Inc., for NASA under contract NAS 5-26555. This research was supported in part by HST GO analysis funds provided through STScI grant GO-06000.01-94A.
References
- (1) Aarseth, S.J. & Fall, S.M. 1980, ApJ, 236, 43
- (2) Abell, G.O. 1958, ApJS, 232, 689
- (3) Abell, G.O., Corwin, H., & Olowin, R. 1989, ApJS, 70, 1
- (4) Andreon, S., Davoust, E., & Heim, T. 1997, A&A, 323, 337
- (5) Aragón-Salamanca, A., Ellis, R.S., Couch, W.J. , & Carter, D. 1993, MNRAS, 262, 764
- (6) Bahcall, N.A. 1975, ApJ, 198, 249
- (7) Bahcall, N.A. 1981, ApJ, 247, 787
- (8) Barger, A.J., Aragon-Salamanca, A., Ellis, R.S., Couch, W.J., Smail, I., & Sharples, R.M. 1996, MNRAS, 279, 1
- (9) Barnes, J. 1985, MNRAS, 215, 517
- (10) Barnes, J. & Hut, P. 1986, Nat, 324, 446
- (11) Barnes, J. & Hut, P. 1989, ApJS, 70, 389
- (12) Beers, T.C., Geller, M.J., & Huchra, J.P. 1982, ApJ, 257, 23
- (13) Binney, J. & Tremaine, S. 1987, Galactic Dynamics (Princeton : Princeton University Press)
- (14) Bower, R., Lucey, J.R., & Ellis, R.E. 1992, MNRAS, 254, 589
- (15) Butcher, H. & Oemler, A. 1978, ApJ, 226, 559
- (16) Caldwell, N. & Rose, J.A. 1997, AJ, 113, 492
- (17) Carlberg, R.G., Yee, H.K.C., Ellingson, E., Abraham, R., Gravel, P., Morris, S., & Pritchet, C.J. 1996, ApJ, 462, 32
- (18) Chapman, G.N.F., Geller, M.J., & Huchra, J.P. 1987, AJ, 94, 571
- (19) Couch, W.J., Barger, A.J., Smail, I., Ellis, R.E., & Sharples, R.M. 1998, MNRAS, in press, astro-ph/9711019
- (20) Danese, L., DeZotti, G., & Tullio, G. 1980, A&A, 82, 322
- (21) Dickinson, M. 1995, Fresh Views on Elliptical Galaxies, eds. A. Buzzoni et al., ASP Conference Series
- (22) Dickinson, M. 1997, Galaxy Scaling Relations : Origins, Evolution, and Applications, ed. L. da Costa (Berlin : Springer)
- (23) Dressler, A. 1978, ApJ, 226, 55
- (24) Dressler, A. 1980a, ApJ, 236, 351
- (25) Dressler, A. 1980b, ApJS, 42, 565
- (26) Dressler, A. & Shectman, S. 1988, AJ, 95, 985
- (27) Dressler, A., Oemler, A., Butcher, H.R., & Gunn, J.E. 1994, ApJ, 430, 107
- (28) Dressler, A., Oemler, A., Couch, W.J., Smail, I., Ellis, R.E., Barger, A., Butcher, H., Poggianti, B.M., & Sharples, R.M. 1997, ApJ, 490, 577
- (29) Ellis, R.S., Smail, I., Dressler, A., Couch, W.J., Omeler, A., Butcher, H., & Sharples, R. 1997, ApJ, 483, 582
- (30) Evrard, A.E. 1990, in Clusters of Galaxies, ed. W.R. Oegerle et al. (Cambridge: Cambridge Univ. Press), 287
- (31) Fisher, D., Franx, M., & Illingworth, G. 1996, ApJ, 459, 110
- (32) Geller, M.J. & Beers, T.C. 1982, PASP, 94, 421
- (33) Gunn, J.E., Hoessel, J.G., & Oke, J.B. 1986, ApJ, 306, 30
- (34) Hernquist, L. 1987, ApJS, 64, 715
- (35) Hibbard, J.E., Guhathakurta, P., van Gorkom, J.H., & Schweizer, F. 1994, AJ, 107, 67
- (36) Hickson, P. 1982, ApJ, 255, 382
- (37) Hickson, P., Kindl, E., & Huchra, J.P. 1988, ApJ, 331, 64
- (38) Huchra, J.P. & Geller, M.J. 1982, ApJ, 257, 423
- (39) Jones, C. & Forman, W. 1990, in Cluster of Galaxies, ed. W.R. Oegerle et al. (Cambridge: Cambridge Univ. Press), 257
- (40) Jones, C. & Forman, W. 1992, in Clusters and Superclusters of Galaxies, ed. A. Fabian (Dordrecht : Kluwer), 49
- (41) Kormendy. J. & Bender, R. 1993, in Dwarf Galaxies, ESO/OHP Workshop, eds. G. Meylan & P. Pringniel (Garching : ESO), p. 161
- (42) Lacey, C. & Cole, S. 1993, MNRAS, 262, 627
- (43) Lacey, C. & Cole, S. 1994, MNRAS, 271, 676
- (44) Landolt, A. U. 1992, AJ, 104, 340
- (45) Lavery, R.J. & Henry, J.P 1988, ApJ, 330, 596
- (46) Lavery, R.J., Pierce, M.J., & McClure, R.D. 1992, AJ, 104, 2067
- (47) Lubin, L.M., Postman, M., Oke, J.B., Ratnatunga, K.U., Gunn, J.E., Hoessel, J.G., & Schneider, D.P. 1998, AJ, in press (Paper III)
- (48) Merritt, D. 1985, ApJ, 289, 18
- (49) Mihos, J.C. 1995, ApJ, 438, L45
- (50) Mihos, J.C. 1998, private communication
- (51) Mohr, J.J., Fabricant, D.G., & Geller, M. 1993, ApJ, 413, 492
- (52) Mulchaey, J.S., Davis, D.S., Mushotzky, R.F., & Burstein, D. 1996, ApJ, 456, 80
- (53) Nakamura, F.E., Hattori, M., & Mineshige, S. 1995, A&A, 302, 649
- (54) Oke, J.B. et al. 1995, PASP, 107, 375
- (55) Oke, J.B., Gunn, J.E., & Hoessel, J.G. 1997, AJ, 111, 29
- (56) Oke, J.B., Postman, M., & Lubin, L.M. 1998, AJ, in press (Paper I)
- (57) Oemler, A. 1976, ApJ, 209, 693
- (58) Oemler, A., Dressler, A., & Butcher, H. 1997, AJ, 474, 561
- (59) Poggianti, B.M. 1997, astro-ph/9712034
- (60) Postman, M., Geller, M.J., & Huchra, J.P. 1988, AJ, 95, 267
- (61) Postman, M., Lubin, L.M., & Oke, J.B. 1998, AJ, in press (Paper II)
- (62) Ramella, M., Geller, M.J., & Huchra, J.P. 1989, ApJ, 344, 57
- (63) Sandage, A. 1961, The Hubble Atlas, The Carnegie Institute of Washington Publication
- (64) Sandage, A. & Bedke, J. 1994, The Carnegie Atlas of Galaxies, The Carnegie Institution of Washington Publication
- (65) Schweizer, F. 1986, Science, 231, 227
- (66) Schweizer, F. 1997, astro-ph/9712017
- (67) Smail, I., Dressler, A., Couch, W.J., Ellis, R.E., Oemler, A., Butcher, H.R., & Sharples, R.M. 1997, ApJS, 110, 213 (S97)
- (68) Small, T.A., Chung-Pei, M., Sargent, W.L.W., & Hamilton, D. 1998, ApJ, 492, 45
- (69) Stanford, S.A., Eisenhardt, P.R.M., & Dickinson, M. 1995, ApJ, 450, 512
- (70) Stanford, S.A., Eisenhardt, P.R.M., & Dickinson, M. 1997, ApJ, 492, 461
- (71) Stanford, S.A., Elston, R., Eisenhardt, P.R., Spinrad, H., Stern, D., & Dey, A. 1997, AJ, 114, 2232
- (72) Steidel, C.C., Giavalisco, M., Pettini, M., Dickinson, M., & Adelberger, K.L. 1996, ApJ, 462, L17
- (73) Struble, M.F. & Rood, H.J. 1991, ApJS, 77, 363
- (74) Trager, S.C. 1997, PhD Thesis, Univ. of California, Santa Cruz
- (75) Trager, S.C. 1998, private communication
- (76) Valdes, F. 1982, Proc. SPIE, 331, 465
- (77) West, M. & Bothun, G. 1990, ApJ, 350, 36
- (78) White, S.D.M. 1975, MNRAS, 117, 717
- (79) Whitmore, B., Gilmore, D., & Jones, C. 1993, ApJ, 407, 489
- (80) Zabludoff, A.I. & Zaritsky, D. 1995, ApJ, 447, L21
- (81) Zabludoff, A.I. & Mulchaey, J.S. 1998, ApJ, in press, astro-ph/9708132
| System | Nz | ) | (Mpc) | ||||
|---|---|---|---|---|---|---|---|
| 0023A | 7 | 0.8274 | |||||
| 0023B | 17 | 0.8453 |
Table 2. Separation between the Two Groups Case Center Type CL0023A CL0023B Separation Physical Separation RA (J2000) Dec (J2000) RA (J2000) Dec (J2000) (arcsec) () 1 Median Position + + 47.3 0.23 2 Brightest Galaxy + + 103.0 0.50
| (Mpc) | (Gyr) | (degrees)aaThe range of acceptable parameters are given for all bound-incoming solutions within of the observed radial velocity difference, . | (degrees)aaThe range of acceptable parameters are given for all bound-incoming solutions within of the observed radial velocity difference, . | (Mpc)aaThe range of acceptable parameters are given for all bound-incoming solutions within of the observed radial velocity difference, . | |
|---|---|---|---|---|---|
| 0.23 | 6.85 | 3.98 | |||
| 0.23 | 5.94 | 7.96 |
| Group | () | (Mpc) | |
|---|---|---|---|
| A | |||
| B |