Determination of and for A0 type stars and its impact on the interpretation of the HR diagram with the HIPPARCOS results
Abstract
The determination of the “Fundamental Parameters” and for a set of dwarf A0-type stars is discussed in terms of consistency when comparing these values determined through different methods. The position of these stars in the HR diagram are discussed, taking into account the HIPPARCOS data. A large number of binary stars with components of similar spectral types has been found from this spectroscopic survey.
Key words: Stars: fundamental parameters – Stars: A0-type – HIPPARCOS – HR diagram
1 Introduction
Our purpose is to analyse a set of A0-type, non-giant stars, in order to define a sample to be used as standard stars for further studies. These stars have parallaxes mesured from the HIPPARCOS experiment and their position in the HR diagram will be used to derive their evolutionary status. The spectra obtained in the Hγ region are used to detect peculiarities as well as to check the fit with theoretical spectra computed with and values determined from calibrations of colour indices.
2 Selection of the sample
All stars with a spectral type A0V in the Bright Stars Catalogue (1982 ed.) (hereafter BSC), excluding those recognized as peculiar, shell stars and SB2 have been selected; this sample contains 230 objects. Spectroscopic data refer to a second sample of A0 stars brighter than the 7th magnitude extracted from a larger set of A-type stars defined in the framework of our ESO Key programme (Gerbaldi et al. 1989). Slightly more than 70 A0 type stars were extracted from this set, for which spectra were obtained in the spectral range 4200 - 4500 Å using the Echelec spectrograph attached to the 1.52-m ESO telescope. All the observations were done at the European Southern Observatory (ESO), La Silla, Chile. The already known peculiar stars, Ap and Am, were a priori excluded from the sample.
3 Atmospheric Parameters
The atmospheric parameters and were derived from calibrated colour indices because we had not enough data to derive from the Infrared flux method (Blackwell et al. 1980). Very few attention has been given up to now to the dwarf stars in the range of spectral types A0 – A3 where the Balmer line profiles vary with both and .
Any calibration of colour indices in terms of and
rely upon :
synthetic indices
These are affected by the ingredients used to compute the atmosphere models
and then the synthetic spectra (chemical abundances, convection…)
The synthetic indices are used to define the zero point by comparing their
values to those of some standard stars.
well determined values of and
The most commonly used values are those deduced by Code et al.
(1976) using the angular diameters measured by Hanbury-Brown et al.
(1974) and the energy distribution from the UV to the Infrared.
The values are obtained from binary systems.
Very recently new measurements of the stellar angular diameters have been done in Australia (see Booth, 1997), but they have not been incorporated into the re-calibration of any photometric system. The accuracy of the Infrared flux method to determine has been extensively discussed by Mégessier (1994, 1995, 1997a, 1997b).
The best sources of information for and for our sample of early type stars, are the uvby and Geneva photometric systems. Several calibrations of the uvby system exist; we shall use that by Moon & Dworetsky (1985) (hereafter quoted MD) which has been tested and refined since more than a decade.
The MD calibration relies upon synthetic colours and indices from Relyea and Kurucz (1978), Philip and Relyea (1979), Schmidt (1979) and Kurucz (1979). The zero point has been adjusted by means of stars with well determined and values. The photometric calibration for B-type stars has been re-evaluated by Castelli (1991). Tests on this calibration done by Balona (1994) and by Napiwotzki et al. (1993) have shown that no important modification of the MD calibration is needed for early A-type stars. Napiwotzki et al. (1993) suggested a small correction to be done on for K. Smalley and Dworetsky (1995) re-evaluated the fundamental values of as determined by Code et al. (1976) using recent flux measurements; no significant differences were found by these authors. To conclude, up to now, no revision of the MD calibration of the uvby is required for dwarf A0 stars.
The calibration of the Geneva photometry for early-type stars is very recent (Künzli et al. 1997); this system is quite independent from the previous one in the sense that it does not include any narrow band centered on a Balmer line; moreover, its calibration is done using recent Kurucz flux computations and it is based on a different and larger set of standard stars.
It is therefore interesting to compare the results obtained from these two systems and to analyse the coherence of the parameters obtained from different aspects of the emitted stellar flux.
4 and accuracy
4.1 Influence of the colour excess E(b-y) on ,
Before computing the atmospheric parameters, the observed colour indices must be de-reddened. For the bright stars of our sample, their visual magnitude being less than 7.0 mag, the reddening is expected to be null or negligible.
Even though the reddening is expected to be negligible, we tested it; we used the programme UVBYBETA by Moon (1985) in order to check the consistency of the observed values in term of “normality” of the star. We know that any “blueing” can be interpreted as due to a Bp-Ap effect, and any strong reddening requires to have a close look at the spectrum. The determination of the amount of reddening is based on an empirical calibration of the uvby system, so it is free from any atmospheric model. Jordi et al. (1997) have discussed the reddening law of Hilditch (1983) adopted by Moon (1985) ; they have shown that Moon overestimates the E(b-y) value compared to another de-reddening law : the one by Grosbol (1978). Due to the fact that the stars of our sample have a small value of their colour excess E(b-y), the error made by using one or the other reddening law will be small.
We have shown (Gerbaldi et al. 1997) that a moderate reddening of E(b-y)=0.01 produces a difference in of 200K (see Figure 1 in Ref. cited); on determination, the effect is negligible (see Figure 2 in Ref. cited). The stars which are outside the mean relation have values of the parameters a0 and r which are outside the limits of the grids used by the MD programme; it is a numerical effect which produces an incorrect result.
In fact a small non-zero value for E(b-y) can arise from uncertainties on the colours as well as on the group choice.

4.2 Effect of the group choice on and
Dereddening procedures for A0-type stars
require to assign these stars to one of these groups:
early group : 2.59 2.88
intermediate group 2.87 2.93
In Moon’s (1985) programme UVBYBETA the information
concerning the spectral type is added. The assignement
to a group is sometimes ambiguous, errors in group selection cannot
be avoided and this may produce uncertain dereddened colours.
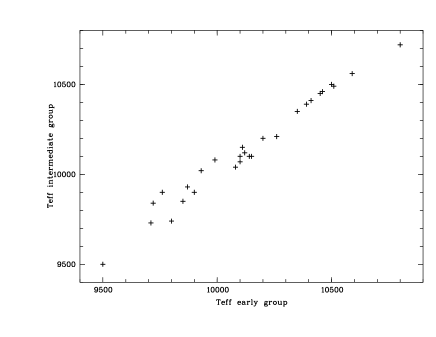
We have estimated the effect on , of a wrong group
selection, which can be due to an observational error on the value of .
To select the stars to do such a test, we have considered an error on
of , so the limits are 2.869 and 2.890.
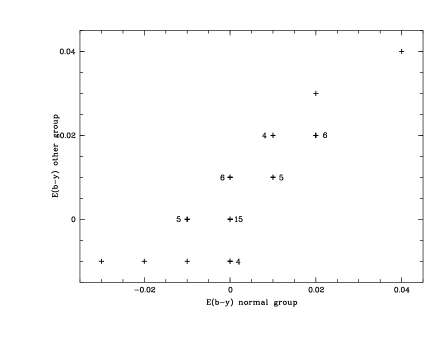
From our sample of A0V stars we have 28 stars with 2.869 2.880 and 22 stars in the range 2.880 2.890. For each selection of stars we computed , twice, that is in each group: early and intermediate. The results are displayed on Figs. 1 and 2. For the stars which normally belong to the early group the computations in the intermediate group give a difference ranging between -70 K and 80 K. For the stars which normally belong to the intermediate group the computations in the early group give a difference ranging between -160 K and 60 K. The effect on the colour excess E(b-y) is at most of (Fig. 3).
5 Comparison between and determined from uvby and Geneva Photometry
Since there is no programme to compute independently the colour excess in the Geneva photometric system, we have compared the and values only for stars with no reddening. We consider, as above, normal A0V stars from the BSC, but with a further restriction such as : E(b-y) . There are slightly more than 140 objects. For both photometric calibrations the parameters were computed using E(b-y)=0.
We note (see Fig. 4) that the values of computed with the MD calibration are systematically higher than those derived from the Geneva photometry calibration by Künzli et al. (1997). The mean value of the difference between these two is -70K with a rms of 137K.
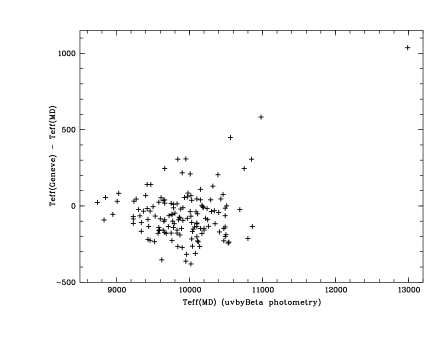
There is also a small systematic effect on the determination: for the value from Geneva photometry is higher than that from the MD calibration of uvby colours and it is the reverse for .
6 Analysis of the spectroscopic observations
We had spectra at a resolution of 28000 for slightly more than
70 stars, most of them being classified A0V and the few remaining ones having a
luminosity class IV or III, or no luminosity class at all.
The reduction of the spectra was done as described by
Burnage & Gerbaldi (1990, 1992).
Synthetic spectra were computed using the Kurucz solar-abundance models (1993),
and for the atmospheric parameters as computed by the MD programme.
A careful comparison of the synthetic and the observed spectra allows us to
detect a small number of:
hot Am star
shell star
stars with distorded line profiles which are obviously a
signature of
binarity.
After such a selection we find that
about half of the stars in the original sample can be considered normal A0
dwarf stars.
It is striking to note how many binary stars with similar components have been found from this spectroscopic survey.
7 Conclusion : the HR diagram
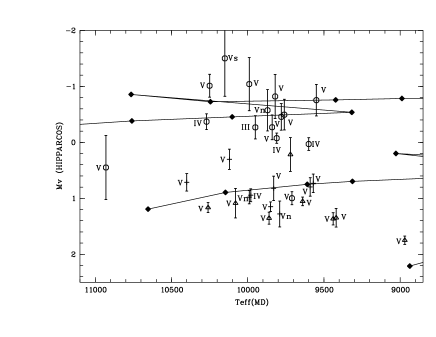
With the subsample of normal stars selected above, we have plotted the HR diagram (Fig. 5). In abscissa, is that from the MD calibration, and is derived from the HIPPARCOS parallax data. We remark that there is no direct relation between the luminosity class given by the MK classification and the value; stars belonging to luminosity class V cover a broad range of . The evolutionary tracks by Claret & Giménez (1992) are overplotted on this diagram.
The spread on Fig. 5 points out the difficulty to calibrate the spectral type A0 and luminosity class V in terms of . This spread is so large that it prevents the detection of binaries simply from an anomalous position in the HR diagram of stars for which only the spectral classification is known.
References
- 1 Balona, L.: 1994, Mon. Not. R. Astron. Soc., 268, 119
- 2 Blackwell, D.E., Petford, A.D., Shallis, M.J. et al.: 1980, Astron. Astrophys., 82, 249
- 3 Booth, A.J.: 1997, IAU Symposium 189, eds. T.R. Bedding et al., Kluwer, 147
- 4 Burnage, R. and Gerbaldi, M.: 1990, 2nd ESO/ST-ECF Data Analysis Workshop, eds. D. Baade, P. Grosbol, ESO Garching, 137
- 5 Burnage, R. and Gerbaldi, M.: 1992, 4nd ESO/ST-ECF Data Analysis Workshop, eds. P. Grosbol, R.C.E. de Ruijsscher, ESO Garching, 159
- 6 Castelli, F.: 1991, Astron. Astrophys., 251, 106
- 7 Claret, A., Giménez, A.: 1992, Astron. Astrophys., Suppl. Ser., 96, 255
- 8 Code, A.D., Davis, J., Bless, R.C., Hanbury-Brown, R.: 1976, Astrophys. J, 203, 417
- 9 Gerbaldi, M., Mayor, M.: 1989, The Messenger, 56, 12
- 10 Gerbaldi, M., et al.: 1997, Highlight in Astronomy, 23rd GA of the IAU, JD16, in press
- 11 Grosbol P.: 1978, Astron. Astrophys., Suppl. Ser., 32, 409
- 12 Hanbury-Brown, R., Davis, J., Allen, L.R.: 1974, Mon. Not. R. Astron. Soc., 167, 121
- 13 Hilditch, R.W., Hill, G., Barnes, J.V.: 1983,Mon. Not. R. Astron. Soc., 204, 241
- 14 Jordi, C., Masana, E. et al.: 1997, Astron. Astrophys., Suppl. Ser., 123, 83
- 15 Künzli, M., North, P. et al.: 1997, Astron. Astrophys., Suppl. Ser., 122, 51
- 16 Kurucz, R.L.: 1979, Astrophys. J., Suppl. Ser., 40, 1
- 17 Kurucz, R.L.: 1993, CD-Rom 18
- 18 Mégessier, C.:1994, Astron. Astrophys., 289, 202
- 19 Mégessier, C.:1995, Astron. Astrophys., 296, 771
- 20 Mégessier, C.:1997a, IAU Symposium 189, eds. T.R. Bedding et al., Kluwer, 61
- 21 Mégessier, C.:1997b, IAU Symposium 189, eds. T.R. Bedding et al., Kluwer, 153
- 22 Moon, T.T.: 1985, Comm. from the Univ. of London Obs., 78 and Revision in: 1985, Private Communication
- 23 Moon, T.T., Dworetsky, M.M.: 1985, Mon. Not. R. Astron. Soc., 217, 305
- 24 Napiwotzki, R., Schönberner, D., Wenske, W.: 1993, Astron. Astrophys., 268, 653
- 25 Philip, A.G.D., Relyea, L.J.: 1979, Astron. J., 84, 1743
- 26 Relyea, L.J., Kurucz, R.L.: 1978, Astrophys. J., Suppl. Ser., 37, 45
- 27 Schmidt, E.G.: 1979, Astron. J., 84, 1739
- 28 Smalley, B., Dworetsky, M.M.: 1995, Astron. Astrophys., 293, 446