CP stars: Photometric calibrations of luminosity using Hipparcos data
Abstract
The application of the Strömgren photometric luminosity calibrations to different types of CP stars is reexamined in the light of the new Hipparcos data. A first attempt is made to use the LM statistical parallax method (Luri et al., 1996) – based on the maximum likelihood principle – to obtain a calibration of the absolute magnitude as a function of two Strömgren colour indices, thus reflecting effective temperature and evolution. Its application to a sample of Si stars and to a sample of normal main sequence stars in the same spectral range allows us to compare the calibrations obtained and to discuss the position of Si stars in the HR diagram. Additionally, a sample of bonafide, spectroscopically selected Am stars together with normal main sequence stars are used to derive a new absolute magnitude calibration for late A-type main sequence stars, taking into account the effects of evolution, metallicity and stellar rotation.
Key words: Stars: chemically peculiar – Stars: fundamental parameters – Stars: early type – Stars: distances
1 Introduction
To deal with luminosity calibrations and to obtain a good exploitation of the high precision parallax data obtained by Hipparcos, it is required to use both, robust statistical methods, capable to take into account physical characteristics of stars (i.e. evolution, metallicity, rotational effects, etc.), and a well defined spectroscopic sample. Taking advantage of the fact that Strömgren photometry has proved to be a powerful tool for characterizing the physics of main sequence early type stars, some preliminary work is presented here for application to Si and Am stars.
Our sample contains all CP stars included in the Hipparcos Catalogue (ESA, 1997) having good spectroscopic information on peculiarity and complete Strömgren photometry in the Hauck and Mermilliod (1996) compilation. The selection of the stars according to their spectral types is fully explained in Gómez et al. (1998, this colloquium). For comparison, a sample of normal main sequence stars in the range B0-A9 V, selected from the Hipparcos Survey (Gómez et al., 1997), has been also used. Table1 shows the stars in each CP group (the sample is reduced to less than 50 % when Strömgren photometry is required).
| Selection from | with | Range of | |
|---|---|---|---|
| Gómez et al. (1997a) | Hauck & Mermilliod | SP | |
| (1996) | |||
| Si | 440 | 173 | B5-A3 |
| HgMn | 76 | 69 | B7-A0 |
| Sr-Cr-Eu | 378 | 172 | B8-A9 |
| Am | 1059 | 533 | A0-A9 |
| Normal B0-A9 V | 3460 | 1589 | B0-A9 |
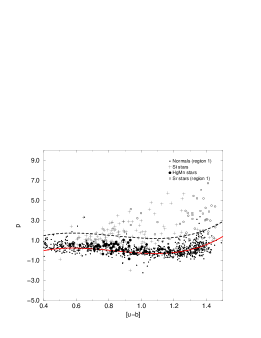
Using the different samples, a test of the capability of the system to detect CP stars has been performed. The plane has been classically accepted as the most discriminant plane in the Strömgren system to separate CP from normal stars. Thus for example, Crawford (1979) established the criterion to separate Am stars from A3-A9 normal main sequence stars. In contrast to Abt (1984), who concluded that about 75 % of the Am stars could be photometrically classified as such, we obtain that only 55 % of the classical Am (Sp(k)-Sp(m) 5) and 33 % of the proto-Am (Sp(k) - Sp(m) 5) can be detected using only Strömgren colours. Philip et al (1976) criteria -0.040) to detect hot CP stars is found to be unable to acomplish the objective (only 2 % of Si stars and 5 % of Sr stars has been detected). Taking into account that peculiar spectral features alter all Strömgren indices, Masana et al. (1998) established a new criterion of detection defining a parameter – a linear combination of several indices obtained through Multiple Discriminant Analysis. Applying this criterion to the hot stars in the present sample (see Figure1) we photometrically classify as peculiar 31 % of the Si stars and 56 % of hot Sr-Cr-Eu stars, whereas no HgMn star is detected. Furthermore, as indicated by Masana et al. (1998), the reddening decreases , so reddened hot CP stars may be seen as non-reddened normal stars, thus decreasing its capability for detection. We can conclude that the Strömgren system is suitable but less powerful for a photometric detection of peculiarities than the system (Maitzen, 1976; specifically designed to measure characteristic features on the spectra of peculiar stars) or even the combination of the Geneva indices (Masana et al., 1998).
A crucial point to attack the problem of the calibration of CP stars is the reddening correction. For CP2 stars, the peculiarities in the spectra result in bluer colour indices, the and indices being smaller, thus leading to underestimate their reddening when treating them as normal stars. In agreement with Adelman (1980) and Maitzen (1980), Masana et al. (1998) derived a correction to the obtained when using standard relations valid for normal stars as a function of the parameter (). Even applying this correction to the stars with , we obtain that 57 % of Si stars and 38 % of Sr-Cr-Eu (early region) stars have , compared with only 9 % of normal main sequence stars in the same spectral range with negative excess (using Crawford’s (1978) standard relations).
The problem is maintained in the intermediate region (Grosbøl’s (1978) standard relation): 56% of Sr-Cr-Eu stars have negative excess compared to 37 % of normal main sequence stars. In the late region (A3-A9), where Crawford’s (1979) standard relation is considered, the overestimation of reddening is also clear for Sr-Cr-Eu (18 % with compared with 37% for normal stars). The same excess distribution is obtained for Am and normal A3-A9 stars (35 % and 37 % of stars with respectively). Having in mind these biased photometric reddening determinations when peculiarities are present, we preferred to use the interstellar absorption model by Arenou et al. (1992) in the LM method, which gives reddening corrections as a function of the star position . Improvement of the interstellar absorption models using the new Hipparcos data is needed.
2 Testing the current available Mv photometric calibrations
The photometric distances computed following the algorithms of Crawford (1978), Balona & Shobbrook (1984), Jakobsen (1985) and Eggen (1974) for the stars belonging to the early region, are compared in Table2 with the distances derived directly from Hipparcos parallaxes for Si, Hg-Mn and Sr-Cr-Eu stars as well as for B4-B9 V normal stars. Only stars with good parallax, , have been used. All these
| Early Region | ||||
|---|---|---|---|---|
| Calibration | Si | Hg-Mn | Sr-Cr-Eu | B4-B9 V |
| hot | normal | |||
| (107 *) | (67 *) | (47 *) | (361 *) | |
| Crawford (1978) | -16 67 | +3 48 | +6 40 | +1 60 |
| Balona & Shobbrook (1984) | -28 84 | +0 50 | +3 48 | -1 60 |
| Jakobsen (1985) | -15 65 | -4 51 | -14 55 | -5 61 |
| Eggen (1974) | -61 97 | -19 69 | ||
| Intermediate and late Regions | ||||
| Calibration | Sr-Cr-Eu | Sr-Cr-Eu | A0-A2 V | A3-A9 V |
| intermediate | late | normal | normal | |
| (26 *) | (36 *) | (338 *) | (376 *) | |
| Strömgren (1966) | +23 43 | +6 31 | ||
| Guthrie (1987) | +62 84 | +10 38 | ||
algorithms, based on normal main sequence stars, rely on the fact that the index is primarily a function of luminosity and that and are related to temperature in the early region. As the index of CP2 stars falls below those of normal stars for a given spectral type (Preston, 1974), systematic trends in the derivation can be present when using the calibrations by Crawford (1978), Balona & Shobbrook (1984) and Jakobsen (1985). Napiwotzki et al. (1993) and Mégessier (1988) pointed out that the index is slightly more sensitive to temperature than and can be accepted as a good indicator of temperature for Si stars. Eggen (1974) used this index but his calibration shows strong systematic trends. On the other hand, the index is also affected by the peculiarities in the spectra, as pointed out by Hauck (1975).
From Table2 we see that, due to the above-mentioned effects and to the underestimation of reddening (when computed using Strömgren photometry), the photometric distances of Si stars have always been overestimated. No significant differences are found neither for Hg-Mn stars (as pointed out by Strömgren (1966) these stars behave as normal stars as far as the , and indices are concerned) nor for B4-B9 V normal stars. The standard deviation obtained ( 60 pc for normal stars) agrees with a relative error in photometric distances of about 30%.
Although the intermediate and late regions contain few Sr-Cr-Eu stars, Table2 shows that the photometric distances are underestimated when classical calibrations for normal stars are used. Again, the overestimation of reddening for these stars can contribute to this effect.
3 A new calibration for Si stars using the LM method
The LM (Luri et al., 1996), based on the Maximum Likelihood principle, allows a simultaneous determination of a luminosity calibration, kinematical characteristics and spatial distribution of a given sample. In a different approach that the one presented by Gómez el al. (1997a) in this colloquium, we undertake a derivation of a calibration of absolute magnitude of Si stars and B4-B9 V normal main sequence stars by parametrizing as a linear combination of Strömgren colour indices (), the observational entries being then (). No selection function for colours is imposed (), and an asymmetrical gaussian distribution of around a maximum () colour index is modelled. For a fixed value of , a gaussian distribution for is assumed:
| (1) |
and as a first attempt we consider the dependence of on the effective temperature:
| (2) |
and are simultaneously determined together with the absolute magnitude dispersion () , the parameters defining the velocity ellipsoid (mean and dispersions ()) and the scale height (). We use the index as explained above and a logarithmic function allowing us to solve the non-linearity of the main-sequence in this spectral range (Balona and Shobbrook, 1984). The method, able to identify and characterize distinct physical groups in inhomogeneous samples, has been applied considering the presence of two groups. Results for Si stars indicate the existence of a main group (containing 98 % of the sample) and a secondary group (2%) probably composed of misclassified objects and/or high velocity stars. Approximately the same percentage of classification is obtained when normal stars are considered. The relations obtained for the main groups are: for normal B4-B9 V (416 stars) and for Si stars (149 stars).
One of the major advantages of the Strömgren system, compared with other photometric systems for early type stars, is its capacity to account for evolutionary effects through the index. A first attempt was made to incorporate directly in equation(2) a term depending on but the high correlation between and did not allow to obtain stable values for the coefficients. As a preliminary attempt we have applied the LM method in two steps: once the LM algorithm has been applied using equation(2), we seek for a second solution considering:
| (3) |
For the main group (98 % of stars) the following relations have been obtained:
| (4) |
for normal B4-B9 V (416 stars), with mag (in the 1rst step : 0.70 mag), = (-12,-15, -7) km/s, = (9,11,5) km/s, = 63 pc, and
| (5) |
for Si stars (149 stars), with mag (in the 1srt step : 0.83 mag), = (-15,-15, -8) km/s, = (9,10,6) km/s, = 66 pc.

Relations (4) and (5), plotted in figure2 for different values, are defined for the whole population, so the mean relations are corrected for the Malmquist bias which is present in the samples used, which are limited by apparent magnitude. We can see a different behaviour of the index as indicator of luminosity for normal and Si stars, the differences being more pronounced when decreasing the effective temperatures. Nonetheless, from the position of individual stars in the HR diagram computed with this solution, we can conclude that the evolutionary state of Si stars is nearly the same as that of normal main sequence stars. More work will be devoted in the near future to finding, through Principal Component Analysis, a suitable proper combination of colour indices that could allow a simultaneous determination of all the parameters using the LM method.
4 A new calibration for Am stars using the BCES method
A different statistical treatment is used for the determination of the luminosity calibration in the late Strömgren’s region, taking into account the dependence of on effective temperature, evolution, metallicity and rotation. BCES fitting algorithm (Bivariate Correlated Errors and intrinsic Scatter, Akritas & Bershady, 1996) is an extension of the ordinary least squares estimator for two variables. It allows the consideration of measurement errors on both variables and the use of correlated errors between them, and also takes into account unknown intrinsic scatter and the possibility that the size of the measurement error depends on the variables.
This algorithm has been applied to a carefully selected sample of 97 Am stars (North et al., 1997) and very accurate Hipparcos trigonometric parallaxes (). The photometric data has been taken from Hauck and Mermilliod (1996) and the projected rotational velocity from Abt and Morrell (1995). Individual correction for binarity has been applied whenever possible (30 % of the sample) and a mean correction of 0.2 mag for SB1 binaries and stars with variable radial velocity has been considered, leaving 29 stars without correction. No correction for interstellar absorption has been applied, after realizing that it is meaningless when comparing it with the uncertainties in the binarity correction, and considering that the computed using Crawford’s (1979) standard relation is distributed around a mean value of 0.0014 mag.
To estimate the contribution of the stellar rotation and the blanketing effects (which are highly correlated in this spectral range) on the photometric calibration, it is necessary to have a large range of and . For this reason, the calibrations have been obtained by joinig to the sample of Am stars a sample of normal A3-A9 V stars carefully selected to be non-binaries and non-peculiar. The quality and source of its trigonometric parallaxes, photometry and is the same as for the Am stars.
An evaluation of the existing photometric calibrations of luminosity through their comparison with the Hipparcos data, allows us to conclude that Crawford’s (1979) calibration is systematically shifted by 4 in parallax () for Am stars, but shows no systematic trend for normal A3-A9 stars. The inclusion of and terms proposed by Guthrie (1987) reduces Crawford’s (1979) shift for Am stars but introduces a systematic deviation for A3-A9 normal stars.
The BCES algorithm has been applied to the sample of Am plus A3-A9
normal stars in an iterative procedure, taking into account all the
errors in the input parameters. The obtained calibration using
Hipparcos data is (Domingo, 1998):
The unweighted residuals obtained in are 0.25 mag for A3-A9 V normal stars and 0.36 mag for Am stars, smaller in all cases than for the existing photometric calibrations in this spectral region.
Acknowledgements. This work has been supported by CICYT under contract PB95-0180, and by the PICS program (CNRS PICS 348, CIRIT).
References
- 1 Abt, H.A.: 1984, Astrophys. J.285, 247
- 2 Abt, H.A., Morrell, N.I.: 1995, Astrophys. J., Suppl. Ser.99, 135
- 3 Adelman, S.J.: 1980, Astron. Astrophys.89, 149
- 4 Akritas, M.G., Bershady, M.A.: 1996, Astrophys. J.470, 706
- 5 Arenou, F., Grenon, M., Gómez, A.E.: 1992, Astron. Astrophys.258, 104
- 6 Balona, L.A., Shobbrook, R.R.: 1984, Mon. Not. R. Astron. Soc.211, 973
- 7 Crawford, D.L.: 1978, Astron. J.83, 48
- 8 Crawford, D.L.: 1979, Astron. J.84, 1858
- 9 Domingo, A.: 1998, Degree in Physics, Universidad de Barcelona
- 10 Eggen, O.J.: 1974, Publ. Astron. Soc. Pac.86, 241
- 11 ESA: 1997, in The Hipparcos and Tycho Catalogues, ESA SP-1200
- 12 Gómez et al.: 1998, these Proceedings, 171
- 13 Gómez, A.E., Luri, X., Mennessier, M.O., Torra, J., Figueras, F.: 1997, inHipparcos-Venice’97,
- 14 Astron. Astrophys., Suppl. Ser.32
- 15 Mon. Not. R. Astron. Soc.226
- 16 Physics of Ap Stars
- 17 private comm.
- 18 Ph. D. Thesis
- 19 Astron. Astrophys., Suppl. Ser.117
- 20 Astron. Astrophys.51
- 21 Astron. Astrophys.89
- 22 Astron. Astrophys., Suppl. Ser.
- 23 Astron. Astrophys., Suppl. Ser.72
- 24 Astron. Astrophys.268
- 25 Hipparcos-Venice’97
- 26 Dudley Obs. Reports
- 27 Ann. Rev. Astron. Astrophys.12
- 28 Ann. Rev. Astron. Astrophys.4