MULTIFREQUENCY AND IUE CAMPAIGNS ON BLAZARS
Abstract
The IUE contribution to the understanding of the blazar phenomenon has been
of fundamental importance. Here I review the progress obtained with
the latest multifrequency campaigns performed with IUE on two
prototype objects, the BL Lac PKS 2155 - 304 and the highly polarized,
superluminal quasar 3C 279.
Key words: ultraviolet; blazar continuum; blazar emission mechanisms; jets.
1. INTRODUCTION
The unique capabilities of IUE in spectrophotometric accuracy and UV sensitivity made it an essential tool in the study of variable X-ray sources. In particular for blazars it allowed to determine the shape of the non-thermal continuum in a region free of the possible contribution from a host galaxy and, together with coordinated optical and X-ray observations, made possible by the flexible scheduling, over a very wide spectral range. It is worthwhile to recall here that the first evidence of a sytematic difference in spectral shape between X-ray selected BL Lacs and other blazars and ”normal” quasars was obtained with IUE (Ghisellini et al. 1986). Systematic analyses of IUE data concerning blazar variability are presented by Treves and Girardi (1990), Edelson (1992), Pian and Treves (1993). Early results from blazar observations with IUE are reviewed in Bregman, Maraschi and Urry (1987).
It became clear after the results of the first pioneering studies that at least some of the sources were varying extremely rapidly also in the UV and that quasi - simultaneous snapshots of the UV to X-ray energy distribution could describe some average ”state” but were insufficient to probe the correlation between the two wavelength ranges. Simultaneous light curves in X-rays and UV and possibly other wavelengths were and are needed to address physical models of variability. In fact, despite the long lifetime of IUE well sampled multiwavelength data were obtained in a limited number of cases (see for reviews Wagner & Witzel 1995; Ulrich, Maraschi, & Urry 1997, UMU97 hereafter). Here I will discuss two sources for which many data have been obtained which are helping us to make progress in the understanding of the blazar phenomenon. The first is the BL Lac object PKS 2155-304, one of the brightest blazars in the UV and soft X-ray sky (Section 3). The second is the superluminal quasar 3C 279, the first and one of the brightest blazars detected in -rays (Section 4). Before discussing two apparently different cases I will briefly present a scheme for a unitary phenomenological and theoretical understanding of the non thermal emission of blazars.
2. A UNITARY VIEW OF THE BLAZAR PHENOMENON
The extreme properties of some radio loud AGN regarding rapid high amplitude variability implying ”strong” violations of the brightness temperature limit ( to avoid a Compton catastrophe) and/or of the efficiency limit ( erg s-2) led to the hypothesis that bulk relativistic effects were involved (Blandford & Rees 1978). Soon the idea was supported by the observation of superluminal motion and presently it is almost universally accepted that the continuum emission from blazars derives from a relativistic jet seen at small angle to its axis (e.g., Urry & Padovani 1995, UP95 hereafter). In practice all strong radio sources with flat radio spectra and core dominant morphologies are thought to be blazars.
The signature of ”thermal” emission in the form of broad emission lines and in very few cases of a UV bump are present in some blazars (flat spectrum radio quasars, FSRQ), while lineless objects, called BL Lacs, are usually considered as a separate class despite the similar (but not identical) continuum properties. A further subdivision within BL Lacs arose from the selection criterion, either in the radio or in the X-ray band (RBL –XBL). RBLs tend to have a much lower X-ray to radio flux ratio than XBL and the question is how representative are these samples with respect to the full population (e.g., UP95). A comparison of the radio to X-ray continua of XBL, RBL and flat spectrum radio quasars (FSRQ) (Sambruna et al. 1996) suggests that in all cases the radio to UV emission is synchrotron radiation. For XBL the X-ray continuum falls on the extrapolation of the optical UV continuum and is on average steeper, suggesting a synchrotron origin, while in FSRQ the X-ray spectrum is flatter and in excess of an extrapolation from lower frequencies, suggesting the onset of a different spectral component, most probably inverse Compton. From the point of view of the continuum shape RBL appear intermediate between XBL and FSRQ.
The recent discovery by EGRET on board the Compton Gamma-ray Observatory of -ray emission from blazars revealed that a substantial fraction and in many cases most of the power is emitted in this very high energy band, which therefore appears to play a fundamental role. It is important to ask whether the -ray emission is a general property of the whole blazar class or whether it differs in different objects and subclasses. We have recently addressed this problem (Fossati et al. 1997) collecting and studying multifrequency data (including -rays) for three complete samples of blazars: the 2 Jy sample of FSRQs (UP95, and references therein), the 1 Jy sample of BL Lac objects (Stickel, Meisenheimer, & Kühr 1994) and the sample of BL Lacs selected in the X-ray band from the Einstein Slew Survey (Perlman et al. 1996). Although the percentages of objects detected in -rays are not large and are different in different samples (40%, 26% and 17%, respectively) a consistent picture seems to emerge from the average spectral energy distributions (SED) as shown in Figure 1. In this figure all blazars in the three complete samples were merged and binned according to radio-luminosity irrespective of the original classification. The dashed lines derive from an analytic parametric approximation based on simple assumptions. The main results are the following:
-
for all luminosity classes the SEDs can be described by two quasiparabolic components and exhibit two broad peaks;
-
both peaks fall at lower frequencies for the higher luminosity objects;
-
the peak frequency of the higher energy component correlates with the peak frequency of the first one in such a way that their ratio could be constant, as was assumed for the dashed curves.
The dashed curves further assume that the peak luminosity of the second component is proportional to the 5 GHz radio luminosity.
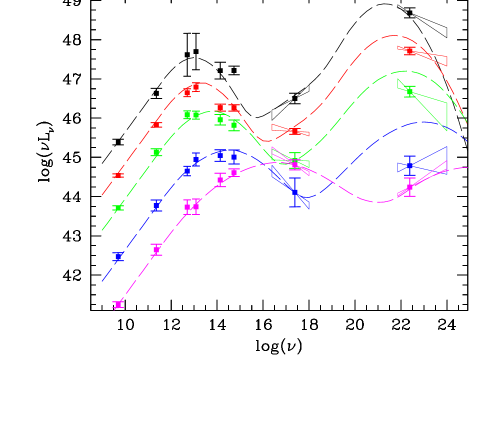
Although one should be aware that selection biases may affect the results (as discussed in Fossati et al. 1997), Figure 1 suggests that the SEDs of all blazars are globally similar and lie along a continuous spectral sequence. For the most luminous objects the first peak falls at frequencies lower than the optical band, while for the least luminous ones the reverse is true. Thus highly luminous objects have steep (”red”) optical-UV continua, while low luminosity objects with peak frequency beyond the UV range have flat (”blue”) optical-UV continua. For brevity I will refer to objects on the high and low luminosity end of the sequence as ”red” or ”blue” blazars.
It is generally thought that the first spectral component is due to synchrotron radiation. The spectra from the radio to the submillimeter range most likely involve superposed contributions from different regions of the jet with different self-absorption turnovers. From infrared (IR) frequencies upwards the synchrotron emission should be thin and could be produced in a single zone of the jet, allowing to adopt a homogeneous model. The high energy electrons emitting the thin synchrotron radiation could also produce the second spectral component (peaking in -rays) by upscattering soft photons via the inverse Compton process. The seed photons for upscattering could be the synchrotron photons themselves (synchrotron self Compton model, SSC) or photons outside the jet (external Compton model, EC) possibly produced in an accretion disk or torus and scattered or reprocessed by the surrounding gas (e.g., Sikora 1994; UMU97, and references therein).
If the same region is responsible for the two spectral components, irrespective of the nature of the seed photons, emission at the two peaks must derive from the same high energy electrons. Therefore a change in the density and/or spectrum of those electrons is expected to cause correlated variability at frequencies close to the two peaks. In the SSC model the inverse Compton intensity is expected to vary more than the synchrotron one (due to the same electrons), approximately as the square of it in the simplest case. In the EC model, if the seed photons outside the jet are not coupled to the jet emission, one expects a linear relation between the synchrotron and inverse Compton variation.
Measuring the two peaks simultaneously is thus an essential step for determining the physical parameters of the emission region and studying the variability of the spectra around the peaks yields unique insight into the mechanisms of particle acceleration and energy loss in the jet. The variability correlation should enable to disentangle the contribution of different sources of seed photons (SSC vs. EC).
The ”spectral sequence” discussed above could be attributed to a systematic dependence of the critical electron energy (the break energy) and/or the magnetic field or other properties of the jet on luminosity. Assuming that the beaming factors are not significantly different along the sequence, the trend in apparent luminosity is also a trend in intrinsic luminosity. In the SSC model the break energy of the electrons (those radiating at the peaks) is fixed by the ratio of the two peak frequencies and should therefore be approximately constant. ”Red” blazars should then have lower magnetic fields than ”blue” blazars. Systematic model fitting of all the -ray detected blazars with sufficient multifrequency data suggests that as the magnetic field decreases the external photon density becomes important so that a smooth transition between the SSC and EC scenario takes place.
For ”blue” blazars the UV range falls at frequencies lower than the synchrotron peak (to the left of it). Adopting a homogeneous model the UV emission is therefore attributed to synchrotron radiation by electrons of lower energy than those producing the X-rays (by the same mechanism).
For ”red” blazars the UV falls at frequencies higher than (to the right of) the synchrotron peak. Also in this case the UV emission should be due to the synchrotron mechanism, but it should derive from the highest energy electrons present. Rapid variability is therefore expected. On the contrary, for the same type of objects, X-rays should be attributed to inverse Compton of electrons of relatively lower energy, less rapidly variable.
Most of the known blazar phenomenology can be at least qualitatively understood in this scheme (e.g., UMU97). The multifrequency campaigns discussed below concern one ”blue” (PKS 2155-304) and one ”red” (3C 279) blazars.
3. PKS 2155-304
PKS 2155-304 is one of the brightest sources in the extragalactic sky at UV and soft X-ray wavelengths. As such it was repeatedly observed in many wavebands (Maraschi et al. 1986; Urry et al. 1988; Treves et al. 1989; Edelson et al. 1991). Two major intensive multiwavelength campaigns were organized on this source. The first was based on 5 days of quasicontinuous coverage with IUE and 3.5 days with ROSAT (Urry et al. 1993, Brinkmann et al. 1994, Edelson et al. 1995). The UV and X-ray light curves showed rapid variations of moderate amplitude () strongly correlated in the overlapping time intervals with the soft X-rays leading the UV variations by not more than 2-3 hours. Therefore variability was essentially ”achromatic”, that is independent of wavelength, ruling out an accretion disk as the origin of the UV continuum. Over the whole monitoring period of about 1 month the UV intensity increased by a factor 2, the same as observed in the optical and IR.
A second, longer campaign, with 10 days of IUE, 9 days of EUVE, 2 days of ASCA and three short ROSAT observations took place in May 1994 (Pesce et al. 1997, Pian et al. 1997, Urry et al. 1997). The light curves from this campaign are shown in Figure 2. The source cooperated nicely producing a well defined flare (factor 2.5) during the two days of ASCA observations which can be most plausibly related with the smaller amplitude intensity peaks (35 %) seen at later times in the EUVE and IUE light curves. The X-ray flare appears to lead the EUVE and UV events by 1 and 2 days respectively, an order of magnitude longer than the lag detected in the previous campaign. Within the ASCA data the 0.5 – 1 keV photons lagged the 2.2 – 10 keV photons by 1.5 hours.

Note how the UV light curve is well defined and how the differences between the LWP and SWP normalized fluxes are small, except for the initial extremely fast and deep minimum. This event is discussed in detail in Pian et al. (1997) and is not understood.
Despite the differences these two campaigns give the first evidence that the variations from 5 eV to 10 keV are correlated on short time scales and that high frequencies lead the lower ones. The flare event observed during the second campaign has characteristics as expected from the propagation of a shock wave along an inhomogeneous relativistic jet. The cause of the flare in this model is a propagating disturbance affecting different regions at different times.
However homogeneous models are perhaps more appealing as they can be strongly constrained by the data. The apparent progression of the X-ray flare to longer wavelengths rules out a stochastic acceleration process in the emitting region. It can possibly be explained by an ”instantaneous” injection of high energy particles near X-ray emitting energies and subsequent energy loss by synchrotron radiation in a homogeneous region. Interpreting the observed lags as radiative cooling times at the relevant energies yields a univocal value of the magnetic field B = 0.1 G. This rather low value of B requires a high value of the Doppler beaming factor () in order to avoid overproduction of -rays by the inverse Compton process. We recall however that the -ray flux was not measured simultaneously.
Although the case of PKS 2155-304 is the best studied from X-ray to UV frequencies, a closely similar behaviour was observed also in Mkn 421 (Macomb et al. 1995; Buckley et al. 1996; Takahashi et al. 1996). Much more extreme events, though probably related to similar physics were recently discovered in Mkn 501 (Pian et al. 1998a).
4. 3C 279
3C 279 () was the first blazar discovered by EGRET on board the Compton Gamma-Ray Observatory to emit strong and variable -rays (June 1991). This is a ”red” blazar where high energy electrons in a relativistic jet emit synchrotron radiation peaking between sub-mm and IR frequencies. Inverse Compton scattering of the same electrons off synchrotron photons in the jet (SSC) or on ”ambient” photons deriving from the disk or the broad line region (EC) is likely responsible for the emission at hard X- and -ray energies. Clarifying the nature of the seed photons for this mechanism would give us insight into the physical cause(s) of the huge amplitude variations exhibited by 3C 279 at the highest energies.
There have been several multi-wavelength observations of this blazar (Maraschi et al. 1994; Hartman et al. 1996; Wehrle et al. 1998). In particular, 3C 279 was monitored with IUE and ROSAT for three weeks between December 1992 and January 1993, simultaneously with -ray observations by EGRET, and with coordinated optical observations. At that epoch the intensity of 3C 279 was at a historical minimum at all measured wavelengths above the sub-mm ones. The variability amplitude with respect to the bright state of June 1991 increased with frequency from the IR to the UV. In fact it is possible that the residual UV emission contains a substantial contribution from an accretion disk (see Pian et al. 1998b). Regarding the second spectral component the variability amplitude was small in the soft (ROSAT) X-ray range but extremely large in -rays, larger than in any other waveband. This showed that the inverse Compton emission had varied much more than the synchrotron one, an effect expected in the SSC model. A similar behaviour could be reproduced in the EC model only if the ambient photons had varied in a correlated fashion with the electrons in the jet.
A second intensive multifrequency monitoring, based on a 3-week coordinated program involving CGRO, XTE and IUE observations, took place in Jan-Feb 1996 (Wehrle et al. 1998). A huge flare was observed in -rays and a similar but less extreme event was seen by XTE. The X and -ray peaks were simultaneous within the one day uncertainty. The IUE light curve at 2600 Å (Fig. 1c) is reasonably well sampled during the first part of the campaign but not toward the end, when the flare occurred and observations of 3C 279 were extended as Target of Opportunity. It shows a broad minimum at Jan 25-26 followed by a rise of almost a factor 2, but with a three day gap before and up to the -ray peak. Due to the faintness of the source and to the scattered light problem during the final stages of the IUE mission systematic errors may affect some of the IUE observations. Despite the non optimal sampling the IUE observations provide important constraints, as discussed below.

In Figure 3 the broad band energy distributions obtained at the flare peak and in a preflare state (1996, Jan 25-26) are compared with those of the discovery epoch (June 1991) and with the low state of Jan 1993. I also added new data obtained in 1997 including the X-ray spectrum measured by BeppoSAX, referring again to a rather low state.
Comparing the flare and preflare states it is clear that the high energy SED (X-ray to -ray) is harder at the flare peak, as implied by the larger amplitude of the -ray variation. From IR to UV frequencies the flare vs preflare variations are much smaller than in X-rays and -rays. This has important consequences for theoretical models, as the relative variability in the synchrotron and inverse Compton components can indicate the origin of the seed photons that may be upscattered to the -ray band. Between June 1991 and December 1992–January 1993, the -ray flux of 3C 279 varied approximately quadratically with respect to the optical flux change. This is expected in an SSC scenario (Maraschi, Ghisellini, & Celotti 1992), but is also consistent with the external Compton (EC) model (Sikora 1994), provided that the bulk Lorentz factor of the jet varied.
The amplitude of the -ray variation during the 1996 outburst (factor 10) is more than the square of the observed IR–optical flux change (factor ) which is a severe difficulty for both the SSC and EC scenarios. Two possible ways out are the following: i) different emission zones could contribute to the IR-optical flux, diluting the intrinsic variation associated with the -ray flaring region; ii) the synchrotron peak corresponding to the -ray peak may fall at frequencies lower than IR, where adequate variations could have occurred. Thus we cannot completely rule out the SSC scenario. Similar arguments apply for the ”standard” EC scenario.
An interesting alternative which could resolve the above problem is the ”relativistic mirror” model of Ghisellini and Madau (1996), combining advantages of both the SSC and EC models. Here the seed photons are provided by rapidly varying emission from a few clouds close to the jet and photoionized by an approaching active blob in it. First, the photoionizing continuum is beamed, and second, the electrons in the jet see emission from the nearest cloud(s) as beamed. Thus there can be a double-beaming effect, leading to a more-than-quadratic increase in -rays associated with variations in synchrotron emission from the active blob. The asymmetric shape of the X–ray curve, in which the decay seems faster than the rise, can be accommodated by the mirror model since the inverse Compton emission drops sharply once the active part of the jet passes the broad line cloud(s). The mirror model can be tested, even in the absence of any available -ray observations, by monitoring the Ly line of 3C 279. A limited number of clouds, over a limited velocity range, should respond to the most rapidly varying (days) jet emission. However the amplitude may be small, therefore accurate measurements are required as only possible with HST. The present limits on the variability of the Ly emission in 3C 279 (Koratkar et al. 1998; see also Pian et al. 1998b) are not stringent enough to constrain the model significantly.
IUE and -ray observations of 3C 279 were repeated practically every year since the -ray detection, including the two major campaigns discussed above. In Figure 4 we present a comparison of the long term UV and -ray light-curves. For simultaneous (within one day) IUE SWP and LWP observations, the UV flux at 2000 Å has been derived from a power-law fit of the dereddened spectrum in the 1200-3000 Å range (see Pian et al. 1998b;1998c). For isolated SWP and LWP observations (Koratkar et al. 1998; Pian et al. 1998c; Wehrle et al. 1998), the flux at 2000 Å has been extrapolated from the spectrum using a typical power-law spectral index () for high, medium, and low states of 3C 279, and for very low states (Pian et al. 1998b). The HST data are taken from Koratkar et al. (1998, see also Netzer et al. 1993; Wehrle et al. 1998). The figure clearly indicates that the two light curves are correlated. In Figure 5 we plot the UV fluxes (computed as detailed above) vs the -ray fluxes measured within one month. This confirms the correlation and shows that, at least on long timescales, the variability amplitude in the UV is smaller than that in -rays, but reasonably compatible with being the square root of it.


5. SUMMARY AND CONCLUSIONS
Multifrequency studies of blazars seem to lead to a unified view of the broad band continuum of the whole class. Two spectral components, each exhibiting a broad peak in the representation are present in all objects. The two peak frequencies are different in different objects but their ratio is approximately constant. Irrespective of subclassifications, the blazar continua may be described by a single spectral sequence whereby the values of the peak frequencies are fixed by the radio luminosity: higher luminosity objects peak at lower frequencies.
The overall regularity of the SEDs suggests that the same mechanisms (synchrotron and inverse Compton radiation) operate in all blazars, albeit under gradually different physical conditions. The magnetic field, the critical particle energy (corresponding to the maxima in the SED), the importance of ambient vs. synchrotron photons in the inverse Compton process may change gradually along the sequence (Ghisellini et al. 1997).
Multifrequency studies of objects at the ”blue” end of the sequence, like PKS 2155-304, revealed the evolution of synchrotron flares from X-rays to UV frequencies, indicating impulsive injection of high energy particles in the emission region. It is regrettable that IUE did not survive long enough to contribute to multifrequency campaigns including TeV observations, which only recently yielded positive detections of the brightest ”blue” blazars.
For the ”red” blazar 3C 279 multifrequency observations have shown a clear long term correlation of the UV emission (due to the synchrotron process) with the -ray emission (due to the inverse Compton mechanism) thus providing strong support to the idea that the two spectral components derive from the same population of relativistic electrons. The short time-scale variability requires either a highly non linear variation of the seed photons during a flare or dilution of the synchrotron flare by more stationary synchrotron emission from adjacent regions in the jet.
ACKNOWLEDGEMENTS
I thank Elena Pian for allowing the presentation of results in advance of publication and for help in the preparation of the manuscript.
References
- \astronciteBlandford & Rees1978 Blandford, R. D., & Rees, M. J. 1978, in Pittsburgh Conference on BL Lac Objects, ed. A. M. Wolfe, (U. of Pittsburgh), p. 328
- \astronciteBregman et al.1987 Bregman. J. N., Maraschi, L., & Urry, C. M. 1987, in Scientific Accomplishments of IUE, ed. Y. Kondo (Dordrecht: Reidel), p. 685
- \astronciteBrinkmann et al.1994 Brinkmann, W., et al. 1994, A&A, 288, 433
- \astronciteBuckley et al.1996 Buckley, J. H., et al. 1996, ApJ, 472, L9
- \astronciteEdelson et al.1991 Edelson, R. A., et al. 1991, ApJ, 372, L9
- \astronciteEdelson1992 Edelson, R. A. 1992, ApJ, 401, 516
- \astronciteEdelson et al.1995 Edelson, R. A., et al. 1995, ApJ, 438, 120
- \astronciteFossati et al.1997 Fossati, G., et al. 1997, MNRAS, submitted
- \astronciteGhisellini et al.1986 Ghisellini, G., Maraschi, L., Tanzi, E. G., & Treves, A. 1986, ApJ, 310, 317
- \astronciteGhisellini & Madau1996 Ghisellini, G., & Madau, P. 1996, MNRAS, 280, 67
- \astronciteGhisellini et al.1997 Ghisellini, G., et al. 1997, MNRAS, submitted
- \astronciteHartman et al.1996 Hartman, R. C., et al. 1996, ApJ, 461, 698
- \astronciteKoratkar et al.1998 Koratkar, A., Pian, E., Urry, C. M., & Pesce, J. E. 1998, ApJ, 492, 173
- \astronciteMacomb et al.1995 Macomb, D. J., et al. 1995, ApJ, 449, L99
- \astronciteMaraschi et al.1986 Maraschi, L., Tagliaferri, G., Tanzi, E. G., & Treves, A. 1986, ApJ, 304, 637
- \astronciteMaraschi et al.1992 Maraschi, L., Ghisellini, G., & Celotti, A. 1992, ApJ, 397, L5
- \astronciteMaraschi et al.1994 Maraschi, L., et al. 1994, ApJ, 435, L91
- \astronciteNetzer et al.1993 Netzer, H., et al. 1993, ApJ, 430, 191
- \astroncitePerlman et al.1996 Perlman, E. S., et al. 1996, ApJ, 456, 451
- \astroncitePesce et al.1997 Pesce, J. E., et al. 1997, ApJ, 486, 770
- \astroncitePian & Treves1993 Pian, E., & Treves, A. 1993, ApJ, 416, 130
- \astroncitePian et al.1997 Pian, E., et al. 1997, ApJ, 486, 784
- \astroncitePian et al.1998 Pian, E., et al. 1998a, ApJ, ApJ, 492, L17
- \astroncitePian et al.1998 Pian, E., et al. 1998b, this Volume
- \astroncitePian et al.1998 Pian, E., et al. 1998c, in preparation
- \astronciteSambruna et al.1996 Sambruna, R. M., Maraschi, L., & Urry, C. M. 1996, ApJ, 463, 444
- \astronciteSikora1994 Sikora, M. 1994, ApJS, 90, 923
- \astronciteStickel et al.1994 Stickel, M., Meisenheimer, K., & Kühr, H. 1994, A&AS, 105, 211
- \astronciteTakahashi et al.1996 Takahashi, T., et al. 1996, ApJ, 470, L89
- \astronciteTreves et al.1989 Treves, A., et al. 1989, ApJ, 341, 733
- \astronciteTreves et al.1989 Treves, A., & Girardi, E. 1990, in Variability of Active Galaxies, ed. W. J. Duschl, S. J. Wagner, and M. Camenzind, Lecture Notes in Physics, 377 (Springer Verlag: Berlin), p. 175
- \astronciteUlrich et al.1998 Ulrich, M.-H., Maraschi, L., & Urry, C. M. 1997, ARA&A, 35, 445 (UMU97)
- \astronciteUrry & Padovani1995 Urry, C. M., & Padovani, P. 1995, PASP, 107, 803 (UP95)
- \astronciteUrry et al.1988 Urry, C. M., Kondo, Y., Hackney, K. R. H., & Hackney, R. L. 1988, ApJ, 330, 791
- \astronciteUrry et al.1993 Urry, C. M., et al. 1993, ApJ, 411, 614
- \astronciteUrry et al.1997 Urry, C. M., et al. 1997, ApJ, 486, 799
- \astronciteWagner & Witzel1995 Wagner, S. J., & Witzel, A. 1995, ARA&A, 33, 163
- \astronciteWehrle et al.1998 Wehrle, A. E., et al. 1998, ApJ, in press (astro-ph/9711243)