Radio Properties
of the Shapley Concentration.
II. J13243138: a remnant of a radio galaxy
in the Abell cluster A3556?
Abstract
In this paper we present a detailed study of the radio galaxy J13243138, located at a projected distance of 2′ from the centre of the Abell cluster of galaxies A3556, belonging to the core of the Shapley Concentration, at an average redshift z=0.05. We have observed J13243138 over a wide range of frequencies: at 327 MHz (VLA), at 843 MHz (MOST), and at 1376 MHz, 2382 MHz, 4790 MHz and 8640 MHz (ATCA).
Our analysis suggests that J13243138 is a remnant of a tailed radio galaxy, in which the nuclear engine has switched off and the radio source is now at a late stage of its evolution, confined by the intracluster gas. The radio galaxy is not in pressure equilibrium with the external medium, as it is often found for extended radio sources in clusters of galaxies. We favour the hypothesis that the lack of observed polarised radio emission in the source is due to Faraday rotation by a foreground screen, i.e. the source is seen through a dense cluster gas, characterised by a random magnetic field.
An implication of the head-tail nature of the source is that J13243138 is moving away from the core of A3556 and that possibly a major merging event between the core of A3556 and the subgroup hosting J13243138 has already taken place.
keywords:
galaxies– clusters– individuals: Abell 3556– J132431381 Extended radio sources in clusters of galaxies and J13243138
Extended radio emission associated with galaxies in clusters is often characterised by morphologies which reflect the interaction between the radio emitting plasma and the local environment in the cluster. Head-tail sources are usually associated with non-dominant cluster galaxies moving at a considerable speed within the cluster. Their morphologies are then explained as the result of ram pressure exerted by the intergalactic medium on the double sided radio emission (see for example O’Dea & Owen 1985a and 1985b, and Owen 1996, for a recent review). Wide-angle tail radio galaxies, on the other hand, are more difficult to account for with the above mentioned model, since they are usually associated with massive and dominant cluster galaxies, with much lower peculiar velocities with respect to the cluster mean. Beyond ram pressure, it is now accepted that large flows of hot gas could provide a wind within clusters of galaxies able to bend straight jets into wide-angle tail morphologies (Owen 1996 and references therein).
The study of extended galaxies in clusters is important for a variety of reasons. The morphology and the direction of the extension may give important information on the dynamics of the galaxy, such as, for example, the direction of the motion projected on the plane of the sky. Furthermore, the non-thermal pressure in the tails of radio emission can be compared to the thermal pressure exerted by the intracluster gas, in those cases where X-ray data are available to provide estimates of the temperature and pressure. This is crucial for studying the interaction between the radio emission and the external gas, and for deriving information on the evolution of radio sources in clusters of galaxies, as well as the influence of the cluster dynamics (such as, for example, merging processes) on the radio properties of the cluster. Last but not least, the observed polarisation properties of the radio emission may give information on the intracluster magnetic field and its structure.
In this paper we present a detailed study of the extended radio galaxy J13243138 (RA, DEC), located in the central region of the Abell cluster A3556. It was first observed in a radio survey of the clusters of galaxies in the Shapley Concentration core carried out at 843 MHz with the Molonglo Observatory Synthesis Telescope (MOST) and at 1376 MHz with the Australia Telescope Compact Array (ATCA) (Venturi et al. 1997, hereinafter Paper I). This work is part of a larger project whose aim is to study the radio/optical properties of the clusters in the core of the Shapley Concentration, in particular the chain formed by A3556-A3558-A3562 (Venturi et al. 1998), both from a statistical point of view and through a detailed analysis of the physical properties of the extended radio galaxies in these clusters.
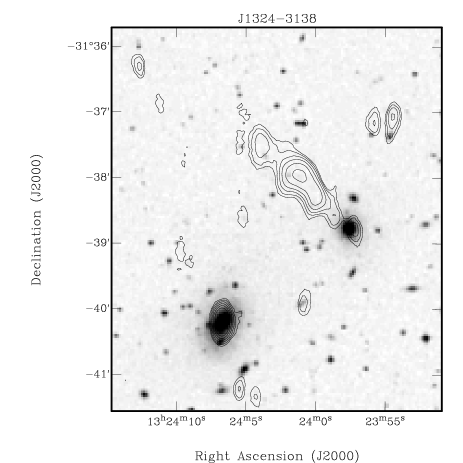
In Figure 1 the superposition of the radio isophotes on the Digitised Sky Survey shows that the radio component located at the south west extremity of the extended radio emission is coincident with the nucleus of the 15.6 magnitude galaxy #5975 in the COSMOS catalogue (RAJ2000 = , DECJ2000 = ). Its radial velocity velocity v = 15054 km s-1 (Stein 1996) establishes that it belongs to A3556 ( km s-1, Bardelli et al. 1998). This, coupled with the fact that only a few very faint optical objects fall within the envelope of the radio emission, led us to the conclusion that J13243138 is an extended, possibly head-tail, radio galaxy located in the vicinity of the cluster centre (see Paper I).
In Section 2 we present the observational data. In Section 3 the morphology of the source is described and analysed, and in Section 4 a detailed study of the synchrotron spectrum is carried out. The nature of the source, its relation to the cluster of galaxies A3556 and its implications for cluster merging and formation is discussed in Section 5.
Throughout the paper we use a Hubble constant of H0 = 100 km s-1Mpc-1. At the redshift of the cluster this implies that 1′′ = 0.67 kpc.
2 Radio observations, data reduction and images
| Date | Frequency | Array | Configuration | u-v range | Time | HPBW |
|---|---|---|---|---|---|---|
| MHz | m | hr | ′′ | |||
| 26-Jan-96 | 327 | VLA | CnB | 46 - 2760 | 3 | |
| 24-Mar-92 | 843 | MOST | 15 - 1571 | 12 | ||
| 15-May-92 | 843 | MOST | 15 - 1571 | 12 | ||
| 24-Sep-94 | 1376 | ATCA | 1.5D | 107 - 1439 | 12 | |
| 02-Oct-94 | 1376 | ATCA | 6C | 153 - 6000 | 12 | |
| 03-Jan-95 | 1376 | ATCA | 6A | 337 - 5939 | 12 | |
| 03-Jan-95 | 2382 | ATCA | 6A | 337 - 5939 | 12 | |
| 01-Mar-96 | 4790 | ATCA | 1.5B | 31 - 1286 | 12 | |
| 22-Apr-96 | 4790 | ATCA | 375 | 31 - 459 | 12 | |
| 01-Mar-96 | 8640 | ATCA | 1.5B | 31 - 1286 | 12 | |
| 22-Apr-96 | 8640 | ATCA | 375 | 31 - 459 | 12 |
We have observed J13243138 over a wide range of radio frequencies, from 327 MHz (91.7 cm) to 8640 MHz (3.5 cm) with various arrays. The logs of the observations and the arrays used are summarised in Table 1. All flux density values given in the figure captions and in Table 2 are corrected for the primary beam attenuation and were computed by means of the task TVSTAT in AIPS. Uncertainties in the flux density measurements are of the order of few percent at all frequencies.
2.1 VLA observations at 327 MHz
Observations at 327 MHz were carried out with the VLA in the hybrid CnB configuration. The field of view of the present observations has a radius of , centred on J13243138 itself. J1316336 and 3C286 were used as phase and amplitude VLA calibrators respectively. The data reduction was carried out using the standard procedure (calibration, Fourier inversion, clean and restore) of the AIPS package. Contour plots of the final image are given in Figure 2 and details of the image are given in the figure caption.

2.2 MOST observations at 843 MHz
For details concerning these observations and data reduction we refer to Paper I, where these data were first presented. In Table 1 the log of the observations is reported. Contour plots of the MOST image are given in Figure 3 and details of the image are given in the figure caption.

2.3 ATCA observations at 1376 MHz and 2382 MHz
J13243138 was observed at these two frequencies as part of a larger project, whose aim was to image and study the whole A3556 region (Paper I). The source was observed with three array configurations, 1.5D, 6A and 6C, which differ in the minimum and maximum baseline length (see Table 1). The data were combined after calibration in order to increase the sensitivity. We refer to Paper I for details concerning the observing strategy and data reduction. Here we present images of J13243138 at 1376 MHz at increasing resolution (Figures 4a and 4b) and at 2382 MHz (Figure 5). Details of the images are given in the figure captions.


2.4 ATCA observations at 4790 MHz and 8640 MHz
We observed J13243138 with the Australia Telescope Compact Array (ATCA) simultaneously at 4790 MHz and 8640 MHz for 12 hours using the two array configurations 1.5B and 375m (see Table 1), with an observing bandwidth of 128 MHz at each frequency. The data were reduced by means of the MIRIAD software (Sault, Teuben & Wright 1995), which minimises bandwidth smearing effects, since it allows a large number of channels to be handled separately. Data taken with the two different array configurations were analysed independently at each frequency, and were subsequently combined in order to increase the sensitivity.
We used B1327311 as amplitude calibrator at both frequencies. Its assumed flux is 0.63 Jy and 0.56 Jy respectively at 4790 MHz and 8640 MHz.
The final combined datasets were then transferred to the AIPS package and the final images were obtained by means of the task IMAGR. The images obtained with natural and uniform weighting are given in Figures 6a-b and 7a-b at 4790 MHz and 8640 MHz respectively. Details of the images are given in the figure captions.


2.5 Polarisation information
Using the final ATCA data sets at all frequencies we made full resolution images in the U and Q Stokes parameters, in order to image the polarised emission. No polarised emission above the noise level was detected from the source. Integrating the flux density on the polarisation images over the same area covered by the source in the total intensity ones, we derive a limit on the polarisation which ranges from a few percent (up to 4%) at 1376 MHz and 4790 MHz to 15% at 8640 MHz.
3 The radio morphology
Inspection of figures 2 to 7 shows that the appearance of J13243138 changes markedly at different frequencies and resolutions. The source is barely elongated in the north-east direction at 327 MHz and 843 MHz, then the morphology becomes more diffuse and amorphous with increasing resolution and frequency. Our 327 MHz and 843 MHz images are in very good agreement with the 1.4 GHz NRAO VLA Sky Survey (NVSS) image of the source. From the 1376 MHz images we derived a projected linear extension is kpc. From the figures it is clear that the quality of the 2382 MHz image is lower than the other images, and this is essentially due to the poorer uv-coverage. At 2382 MHz we observed J13243138 only with the 6A array configuration, and the lack of short baselines is responsible for the knotty appearance of the source at this frequency.
As is clear from the images and from the flux density measurements (see figure captions), when the source is observed with enough resolution to be resolved into its various components (at frequencies higher than 1376 MHz in our set of observations) the total flux density is dominated by the extended emission located outside the optical galaxy. The southernmost component, coincident with the galaxy #5975, is resolved in all our images, and its emission becomes very faint and barely visible in our low resolution 8640 MHz map.
From our images we classify J13243138 as a head-tail radio galaxy. Its total radio power at the canonical frequency of 1.4 GHz is logP1.4GHz = 23.05 W Hz-1. The source therefore falls within the class of FRI (Fanaroff & Riley 1974), as usually found for head-tail radio sources. The properties of the core of the radio emission, whose power is logP1.4GHz = 21.75 W Hz-1, are presented in detail in Sect. 4.2.
Some diffuse and faint radio emission, located south of the optical galaxy, is visible in some of our images, in particular the 327 MHz VLA image (Fig. 2) and in the low resolution 1376 MHz and 4790 MHz images (Fig. 4a and Fig. 1 respectively). In the 327 MHz image the feature is elongated in the east-west direction, and possibly is a blending of sources containing also radio emission from the cD galaxy at the cluster centre. Inspection of the 4790 MHz image superimposed on the Digitised Sky Survey, showed that the radio emission located between the galaxy #5975 and the cD galaxy at the cluster centre has a faint optical counterpart, which is also visible in Figure 1. We therefore consider this emission unrelated to J13243138 and do not take it into account in the discussion.
4 4. Radio Spectrum
4.1 The integrated spectrum
Using the total flux density measurements reported in Table 2 we derived the total spectrum of J13243138 in the frequency range 327 MHz - 8640 MHz, shown in Figure 8. The spectrum is steep over the whole frequency range covered by our observations, but a single power law is a poor fit. We can fit a single power law from 843 MHz to 4790 MHz, with a spectral index (S), but the shape of the spectrum steepens at higher frequencies and tends to flatten below 843 MHz. Given the diffuse morphology of the source, we point out that some extended flux could have been missed at high frequencies (i.e. 4790 MHz and 8640 MHz), and that the flux density used at these two frequencies should be considered lower limits.
We have fitted the integrated spectrum of J13243138, considering synchrotron radiative losses, in order to derive some information on the intrinsic nature of the source and on the age of the radiating electrons. We have used the program SYNAGE (Murgia & Fanti 1996) and have considered three different possibilities, i.e. (a) continuous injection of new radiating electrons, (b) constant pitch angle of the radiating electrons (Kardashev 1962, Pacholzyck 1970, hereinafter KP model); (c) reisotropisation of the electrons, i.e. variable pitch angle distribution (Jaffe & Perola 1973, hereinafter JP model).
Our spectrum is very well fitted by both the KP and by the JP models, while the continuous injection model does not seem to apply to our data. Both KP and JP models converge for an initial spectral index (spectral index of the synchrotron radiation in the part of the spectrum not affected by the evolution) of the order of , which implies a power law for the energy distribution of the injected electrons of . The corresponding break frequencies for the two models are GHz (KP) and GHz (JP). The fit of the JP model to our observational data is also shown in Fig. 8.
An estimate for the source age was possible after computation of the physical parameters within the source, i.e. the magnetic field, the internal non-thermal pressure and the internal energy density. We assumed a cylindrical geometry in the source and equipartition conditions, with a uniform filling factor ( = 1), a ratio K between protons and electrons of 1, and the spectral index given by our observations. We derived P dyne cm-2, u erg cm and Beq = 1.6 G (see also Paper I). The derived magnetic field leads to an age estimate of yrs, including inverse Compton losses and the equivalent field of the 3K radiation (H G).

| Frequency | HPBW | rms | Stot | Score |
|---|---|---|---|---|
| MHz | ′′,∘ | mJy/b | mJy | mJy |
| 327 | , 80.5 | 1.9 | 230 | - |
| 843 | , 0.0 | 1.4 | 80 | - |
| 1376 | , 0.3 | 0.14 | 41 | 2.05 |
| 2382 | , 0.0 | 0.16 | 21 | 1.74 |
| 4790 | , 0.0 | 0.04 | 7.3 | 0.46 |
| 8640 | , 0.0 | 0.04 | 2.2 | 0.12 |
4.2 Spectrum of the nuclear component
The spectrum of the component coincident with the optical galaxy, obtained using the flux density measurements given in Table 2, is shown in Figure 9. Unfortunately we could not include flux density values below 1376 MHz, since the resolution of our images is too low to separate the contribution of the nuclear component from the rest of the emission. The spectrum is very steep for frequencies higher than 2382 MHz, with a value , while it flattens considerably between 1376 and 2382 MHz, where . The poor quality of the 2382 MHz map reflects in a high uncertainty in the spectral index values. We point out here that the main uncertainty in the computation of the flux density of the various components in J13243138 comes from their diffuse appearance. The overall shape of the spectrum, i.e. flat to normal below 2382 MHz and very steep above this frequency, suggests that this component is the core of the radio emission.
As in the case of the integrated spectrum, we have fitted the steep part of the spectrum with the program SYNAGE. Here the JP model seems to fit the observed data best. We derive in the range 0.85 - 1.0, in agreement with the value found for the integrated spectrum. The break frequency is lower here, with GHz, with the best fit for GHz. The magnetic field computed under the assumption of equipartition is BG, u erg cm-3 and P dyne cm-2. The corresponding estimate for the synchrotron age of the radiating electrons in this component is

4.3 Spectrum along the diffuse tail of radio emission
The study of the point-to-point spectral index in J13243138, essential for studying the evolution of the radio emission along the tail, is not trivial, given the diffuse morphology of the source and its resolution perpendicular to the axis of the radio emission in our ATCA images. In order to derive at least the trend of the spectral index between 1376 MHz and 2382 MHz along the radio tail, we computed in the two main brightness peaks located at and from the core. There is tentative evidence that the spectral index steepens away from the core, with and respectively at and .
The smoother morphology of the source in the natural weighted images at 4790 MHz and 8640 MHz, shown in Figs. 6a and 7a, allows a study of the point-to-point spectral index. The two images were made with the same gridding and restored with the same beam. Given the morphology of the 8640 MHz radio emission we could compute the spectral index starting from a distance of from the core, out to . The plot of versus distance from the core is given in Figure 10. The spectral index is steep. From the plot it is clear that steepens outwards along the jet. The local minima in correspond to the brightness peaks in the jet, and the values derived in this frequency range are in agreement with those derived between 1376 MHz and 2382 MHz.

5 Discussion
The most important observational properties of J13243138 we should take into account in interpreting the nature of the source and its implications are:
a) its location in a cluster of galaxies;
b) its tailed radio morphology, characterised by diffuse emission rather than by well defined and/or collimated jets;
c) a steep total spectral index, with , with evidence of further steepening at frequencies above 4790 MHz, and a steep spectral index in the core, with indication of a flattening around 1.4 GHz;
d) unpolarised emission down to the noise level at all frequencies.
5.1 The nature of J13243138: a relic of a radio galaxy?
The amorphous appearance of the source, its steep spectrum and the age (time since the last acceleration of electrons) derived in Section 4, indicate that J13243138 is an old radio source. The total spectral index of J13243138 in the frequency range covered by our observations is similar to that found in the outermost regions of tailed radio sources in clusters of galaxies (see, for example, what is found for the extended sources in the peripheral regions of the Coma cluster [Venturi, Feretti & Giovannini 1989], and the recent study carried out on four cluster extended radio galaxies by Feretti et al. 1998), and to the values derived for the few relic sources known (Harris et al. 1993, Feretti & Giovannini 1996).
The presence of the low frequency flattening in the spectrum of the radio component coincident with the optical galaxy suggests that it is the nuclear component of the whole radio emission, reinforcing the conclusions we drew in Paper I that J13243138 is a tailed radio galaxy.
The values we obtained for the intrinsic physical parameters of the source are intermediate between what is commonly found along the tails of head-tail radio sources in clusters of galaxies and in the few relic radio sources known thus far. For example, typical values of the internal non-thermal pressure for a large sample of tailed radio sources in clusters of galaxies are in the range dyne cm-2, with few exceptions (Feretti, Perola & Fanti 1992). Values found for relic sources are in the range - (see Harris et al. 1993 and Feretti & Giovannini 1996, for a recent review).
The properties of the nuclear component, and of the source as a whole, led us to the conclusion that no injection of new electrons is taking place at present, i.e. the nuclear engine has switched off, and J13243138 is a dead tailed radio galaxy, whose final evolution is now dominated by synchrotron losses, possibly in a dense confining medium.
5.2 Location of the source within A3556 and properties of the intracluster gas
A3556 is a richness class 0 cluster, with a mean radial velocity of km/s and a velocity dispersion of km/s (Bardelli et al. 1998). This cluster is located at the centre of the Shapley Concentration supercluster, in a region with clear signs of dynamical activity (Bardelli et al., 1998). In particular, A3556 is at the western end of a chain of strongly interacting clusters, which includes also A3558 and A3562 (Bardelli et al. 1994). Its galaxy luminosity function shows a plateau for magnitudes brighter than , indicating an excess of bright objects (Paper I). The analysis of the velocity histogram in A3556 showed the presence of two significant peaks, one corresponding to the main component (=14130 km sec-1 and km sec-1) and the other to a group (=15066 km sec-1 and km sec-1). The two systems are aligned along the line of sight. The optical counterpart of J13243138 is the brightest member of the subgroup (it is at rest with respect to the velocity centroid) and its optical spectrum (Stein, private communication) is typical of an early type galaxy, with a red continuum and no signs of activity, such as emission lines (Stein 1996).
The radio source is located at a projected distance of (corresponding to 0.06 Abell radius) from the dominanant cD galaxy at the centre of A3556, but given the dominance of systemic peculiar velocities over the Hubble flow, it is impossible to determine the relative spatial position between A3556 and the subgroup, in particular whether the systems are in an early stage of merging or the J13243138 group is already well inside the main cluster. The head-tail appearance of the radio source seems to point toward the latter hypothesis, where the morphology arises from the interaction via ram pressure with the hot gas of A3556.
Ettori, Fabian & White (1997), in their extensive study of the X-ray properties of the clusters in the Shapley Concentration core, applied a deprojection method to a ROSAT image of A3556 in order to derive the properties of the hot gas. By fitting a King model of the form
to the deprojected pressure profile, Ettori (private communication) obtains dyne cm-2, and . The equilibrium between the external hot gas pressure and the internal equipartition pressure in J13243138, i.e. , is found by extrapolating the profile out to a distance of Mpc for the extended component of J13243138 and to Mpc for its core. We point out that these distances are significantly larger than the dimension of the X-ray emitting region of A3556 ( Mpc) and are larger than the distance between the cores of A3556 and A3558 ( Mpc). We conclude therefore that over the full extent of the radio source and at any plausible distance from the centre of A3556.
Moreover, we calculated the ram pressure assuming a gas temperature of keV derived from the velocity dispersion, and a galaxy peculiar velocity given by the difference between the mean velocity of the A3556 main component and the measured redshift of J13243138 ( km/s), finding that at all distances from the cluster centre.
The condition of pressure equilibrium between the radio emission and the surrounding medium seems to hold in some cases, for example in the wide-angle tail in A2717 (Liang et al. 1997). However, from the literature we know that non-equilibrium between the external gas thermal pressure and the internal non-thermal pressure of the radio emission is not uncommon. In particular, the radio emission is often overpressured, i.e. P Pint up to about two orders of magnitude (Feretti, Perola & Fanti 1992), and deviations from minimum energy arguments could be expected and should be taken into account. The unbalance between in J13243138 and at its projected distance from the centre of A3556, amounts to a factor of , fully in agreement with the result of Feretti, Perola & Fanti (1992).
Further evidence that the source is located in a dense medium and that the radio emission is possibly seen through the cluster magnetic field comes from two observational properties, the source age and the unpolarised radio emission. The age estimate we derived in Sect. 4.1 is amongst the largest found in radio sources. Estimates for the very few relic radio sources known and for cluster radio halos range around a few times 107 yrs (see for example the case of 1257+275 located in the peripheral region of the Coma cluster, Giovannini, Feretti & Stanghellini 1991). In the case of the radio galaxy B2 0924+30, considered “a prototypical genuine relic of a dead radio galaxy” (Klein et al. 1996) the ages derived are in the range 7 - 8 yrs. For J13243138 strong confinement by the intracluster medium may have reduced the losses due to adiabatic expansion, thus allowing a longer lifetime for the source.
The lack of polarisation from the source may also give information on the intracluster gas. We note that the upper limit to the polarisation percentage at 8640 MHz is high, due to the very low total flux of the source, so from our data we cannot distinguish between low polarisation at high frequencies combined with depolarisation at high frequency, or no polarisation at all. In both cases the observational data could be explained either a) with the presence of a large quantity of thermal plasma within the radio source (Burn 1966), or b) with an external foreground screen, characterised by a random magnetic field (Tribble 1991), or both. We point out that extended sources in clusters of galaxies are usually polarised, and that the polarisation percentage may go up to in the outermost regions (Feretti et al. 1998). Relic radio sources in clusters of galaxies are polarised too (see for example the relic radio source 1253+275 in the Coma cluster, Giovannini, Feretti & Stanghellini 1991). Halo radio sources at the centre of galaxy clusters, on the other hand, are not polarised.
a) The large age estimated for the source, and its morphology, suggest that J13243138 may have had entrained thermal gas from the ambient medium, and be subject to internal Faraday effects.
b) The existence of cluster magnetic fields is now an established result. Direct observational evidence comes from the few known cluster halo sources, such as for example Coma-C in the Coma cluster (Kim et al. 1989, Giovannini et al. 1993) and A2319 (Feretti, Giovannini & Böhringer 1997); indirect evidence is given by the excess rotation measures observed in a number of central radio sources in clusters of galaxies (Ge et al. 1994, Feretti et al. 1995). The location of J13243138 beyond the main cluster concentration, coupled with the X-ray emission associated with the cluster, do indeed support the idea that the radio emission is seen through the intracluster gas. For comparison, we find that the radio source J13243140, associated with the dominant cD galaxy at the centre of the main concentration in A3556, is 12% and 18% polarised at 4790 MHz and 8640 MHz respectively.
5.3 Possible links between present evolutionary stage of J13243138 and the merging between A3556 and its subgroups
The age derived for J13243138 is high for a radio source, but it is significantly shorter than the typical timescale for concluding merging processes in clusters of galaxies, estimated to be yrs (Roettinger et al. 1993). The velocity distribution of the galaxies in A3556 shows that J13243138 belongs to a subgroup located beyond (in velocity space) the core. However, from the spectroscopic information it is impossible to infer whether the subgroup is still infalling into the main concentration of A3556 or if it has already crossed the centre. If we assume that cluster merging strongly influences the radio activity in galaxies, then our study at radio wavelengths suggests two possible scenarios.
1. The galaxy associated with J13243138, a pre-existing radio source, is falling towards the centre of A3556. This implies that the ram pressure stripped the tail, while the external thermal gas pressure confined the electrons, preventing losses from adiabatic expansion. The estimates given here for the lifetime of the radio galaxy and for the linear distance of the galaxy with respect to the core of A3556 agree with each other and with the velocity difference of the galaxy. In this frame it should be explained how infalling (through the imbalance ) could switch off a radio active nucleus. Furthermore, this possibility implies that the radio source is located between us and A3556, and under the hypothesis that the polarisation properties of the source are due to an external medium, the requirement of a foreground screen for the depolarization of the emission is challenged.
2. A transit close to the core of A3556 has triggered the radio emission (Reid et al., 1998), that ceased years ago. A in the former case, the ram pressure has the central role of stripping the tail. Furthermore, after the merging event between the core of A3556 and the subgroup hosting J13243138, the source is now beyond the core of A3556 along the line of sight and it is seen through the intracluster gas of A3556 itself.
With the current data, both at radio and optical wavelengths, it is difficult to discriminate between the two possibilities proposed here. The second scenario would better fit with the idea that the global process of merging of clusters and groups of galaxies enhances the probability that a galaxy becomes a radio source. We recall here that the core of A3556 has unusual properties at optical and radio wavelengths. Its optical luminosity function is quite different from that of the other clusters in the A3558 complex, presenting a plateau at bright magnitudes, with all bright galaxies in the plateau are radio loud (Paper I). Moreover, the distributions of bright and faint galaxies as a function of distance from the cluster centre differ considerably (Bardelli et al. 1998).
6 Conclusions
We have presented observations of the radio galaxy J13243138, located in the central region of the Abell cluster A3556, over a wide range of frequencies and resolutions. We can briefly summarise our results as follows:
(a) J13243138 is an example of a remnant of a radio galaxy, i.e. a source in which the engine of the radio emission has switched off. The evolution of the radio emission is presently dominated by synchrotron losses.
(b) The radio source is not in pressure equilibrium with the intracluster gas. In particular it is underpressured.
(c) We suggest that the lack of polarisation in the source is due to the presence of an intervening Faraday screen, i.e. a cluster scale magnetised medium, as it is now often observed in clusters of galaxies, which depolarises the radio emission.
(d) Under the hypotesis that cluster mergers influence the radio emission of a galaxy, the properties of J13243138, coupled with the peculiarities of A3556 at radio and optical wavelengths (Paper I and Bardelli et al. 1998), suggest that the core of A3556 and the subgroup hosting J13243138 have already undergone a major merging event.
Acknowledgments
We wish to thank D. Dallacasa for his suggestions and discussion while this work was carried out, and R. Fanti for careful reading of the manuscript. We are grateful to S. Ettori for providing unpublished results, and to P. Stein for giving us the spectrum of J13243138. T.V. acknowledges the receipt of two grants from CNR/CSIRO (Prot. n. 119816 and Prot. n. 088864).
The MOST is operated by the University of Sydney, with support from the Australian Research Council. The Australia Telescope Compact Array is operated by the CSIRO Australia Telescope National Facility. The National Radio Astronomy Observatory (NRAO) is operated by Associated Universities, Inc., under contract with the National Science Foundation. This research has made use of the NASA/IPAC Extragalactic Database (NED), which is operated by the Jet Propulsion Laboratory, Caltech, under contract with the National Aeronautics and Space Administration.
References
- [1] Bardelli S., Zucca E., Vettolani G., Zamorani G., Scaramella R., Collins C.A., MacGillivray H.T., 1994, MNRAS 267, 665
- [2] Bardelli S., Zucca E., Zamorani G., Vettolani G., Scaramella R., 1998, MNRAS, in press
- [3] Burn B.J., 1966, MNRAS 133, 67
- [4] Ettori S., Fabian A.C., White A.D., 1997, MNRAS 289, 787
- [5] Fanaroff B.L., Riley J.M., 1974, MNRAS 167, 31
- [6] Feretti L., Dallacasa D., Giovannini G., Tagliani A., 1995, A&A 302, 680
- [7] Feretti L., Perola G.C., Fanti R., 1992, A&A 265, 9
- [8] Feretti L., Giovannini G., Böhringer H., 1997, New Astronomy 2, 501
- [9] Feretti L., Giovannini, G., 1996, in Extragalactic Radio Sources, IAU Symp. 175, Eds. Fanti C., Ekers R., Padrielli L., Kluwer Ac. Publ., p. 333
- [10] Feretti L., Giovannini G., Klein U., Mack K.-H., Sijbring L.G., Zech G., 1998, A&A, in press
- [11] Ge J., Owen F.N., 1994, AJ 108, 1523
- [12] Giovannini G., Feretti L., Venturi T., Kim K.-T., Kronberg P.P., 1993, ApJ 406, 399
- [13] Giovannini G., Feretti L., Stanghellini C., 1991, A&A 252, 528
- [14] Harris D.E., Stern C.P., Willis A.G., Dewdney P.E., 1993, AJ 105, 769
- [15] Jaffe W.F., Perola G.C., 1973, A&A 26, 423
- [16] Kardashev N.S., 1962, Sov. Astron. AJ 6, 317
- [17] Pacholzyck A.G.,, 1970, Radio Astrophysics, Freeman, San Francisco
- [18] Kim K.-T., Kronberg P.P., Giovannini G., Venturi T., 1989, Nature 341, 720
- [19] Klein U., Mack K.-H., Gregorini L., Parma P., 1996, in Extragalactic Radio Sources, IAU Symp. 175, Eds. Fanti C., Ekers R., Padrielli L., Kluwer Ac. Publ., p. 345
- [20] Liang H., Pierre M., Unewisse A., Hunstead R.W., 1997, A&A 321, 64
- [21] Murgia M., Fanti R., 1996, Rapporto Interno IRA 228/96
- [22] O’Dea C.P., Owen F.N, 1985a, AJ 90, 927
- [23] O’Dea C.P., Owen F.N, 1985b, AJ 90, 954
- [24] Owen F.N., 1996, in Extragalactic Radio Sources, IAU Symp. 175, Eds. Fanti C., Ekers R., Padrielli L., Kluwer Ac. Publ., p. 305
- [25] Reid A.D., Hunstead R.W., Pierre M.M., 1998, MNRAS, in press
- [26] Roettinger, K., Burns, J., Loken, C., 1993, ApJ Let. 407, 470
- [27] Sault, R.J., Teuben, P.J., Wright, M.C.H., 1995, in Astronomical Data Analysis Software and Systems IV, eds. R. Shaw, H.E. Payne and J.J.E. Hayes, Astronomical Society of the Pacific Conference Series 77, 433
- [28] Tribble P.C., 1991, MNRAS 250, 726
- [29] Venturi T., Feretti L., Giovannini G., 1989, A&A 213, 49
- [30] Venturi T., Bardelli S., Morganti R., Hunstead R.W., 1997, MNRAS 285, 898 (Paper I)
- [31] Venturi T., Bardelli, S., Morganti R., Hunstead R.W., 1997, in Looking Deep into the Southern Sky, Joint ESO/Australia Workshop, Eds. W. Cauch & R. Morganti, in press