A Search for High-redshift Quasars Among GB/FIRST Flat-Spectrum Radio Sources
Abstract
We present the method and first results of a survey for high-redshift () radio-loud quasars, which is based on optical identifications of 2902 flat-spectrum radio sources with mJy. The radio sample was defined over a 1600 sq degree region using the 5GHz Green Bank survey and the 1.4GHz VLA FIRST survey. 560 sources were identified to a limit of E=19.5 on APM scans of POSS-I plates and 337 of these optical counterparts are unresolved. From these a complete sample of 73 sources for spectroscopic follow up was defined based on criteria of red () optical colour. We have obtained spectra for 36 of these and an additional 14 had redshifts in the literature, thus 70% of the spectroscopic sample is completed. Six objects in the sample were found to be radio-loud quasars with of which two were previously known. The efficiency of the spectroscopic phase of the survey is therefore about 1 in 9, whereas without the colour selection criterion the efficiency would have been 1 in . The six quasars were found in an effective area of 1100 square degrees, implying a surface density of one flat-spectrum radio-loud quasar per 190 square degrees to limits of E=19.5 and . This survey also produced the first known radio-loud BAL quasar, 1556+3517 with , which has been reported in an earlier paper (Becker et al 1997). This object has a redder optical colour () than all the quasars found in this survey to date. In addition we have obtained spectra of 22 GB/FIRST sources which are not part of the complete sample. We give positions, E (red) magnitudes, colours, radio fluxes, radio spectral index and redshifts where possible for objects for which we have obtained spectra. We give spectra and finding charts for the quasars.
keywords:
quasars:general radio1 Introduction
We have begun a search for high-redshift quasars selected using the VLA FIRST survey (Becker, White & Helfand 1995). The aim of this work is to extend recent searches for radio-loud high-redshift quasars (e.g. Hook et al. 1995, 1996; Hook & McMahon 1998; Shaver et al. 1996) fainter in radio flux density by a factor of , and, ultimately, to use the new sample to constrain the faint end of the radio quasar luminosity function at high redshift. In addition, the sample can be used to provide an unbiased sample of damped absorption systems that can be used to study galaxy evolution at high redshift.
Whilst radio-loud quasars are only a small subset of the quasar population, the construction of radio-loud quasar samples is less prone to selection effects than are optical samples, since radio emission is unaffected by either intrinsic or extrinsic absorption due to dust. Fall & Pei (1993) discuss how dust within intervening galaxies may affect the observed evolution in optically selected samples of quasars.
Our survey technique involves optical identification of a large number of radio sources, followed by selection of the optically red, unresolved objects. The technique is similar to that used by Hook et al. (1995,1996) to find quasars at higher radio flux densities, and complements the FIRST Bright Quasar sample (FBQS, Gregg et al. 1996).
The radio data are described in section 2 of this paper and the optical identification of the radio sample and selection of the spectroscopic sample are described in section 3. The spectroscopic observations are described in section 4, and the results are presented in section 5. Finally, tables of redshifts, optical and radio data are given for the objects for which we have obtained spectra, along with the spectra and finding charts for the quasars.
2 Definition of the Radio Sample
This study uses as its starting point the 5GHz 87GB catalog of Gregory & Condon (1991). By defining the sample at high frequency, flat-spectrum core-dominated objects, which are usually identified with quasars, are preferentially selected. Spectral index information and the accurate positions (better than ) needed for optical identification are provided by the VLA ‘FIRST’ survey (Becker, White & Helfand, 1995). The sample covers an area of 0.49sr (1600sq deg), limited by the extent of the FIRST survey which at the commencement of this work covered the region , .
Objects with from the 5GHz 87GB catalog were matched to the FIRST catalog with a matching radius of 1 arcmin. In cases where more than one FIRST object matched the 5GHz source (about 50% of the time), the FIRST source with the strongest flux was selected (i.e the source with the steepest spectrum). The reason for this is that if that source then passes the flat spectrum selection criterion then there is certain to be a flat spectrum source associated with the 5GHz source.
Matched sources with radio spectral index flatter than (where ) were then selected. The exact spectral index criterion chosen was somewhat arbitrary but this has proved successful in the past at separating the quasar and radio galaxy populations. The ‘total’ (rather than ‘peak’) fluxes from the 1.4GHz FIRST catalogue were used to compute the spectral index. A total of 2902 sources () meet these criteria.
3 Optical identification and selection of the Spectroscopic sample
Optical identification of the radio sources was carried out using APM (Automated Plate Measurement Facility at Cambridge, U.K.) scans of POSS-I E (red) and O (blue) plates. The identification procedure and selection of candidates is similar to that in Hook et al. (1996), and more details can be found there along with a description of the APM POSS-I catalog.
Identifications were made based on positional coincidence of the FIRST radio position with an optical counterpart on the POSS-I E plate. The sample of candidate high-redshift quasars was then selected using the APM image classification, , measured from the E plate, and the OE colour. The basis for the colour selection method is that the colours of quasars with become rapidly redder with redshift, due to absorption by intervening Ly (see figure 1 in Hook et al. 1995). To define a sample with a high level of completeness at we chose a limit of . A magnitude limit of was imposed (0.5 mag brighter than the E plate limit) so that spectroscopy with the Lick-3m would be more feasible. The APM star/galaxy separation is also more reliable away from the plate limit.
Based on results from the high-redshift radio-quasar survey of Hook et al. (1996) and on results from from the FBQS (Gregg et al. 1996), stricter selection criteria were used for this new survey. The criterion for positional coincidence used by Hook et al. (1996) was and for the FBQS it was (Gregg et al. 1996). Even that was found to be too generous: 64 out of 69 (93%) spectroscopically confirmed quasars in FBQS were found to have , and 97% have (the outliers were extended radio sources). Since the current high redshift survey goes 2 magnitudes fainter in E than FBQS, we adopt a more conservative criterion of . Figure 1 shows this limit in relation to the histogram of for identifications with . The distribution peaks for the stellar and non-stellar identifications at . However, whereas beyond the stellar histogram is indistinguishable from the derived background, the non-stellar identifications show an excess. There is evidence from Figure 1a that this may persist out to a radius of (and possibly further, although this would not be apparent in Fig 1a since the background was determined by fitting the distribution from to ). This may be due to either the clustering of galaxies or that the peak of the radio emission is not on the optical counterpart as would be expected for extended asymmetric radio sources. Since the extended or resolved optical counterparts are not the subject of this paper, we do not consider this issue any further. This issue is discussed further in a forthcoming paper (McMahon et al, in prep) on the optical identifications of all FIRST sources using the APM POSS-I catalogue.
There is a small excess of 34 stellar objects above the background level between radii of and (see Fig 1b). If we assume that these are real identifications that are excluded from the spectroscopic sample, then the incompleteness due to the criterion is is . This agrees with the fact that of the 13 quasars found in the survey of Hook et al. (1996) (with limiting magnitude ), only one would not have satisfied the criterion of .
The background counts for stellar sources with was found to be 0.64 per square arcmin (see Fig. 1 and caption). Thus within a search radius of we expect 3.6 false identifications amongst the stellar identifications, i.e. 1.1%. The corresponding background for red () stellar sources is 0.54 per square arcmin, and we therefore expect 3.1 false red stellar identifications. In section 5 this number is compared to the number of stars found in our sample.


We also now adopt a stricter criterion for stellar image classification. In Hook et al. (1996) a criterion of was used (where can be considered as the number of standard deviations a particular object is from having a stellar profile; see Hook et al. (1996) for a more detailed explanation). However only one of the 13 quasars found in that survey had , an object with E=19.93, fainter than the limit of the current survey. Thus we now adopt a criterion of . Whilst using these stricter criteria on and has little effect on the completeness of the final high-redshift quasar sample compared to that in Hook et al. (1996), the number of candidates requiring spectroscopy is reduced by .
In summary the selection criteria are (i) , (ii) flat radio spectral index , (iii) positional coincidence, , (iv) red optical colour , (v) unresolved image on the E plate, , (vi) mag. The optical counterpart was not required to be detected on the O plate.
There is little overlap between this sample and the FBQS. The FBQS does not have a radio spectral index cut and reaches . FBQS now has a blue optical colour criterion of and has a significantly brighter optical limit of E=17.5. Hence the two quasar samples are largely complementary.
Of the 2902 flat spectrum sources (as defined in section 2) in the GB/FIRST survey area, 560 have optical identifications brighter than E=19.5 within . The histogram of their colours, shown in Figure 2, has a bimodal distribution. The bluer peak is dominated by stellar identifications (the vast majority of which are low-redshift quasars) and the redder peak is dominated by galaxies. By imposing a red colour selection criterion on the sample of stellar identifications, the majority of low redshift quasars are eliminated. Of the 560 identifications, 337 are classified as stellar and 73 of these satisfy the colour criterion above (). This sample of 73 objects will be referred to as the ‘spectroscopic sample’ and they are shown in the colour-magnitude diagram in Figure 3.


Fourteen of the spectroscopic sample had published spectroscopic data, leaving 59 objects requiring spectroscopy. The previously-known objects were not re-observed and their properties are summarised in Table 1. Two of the previously-known objects are radio-selected quasars (0933+2845, Gregg et al. 1996 and 1340+3754, Hook et al. 1995).
| Optical Position | E | OE | Reference/ | |||||||||||||
|---|---|---|---|---|---|---|---|---|---|---|---|---|---|---|---|---|
| J2000 | mag | mag | ′′ | mJy | mJy | mJy | mJy | Classification | ||||||||
| 09 | 11 | 47.71 | +33 | 49 | 17.6 | 18.62 | 0.78 | 250 | 207 | 391.2 | 380.8 | H96 / featureless | ||||
| 09 | 30 | 55.28 | +35 | 03 | 36.9 | 19.18 | 0.85 | 383 | 381 | 518.8 | 484.5 | H96 / featureless | ||||
| 09 | 33 | 37.31 | +28 | 45 | 32.3 | 3.42 | 17.50 | 0.16 | 66 | 63 | 120.9 | 117.0 | G96 FBQS / QSO | |||
| 10 | 50 | 58.15 | +34 | 30 | 10.8 | 2.52 | 18.98 | 0.30 | 298 | 291 | 547.3 | 554.0 | W84 / QSO | |||
| 11 | 49 | 00.29 | +29 | 58 | 41.0 | 0.15 | 17.05 | 0.34 | 41 | 39 | 53.2 | 52.5 | G96 FBQS / Gal | |||
| 12 | 35 | 05.79 | +36 | 21 | 18.7 | 1.60 | 19.06 | 0.47 | 250 | 251 | 175.7 | 154.5 | H96 / QSO | |||
| 13 | 24 | 12.09 | +40 | 48 | 12.4 | 0.50 | 19.49 | 0.87 | 413 | 423 | 369.4 | 350.1 | V96 / QSO | |||
| 13 | 40 | 22.94 | +37 | 54 | 44.4 | 3.10 | 17.85 | 0.85 | 305 | 301 | 284.3 | 273.9 | H95 / QSO | |||
| 13 | 50 | 35.95 | +33 | 42 | 17.2 | 0.01 | 11.41 | 0.93 | 76 | 90 | 100.5 | 103.8a | HGC95 / Gal | |||
| 14 | 04 | 14.63 | +28 | 46 | 36.5 | 16.03 | 1.03 | 38 | 36 | 12.5 | 11.7 | G96 FBQS / star | ||||
| 14 | 21 | 25.62 | +39 | 43 | 29.4 | 0.62 | 18.33 | 0.79 | 67 | 64 | 43.6 | 82.9b | V90 / QSO | |||
| 14 | 58 | 44.88 | +37 | 20 | 21.6 | 0.33 | 18.22 | 0.68 | 591 | 591 | 271.9 | 215.2 | V96, H96 / Gal | |||
| 15 | 58 | 55.21 | +33 | 23 | 19.3 | 1.65 | 16.49 | 0.83 | 88 | 86 | 145.5 | 142.7 | F86 / QSO | |||
| 16 | 33 | 02.12 | +39 | 24 | 27.4 | 1.02 | 15.02 | 0.34 | 40 | 38 | 54.7 | 79.1 | CCH90 / QSO | |||
Notes on column headings: is the 5GHz flux from
Gregory & Condon (1991) and is the 5GHz flux from the
Becker et al (1991) catalog. was determined by summing up
the fluxes from sources in the 1.4GHz NRAO-VLA Sky Survey catalog (NVSS, Condon et al 1994) within of the FIRST position.
is the ‘Total’ flux from the 1.4GHz FIRST catalog and
is the spectral index between and
.
a NVSS flux is the sum of two components. The central component has
S=97.3mJy and a second component away has S=6.5mJy.
b NVSS flux is the sum of two components: The closest source has
S=62.3mJy and a second, probably unrelated source away has S=20.6mJy.
References:
F86=Foltz et
al (1986), G96 = Gregg et al (1996), H95 = Hook et al (1995), H96 = Hook et al (1996), HGC95=
Huchra, Geller & Corwin (1995), V90=Vigotti et al (1990), V96 =
Vermeulen et al (1996), W84=Wampler et al 1984, CCH90=Crampton, Cowley
& Hartwick (1990)
4 Optical Spectroscopy
The aim of the spectroscopic phase of this project is to obtain classification (high-redshift quasar or not) for the complete spectroscopic sample defined above. This does not require redshifts to be obtained for all the objects, for example many ‘featureless’ spectra could be rejected as possible quasars by the lack of Ly forest absorption. The strategy was therefore to take short exposures at low dispersion to obtain spectra of sufficient quality for the nature of the object and, where possible, the redshift to be determined.
Most of the spectroscopy was carried out in 1995 April and 1996 May using the KAST double-spectrograph at the Cassegrain focus of the 3m Shane Telescope at Lick observatory. Typical exposure times were 600-900s. For the May 1996 run, a grating giving 4.6Å/pix dispersion was used on the red side, and on the blue side the selected grism gave a dispersion of 2.54Å/pix. A dichroic at 5500Å was used. The set-up was such that the blue side of the spectrum covered Å and the red side covered Å. For the Apr 1995 run a grating giving 2.32Å/pix dispersion was used on the red side, and on the blue side the selected grism gave a dispersion of 1.85Å/pix. A dichroic at 5500Å was used giving a total wavelength coverage of 3430-8150Å. For both runs the detectors on both the red and blue sides were UV-flooded Reticon CCDs with 27 micron pixels, corresponding to about 0.8 arcsec/pixel. The CCD chips were windowed in the spatial direction to reduce the readout time.
Seven objects from the spectroscopic sample were observed at the Keck telescope with the Low Resolution Imaging Spectrograph (LRIS). These observations were carried out as a backup program during a run to obtain spectra of distant supernovae. A 300 l/mm grating was used on LRIS and covered the wavelength range Å with resolution of 2.5Å/pix. In addition, one object was observed at 4.2m WHT, La Palma in 1993 April and another by R. Weymann at Palomar 5m in 1991 December as part of other programs.
For all observations the width of the slit was adjusted to be compatible with the seeing at the time of observation () and the data were taken with a long slit at the parallactic angle. Some of the objects were too faint to be easily visible on the acquisition TV at the Lick 3m so accurate offsetting from nearby stars was used to position the target object in the slit. Spectrophotometric standards were observed to calibrate the spectra.
The reduction of data was carried out using standard software from the IRAF111IRAF is distributed by the National Optical Astronomy Observatories, which is operated by the Association of Universities for Research in Astronomy, Inc. (AURA) under cooperative agreement with the National Science Foundation. package.
5 Results and Discussion
Of the 59 objects requiring spectroscopy we now present new spectroscopic data for 36. The properties of objects in the spectroscopic sample for which we obtained spectra are given in Table 2. When combined with the 14 objects which have spectroscopic data in the literature, 50 () of the complete sample defined in Section 3 now have spectroscopic data. The remaining 23 objects have yet to be observed.
| Optical Position | E | OE | Tel/Date/Class | |||||||||||||
|---|---|---|---|---|---|---|---|---|---|---|---|---|---|---|---|---|
| J2000 | mag | mag | ′′ | mJy | mJy | mJy | mJy | |||||||||
| 08 | 47 | 15.16 | +38 | 31 | 10.2 | 3.18 | 17.55 | 0.31 | 124 | 122 | 185.8 | 201.1 | K 03/97 QSO | |||
| 08 | 52 | 44.76 | +34 | 35 | 40.8 | 1.65 | 18.43 | 0.53 | 70 | 66 | 69.6 | 69.1a | K 03/97 QSO | |||
| 08 | 57 | 41.88 | +38 | 16 | 35.6 | 0.43 | 19.40 | 0.47 | 49 | 47 | 33.8 | 70.9b | K 03/97 Gal (abs.) | |||
| 08 | 59 | 17.31 | +34 | 09 | 09.3 | 0.55 | 19.46 | 0.65 | 30 | 55.6 | 53.8 | K 03/97 Gal (abs.) | ||||
| 09 | 02 | 39.91 | +39 | 57 | 26.7 | 3.08 | 17.56 | 0.14 | 31 | 29 | 32.4 | K 03/97 QSO | ||||
| 10 | 23 | 24.04 | +28 | 56 | 50.8 | 19.12 | 0.24 | 89 | 86 | 127.4 | 139.7 | W 04/93 featureless | ||||
| 10 | 28 | 46.95 | +41 | 26 | 56.6 | 2.82* | 19.46 | 0.19 | 53 | 51 | 62.3 | 74.4 | L 05/96 QSO ? | |||
| 10 | 42 | 06.79 | +29 | 38 | 26.8 | 2.55 | 19.30 | 0.73 | 56 | 54 | 70.0 | 71.9 | L 04/95 QSO | |||
| 10 | 42 | 32.27 | +36 | 15 | 20.7 | 18.62 | 0.09 | 92 | 89 | 60.1 | 68.1 | L 05/96 featureless ? | ||||
| 10 | 44 | 06.39 | +29 | 59 | 01.3 | 2.99 | 18.62 | 0.73 | 80 | 79 | 37.4 | 40.9 | P 12/91 QSO | |||
| 10 | 55 | 38.67 | +30 | 52 | 50.6 | 17.83 | 0.65 | 32 | 31 | 7.8 | 14.7 | L 04/95 not QSO | ||||
| 11 | 21 | 11.12 | +37 | 02 | 47.0 | 1.62 | 17.04 | 0.16 | 72 | 69 | 100.8 | 105.7 | L 05/96 QSO | |||
| 11 | 29 | 14.28 | +37 | 03 | 17.5 | 18.34 | 0.52 | 95 | 91 | 70.1 | 60.9 | L 05/96 featureless | ||||
| 11 | 51 | 16.95 | +40 | 08 | 21.6 | 2.74 | 19.41 | 0.52 | 111 | 108 | 84.0 | 81.7 | L 05/96 QSO | |||
| 12 | 34 | 44.34 | +36 | 37 | 22.2 | 19.10 | 0.27 | 45 | 43 | 62.8 | 64.3 | L 05/96 Gal (abs?) | ||||
| 12 | 36 | 23.02 | +39 | 00 | 00.7 | 17.32 | 0.32 | 47 | 57 | 37.0 | 37.1 | L 05/96 featureless | ||||
| 12 | 58 | 32.18 | +29 | 09 | 03.0 | 3.47 | 18.52 | 0.48 | 32 | 32 | 25.0 | 25.1 | L 04/95 QSO | |||
| 13 | 01 | 23.40 | +28 | 42 | 53.8 | 0.42 | 18.86 | 0.47 | 31 | 13.1 | 12.1 | L 04/95 Gal (em.) | ||||
| 13 | 24 | 04.90 | +34 | 17 | 38.5 | 18.80 | 0.35 | 85 | 83 | 54.8 | 62.2 | L 05/96 featureless ? | ||||
| 13 | 42 | 52.97 | +40 | 32 | 02.0 | 0.91 | 19.50 | 0.58 | 113 | 99 | 137.2 | 152.2 | L 05/96 QSO | |||
| 13 | 48 | 48.13 | +29 | 39 | 17.6 | 0.24 | 18.43 | 1.19 | 216 | 213 | 327.5 | 695.6 | L 04/95 Gal | |||
| 13 | 58 | 19.85 | +32 | 19 | 27.8 | 2.85 | 18.66 | 1.32 | 36 | 36 | 20.6 | 18.8 | L 05/96 QSO | |||
| 14 | 01 | 38.82 | +36 | 11 | 21.6 | 19.03 | 1.29 | 61 | 59 | 83.3 | 73.0 | L 05/96 featureless | ||||
| 14 | 13 | 14.15 | +32 | 00 | 56.6 | 19.05 | 1.19 | 31 | 44.0 | 49.0 | L 05/96 featureless | |||||
| 14 | 36 | 42.84 | +40 | 22 | 05.8 | 2.57 | 18.07 | 0.19 | 33 | 32 | 23.0 | 22.3 | L 05/96 QSO | |||
| 14 | 53 | 18.56 | +35 | 05 | 39.4 | 19.48 | 0.51 | 127 | 123 | 215.8 | 217.3 | L 05/96 featureless | ||||
| 15 | 23 | 14.87 | +38 | 14 | 01.7 | 3.15 | 18.38 | 0.40 | 27 | 47.7 | 52.6 | L 05/96 QSO | ||||
| 15 | 29 | 42.17 | +35 | 08 | 50.7 | 0.29 | 17.83 | 0.94 | 50 | 48 | 90.0 | 105.6 | L 05/96 QSO | |||
| 15 | 42 | 46.77 | +33 | 46 | 02.4 | 0.28 | 17.85 | 0.93 | 69 | 66 | 36.8 | 39.8 | L 05/96 Gal | |||
| 15 | 56 | 33.79 | +35 | 17 | 56.9 | 1.48 | 18.68 | 0.71 | 27 | 31.8 | 28.1 | L 05/96 BAL QSO | ||||
| 16 | 05 | 23.73 | +30 | 38 | 37.0 | 2.67 | 18.66 | 0.44 | 76 | 59 | 52.6 | 50.0 | L 04/95 QSO | |||
| 16 | 20 | 04.77 | +35 | 15 | 54.5 | 2.95 | 17.94 | 1.01 | 40 | 38 | 50.1 | 57.9 | L 05/96 QSO | |||
| 16 | 55 | 42.82 | +32 | 44 | 20.0 | 17.84 | 0.30 | 69 | 69 | 31.8 | 38.7 | L 05/96 featureless ? | ||||
| 17 | 00 | 08.72 | +29 | 19 | 03.1 | 16.02 | 1.08 | 39 | 48 | 3.0 | 5.1 | L 05/96 star | ||||
| 17 | 01 | 24.70 | +39 | 54 | 37.3 | 16.58 | 0.82 | 159 | 157 | 256.8 | 190.8 | L 05/96 featureless | ||||
| 17 | 06 | 50.43 | +30 | 04 | 12.1 | 18.25 | 0.32 | 38 | 36 | 27.9 | 29.5 | L 05/96 featureless | ||||
Notes
* uncertain redshift.
Telescope code: L=Lick 3m,
K=Keck-II, W=WHT, P=Palomar 5m (Weymann, private communication).
a NVSS flux contains contributions from two components: a central
component with flux density S=60.7mJy and another away with S=8.4mJy.
b As above but central component has S=54.5mJy and other component
away has S=16.2mJy.
Four new quasars with have been found in the spectroscopic sample to date. Since 36 objects were observed, the efficiency of the survey for finding quasars is approximately 1 in 9, similar to that of Hook et al 1996 (although note that the selection criteria are now stricter). If we had not used the colour selection criterion, the efficiency would be lower by a factor of . The quasars are marked on the colour-magnitude diagram (Figure 3) with stars. A further 8 new quasars in the range were found (but note that the colour selection criterion means the sample is substantially incomplete for ).
The remaining observed objects were found to be low-redshift () quasars, emission- or absorption-line galaxies and objects with featureless spectra which could be ruled out as possible high-redshift quasars. Two objects were found to be stars and are probably chance coincidences with the radio position (both have ). This agrees well with the number of false identifications expected (see section 3). We expect 3.1 false, red, stellar identifications in the full spectroscopic sample, thus after observing 70% of these objects we expect to have found 2.1 stars.
The first radio-loud BAL quasar, 1556+3517 with , was discovered in this survey and was reported in an earlier paper (Becker et al. 1997). Note that this object is redder () than any of the quasars in the sample so far.
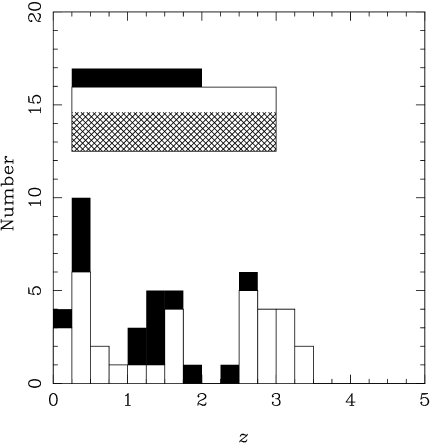
Of the 50 objects with spectroscopic data, 35 have a definite redshift based on emission or absorption features (including the two stars). Their redshift distribution is shown in Figure 4. The 15 ‘featureless’ objects are represented by the open box, while objects with no spectral information are represented by the hatched box.
In addition we have observed 22 objects that do not meet one or more of the selection criteria of the spectroscopic sample, but which satisfy a less stringent set of selection criteria: ; ; ; mag. None of them was found to have . The results for these objects are summarised in Table 3. They are plotted as crosses on the colour-magnitude diagram in Figure 3 and represented by the solid shading in the redshift histogram in Figure 4.
| Optical Position | E | OE | Tel/Date/Class | |||||||||||||
|---|---|---|---|---|---|---|---|---|---|---|---|---|---|---|---|---|
| J2000 | mag | mag | ′′ | mJy | mJy | mJy | mJy | |||||||||
| 08 | 35 | 19.76 | +29 | 09 | 21.2 | 1.27 | 19.72 | 0.55 | 36 | 45 | 41.3 | 38.9 | L 04/95 QSO | |||
| 09 | 00 | 30.44 | +33 | 30 | 09.7 | 19.91 | 0.86 | 81 | 77 | 72.4 | 82.5 | K 03/97 featureless | ||||
| 09 | 06 | 02.49 | +41 | 16 | 27.6 | 0.41 | 17.85 | 2.75 | 279 | 276 | 771.1 | 848.3 | K 03/97 QSO | |||
| 09 | 08 | 53.08 | +30 | 47 | 38.3 | 1.91 | 19.63 | 0.27 | 35 | 32 | 34.2 | 40.1 | L 04/95 QSO | |||
| 09 | 24 | 38.22 | +30 | 28 | 36.6 | 0.27 | 17.76 | 0.70 | 27 | 4.0 | 8.4 | L 04/95 Gal | ||||
| 09 | 27 | 39.78 | +30 | 34 | 17.3 | 1.20 | 19.59 | 0.87 | 57 | 56 | 46.1 | 51.5 | L 04/95 QSO | |||
| 11 | 05 | 50.05 | +30 | 01 | 46.2 | 19.36 | 0.79 | 53 | 50 | 64.2 | L 04/95 featureless | |||||
| 11 | 24 | 29.65 | +28 | 31 | 25.3 | 1.35 | 19.04 | 0.46 | 31 | 38 | 22.3 | 24.0 | L 04/95 QSO | |||
| 11 | 27 | 29.21 | +37 | 56 | 12.4 | 19.60 | 1.13 | 70 | 67 | 66.4 | 78.3 | L 05/96 featureless ? | ||||
| 12 | 11 | 34.02 | +28 | 47 | 33.1 | 19.65 | 0.17 | 35 | 33 | 32.9 | 32.0 | L 04/95 ? | ||||
| 12 | 24 | 09.80 | +28 | 35 | 10.3 | 0.40 | 19.82 | 0.84 | 77 | 74 | 18.6 | 297.8a | L 04/95 Gal (em.) | |||
| 12 | 39 | 14.99 | +40 | 49 | 55.2 | 1.31 | 17.55 | 1.02 | 78 | 74 | 65.7 | 70.3 | L 05/96 QSO | |||
| 13 | 01 | 56.57 | +29 | 04 | 55.7 | 2.29 | 19.19 | 0.44 | 50 | 48 | 97.5 | 103.1 | L 04/95 QSO | |||
| 13 | 24 | 57.44 | +32 | 51 | 46.2 | 1.74 | 17.91 | 1.21 | 92 | 92 | 57.6 | 56.7 | L 05/96 QSO | |||
| 13 | 26 | 13.76 | +28 | 51 | 43.6 | 1.29 | 18.14 | 0.69 | 31 | 46 | 20.9 | 36.8 | L 04/95 QSO | |||
| 14 | 08 | 35.27 | +36 | 17 | 59.7 | 18.28 | 0.31 | 82 | 79 | 128.3 | 133.3 | L 05/96 featureless | ||||
| 14 | 13 | 13.65 | +41 | 16 | 37.8 | 2.61 | 17.71 | 0.34 | 35 | 33 | 26.7 | 30.3 | L 05/96 QSO | |||
| 14 | 36 | 27.24 | +41 | 29 | 31.6 | 0.17* | 18.77 | 1.63 | 41 | 38 | 45.6 | 53.6 | L 05/96 Gal | |||
| 14 | 45 | 27.10 | +30 | 51 | 28.6 | 0.42 | 19.01 | 0.57 | 35 | 107 | 6.3 | 12.7 | L 04/95 Gal (em.) | |||
| 15 | 36 | 27.97 | +37 | 42 | 05.9 | 19.53 | 1.00 | 41 | 49 | 47.0 | L 05/95 featureless | |||||
| 17 | 03 | 22.63 | +38 | 59 | 29.0 | 1.08 | 18.33 | 1.56 | 52 | 49 | 97.4 | 104.9 | L 05/96 QSO | |||
| 17 | 07 | 35.97 | +35 | 39 | 50.0 | 16.66 | 0.51 | 53 | 51 | 100.1 | L 05/96 featureless | |||||
* uncertain redshift.
a The source has complex structure in the FIRST map. The
FIRST flux given is the flux of the central component only. The NVSS
flux is the sum of 4 components within , the most central of which
has S=110.6mJy.
5.1 The new sample of quasars
A summary of the six quasars in the sample to date is given in Table 4, their spectra are shown in Figure 5 and finding charts are given in Figure 6. Note that the spectra obtained at Keck (0847+3831 and 0902+3957) have been corrected for atmospheric absorption bands while the others have not. The spectrum of 0933+2845 (, Gregg et al 1996) was obtained at Lick on 1995 July 3 as part of the FBQS. 1258+2909 was re-observed at Lick 3m on 1996 March 15 to obtain a higher signal-to-noise spectrum. This spectrum, rather than the discovery spectrum, is shown in Figure 5.
| E | /mJy | Comments | ||||||
|---|---|---|---|---|---|---|---|---|
| 0847+3831 | 3.18 | 17.55 | 1.37 | 0.31 | 124 | Keck 03/97 | ||
| 0902+3957 | 3.08 | 0.83 | 17.56 | 1.24 | 0.14 | 31 | Keck 03/97 | |
| 0933+2845 | 3.42 | 0.27 | 17.50 | 1.27 | 0.16 | 66 | Previously known, Gregg et al 1996 | |
| 1258+2909 | 3.47 | 0.32 | 18.52 | 2.06 | 0.48 | 32 | Lick 04/95 | |
| 1340+3754 | 3.10 | 0.08 | 17.85 | 1.68 | 0.85 | 305 | Previously known, Hook et al 1995 | |
| 1523+3814 | 3.15 | 18.38 | 1.40 | 0.40 | 27 | Lick 05/96 |
Notes
1 based on J2000 position
Two radio-loud quasars are known to lie within the survey area but were not found by this survey. FBQS J1021+3001 with (Gregg et al 1996) is in the FIRST catalogue but is below the flux limit used in this search. B3 1239+376 with (Vermeulen et al. 1996) is optically fainter than the limit of the APM scans.


6 Conclusions
In this paper we have described a survey for high redshift radio-loud quasars with a limiting flux density of 25mJy, about a factor of 10 fainter than previous surveys. This survey has become feasible because of new accurate positions for large numbers of faint radio sources supplied by the VLA FIRST survey. Six quasars have so far been found in an area of 0.49sr ( sq deg), after completing follow up for of the spectroscopic sample. The effective area covered so far is thus square degrees. Therefore we find a surface density of flat-spectrum quasars of one per 190 square degrees to a radio flux limit of mJy and an optical limit of E=19.5mag. After completion of the spectroscopic observations the new sample will be used in an analysis of the space density of quasars at high redshift.
ACKNOWLEDGMENTS
IMH acknowledges a PPARC/NATO fellowship and RGM thanks the Royal Society for support. This research has made use of the NASA/IPAC Extragalactic Database (NED) which is operated by the Jet Propulsion Laboratory, Caltech, under contract with the National Aeronautics and Space Administration. Some observations described in this paper were obtained at the Keck-II 10m telescope of the California Association for Research in Astronomy. We thank Daniel Stern, Lisa Storrie-Lombardi, Robert Knop and Saul Perlmutter for assistance with the observations.
References
- [1] Becker R. H., Gregg M. D., Hook I. M., McMahon R. G., White R. L., Helfand D. J., 1997, ApJ, 479, L93
- [2] Becker R. H., White R. L., Edwards A. L., 1991, ApJS, 75, 1
- [3] Becker R. H., White R. L., Helfand D. J., 1995, ApJ, 450, 559
- [4] Condon J., Cotton W. D., Greisen E. W., Yin Q. F., Perley R. A., Broderick J. J, 1994, in Astronomical Data Analysis Software & Systems III, ASP, ed. Crabtree D. R. et al., 155
- [5] Crampton D., Cowley A. P., Hartwick F. D. A., 1990, AJ, 100, 47
- [6] Fall S.M., Pei Y., 1993, ApJ, 402, 479
- [7] Foltz C., Weymann R., Peterson B. M., Sun L., Malkan M. A., Chaffee F. H., 1986, ApJ, 307, 504
- [8] Gregory P.C., Condon J.J., 1991, ApJS, 75, 1011
- [9] Gregg M. D., Becker R. H., White R. L., Helfand D. J., McMahon R. G., Hook I. M., 1996, AJ, 112, 407
- [10] Hook I.M, McMahon R.G., Irwin, M. J., Hazard, C., 1996, MNRAS, 282, 1274
- [11] Hook I.M., McMahon R.G., Patnaik A.R., Browne I.W.A., Wilkinson P.N, Irwin M.J., Hazard C., 1995, MNRAS, 273, L63
- [12] Hook I.M., McMahon R.G, 1998, MNRAS, 294, L7
- [13] Huchra J.P., Geller M. J., Corwin H. G., 1995, ApJS, 99, 391
- [14] Shaver P.A., Wall J.V., Kellermann K.I., Jackson C.A., Hawkins M.R.S, 1996, Nat 384, 439
- [15] Vermeulen R., Taylor, G. B., Readhead, A. C. S., Browne, I. W. A., 1996, AJ, 111, 1013
- [16] Vigotti M., Vettolani G., Merighi R., Lahulla J. F., Lopez-Arroyo M., 1990, A&ASS, 83, 205
- [17] Wampler E. J., Gaskell, C. M., Burke W. L., Baldwin J. A., 1984, ApJ, 276, 403