Detection of the near-infrared counterpart of GRB 971214 3.2 hours after the gamma-ray event.††thanks: Based on observations carried out at the German-Spanish Astronomical Center, Calar-Alto, operated by the Max-Planck-Institut für Astronomie, Heidelberg, jointly with the Spanish National Commission for Astronomy.
Abstract
We report the detection of the GRB 971214 counterpart in the near-infrared by means of two images in the K′-band taken at Calar Alto only 3.5 and 5 hours after the gamma-ray event. We detect the transient at K′= and K′= respectively. Our data seem to indicate the existence of a plateau with duration hours (between 3.5 and 10.2 hours after the high-energy event). Moreover the power-law decline should be steeper than the one given by the index . There is also a change in the slope of the broad-band spectrum at some wavelength between the J and K′ bands (possibly around the H-band).
Key Words.:
Gamma rays: bursts - Methods: observational1 Introduction
After 31 years since the discovery of gamma-ray bursts (GRBs), the origin of such brief gamma-ray flashes remains unknown. The observed isotropy of GRBs in the sky, could only be explained by theoretical models where GRBs originate either in a extended halo around the Galaxy or arise from sources at cosmological distances. Before the launch of the BeppoSAX satellite, the poor localization capability of the GRB detectors made the searches at other wavelengths unfruitful.
The breakthrough took place in 1997 when the first X-ray afterglows were observed by the BeppoSAX, RXTE, ROSAT and ASCA satellites (Costa et al. 1997, Heise et al. 1997a, Marshall et al. 1997, Greiner et al. 1998, Murakami 1998). They were able to localize the fading X-ray emission that followed the more energetic gamma-ray photons once the GRB event had ended. This emission (the afterglow) extends to longer wavelengths, and the good accuracy in the position determination by BeppoSAX (typically radius error boxes) has led to the discovery of the first optical counterparts for GRB 970228 (van Paradijs et al. 1997, Guarnieri et al. 1997), and GRB 970508 (Bond 1997, Djorgovski et al. 1997, Castro-Tirado et al. 1998), greatly improving our understanding of these puzzling sources. The measurement of the redshift for the GRB 970508 optical counterpart (Metzger et al. 1997) has established that one GRB, maybe all, lie at cosmological distances.
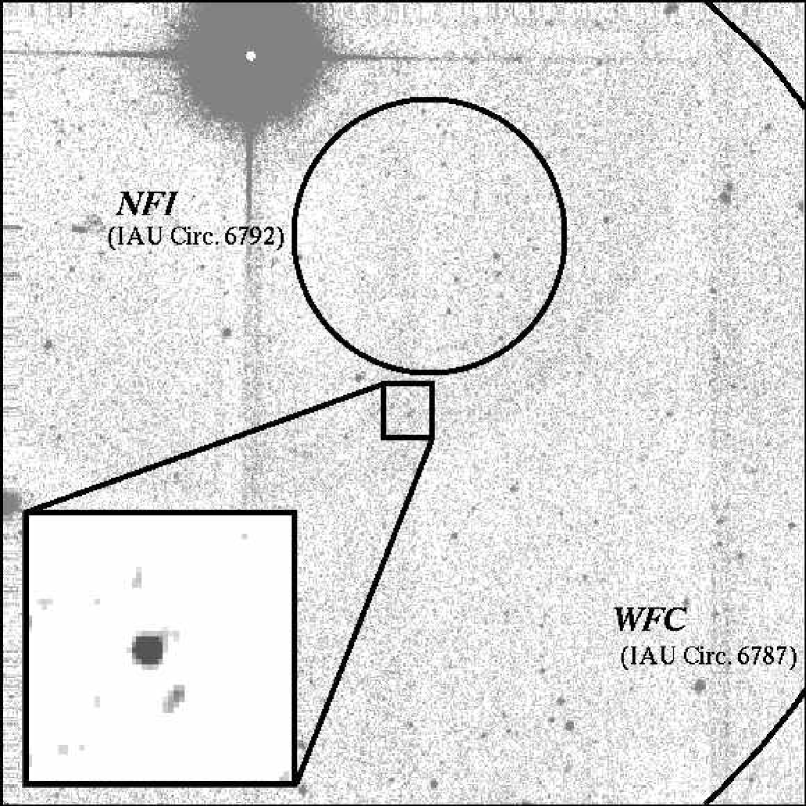
GRB 971214 is the third GRB with a known optical counterpart. It was detected by the BeppoSAX Gamma-ray Burst Monitor (GBM, Frontera et al. 1997) on Dec 14.97 1997, as a 25 s long-structured gamma-ray burst. Simultaneous to the detection of the GBM, the Wide Field Cameras (WFC, Jager et al. 1997) on board BeppoSAX provided an accurate position (a radius error box at a 3 confidence level, Heise et al. 1997b) that allowed deep optical, infrared and radio observations. The position was also consistent with the one given by the all-sky monitor on RXTE (Bradt et al. 1993) and by the BATSE/Ulysses annulus (Kippen et al. 1997). When BeppoSAX pointed its Narrow-Field Instruments (NFI) to the GRB position, on Dec 15.25 ( 6.5 hours after the burst), a previously unknown variable X-ray source was found inside the WFC error box (Antonelli et al. 1997) which was identified as the X-ray afterglow of GRB 971214. Soon after, Halpern et al. (1997) reported the presence of a fading object inside the WFC GRB error box, based on two I-band images separated 24 hours. The object was afterwards confirmed as the counterpart of GRB 971214 by means of additional observations at other wavelengths: R-band (Castander et al. 1997, Diercks et al. 1998), I-band (Rhoads 1997) and J-band (Tanvir et al. 1997). No detections in the K-band were reported in the literature, although observations performed on Dec 15.54 imposed an upper limit of K 18.5 (Garcia et al. 1997). As it will be explained later, this upper limit will be used to constraint the power-law index and the position of the possible maximum of the light curve.
We report here the detection of the GRB 971214 counterpart in the near infrared (IR) by means of two K′-band images taken at Calar Alto on Dec 15.12 and 15.18 (mean observing time, only 3.5 and 5 hours after the gamma-ray event). The second image is almost simultaneous to the beginning of the observations performed by the BeppoSAX narrow-field instruments. We discuss whether our observations are in agreement with the extrapolation of the power-law seen at other bands in later epochs.
2 Observations and analysis
The observations were obtained in the K′-band (Wainscoat and Cowie 1992) with the 3.5-m telescope (equipped with Omega) at the German-Spanish Calar Alto observatory. Omega is a near-IR detector with a 1024 1024 pixel HgCdTe array. The image scale is 0.4′′/pixel giving a field of view of 6.8 6.8 arcminutes (Bizenberger et al. 1998). Each image consists of 20 different frames forming a mosaic on the sky in order to avoid problems due to bad pixels and cosmic rays. Each frame is the co-addition of 10 images (3-second exposure time each), see Table 1 for details. The two sets of mosaics were started and hours after the GRB. Unfortunately no observations could be obtained on Dec 16 (the day after our measurements) due to bad weather thus preventing a prompt identification of the near-IR counterpart.
| Date | Number | Total exposure | K′ limiting |
|---|---|---|---|
| of observations | of frames | time (s) | magnitude |
| Dec 15.1076-15.1232 | 20 | 600 | 19.8 |
| Dec 15.1716-15.1875 | 20 | 600 | 19.5 |
Images were calibrated using the UKIRT faint standard FS17 (Casali and Hawarden 1992), which was imaged immediately after the first GRB mosaic. Since a K-standard star was used in the calibration, the value of K-K′ measured for the GRB depends upon the difference in spectral shape between the standard star and the GRB transient. Since the transient is fairly blue (optical spectral index 0) like the standard star, then K-K0 also for the transient. In fact, the maximum error in the value of K-K′ is magnitudes (Wainscoat and Cowie 1992), i.e. not significant compared to the other photometric errors. The optical transient reported by Halpern et al. (1997) is clearly detected in both images, and , respectively, over the limit (see Fig. 1). The short time span between both observations ( 1.5 hours) makes it difficult the calculation of the slope of the light curve. Photometry of the object yields K′= for the first observation and K′= for the second one. Therefore the brightness difference between 3.5 and 5 hours after the burst is K magnitudes. Astrometry of the near-IR counterpart gives (equinox 2000.0), which is consistent with the optical position reported by Halpern et al. (1997).
3 Discussion
Prompt follow up observations are extremely important in order to monitor the GRB afterglow at early stages, which enables to test the validity of the different afterglow models. In fact, we know now that afterglows are not always remnants of the initial burst (see Piro et al. 1998). Observations performed shortly after the GRBs, allowed to measure the delay between the gamma-ray and the optical emissions in GRB 970228 and GRB 970508, for which the optical maxima were reached 0.7 and 2 days after the gamma-ray event, respectively. This appears not to be the case for GRB 971214, for which no optical maximum was detected according to optical observations started only 12 hours after the gamma-ray emission (Halpern et al. 1997). Therefore the analysis of the K′-band data presented in this study, collected 3.5 and 5 hours after the event, is crucial in order to determine whether a delayed emission, at other wavelengths, following GRB 971214 was present.
3.1 Multiwavelength spectrum of GRB 971214
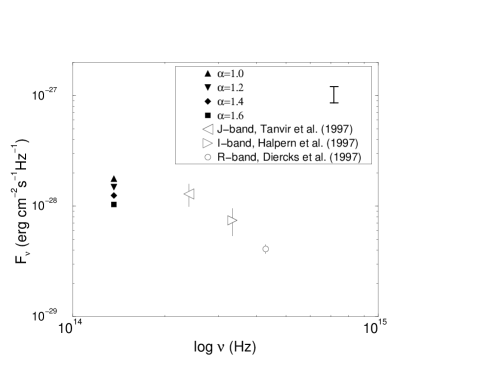
Our observations in the K′-band complete the measurements for the GRB 971214 afterglow at other wavelengths (J, I, R and X-rays) and are almost simultaneous to the observation performed with the NFI on board BeppoSAX, 6.5 hours after the burst (Antonelli et al. 1997). This fact enables us to calculate the near-IR to X-ray (2-10 KeV) flux ratio 5-6.5 hours after the GRB, . Taking into account the measurements performed at other wavelengths on Dec 15.44-15.51, and extrapolating our second observation with power-law decays ranging from to , the measured rough broad-band spectrum (IR-optical) of the GRB 971214 afterglow can be obtained (see Fig. 2). As it can be seen in this figure, the shape of the measured flux density distribution vs depends on the power-law index assumed for the light curve. Thus, if the multiwavelength spectrum of the GRB 971214 afterglow would show a maximum in the near-IR. This possible maximum around the J-band has not been detected in previous multiwavelength spectra of GRB 971214 due to the lack of measurements in the -band (Reichart 1998).
3.2 Study of the light curve
According to the fireball models, the afterglow radiation will shift progressively to lower frequencies and the corresponding timescales will lengthen (Katz and Piran 1997). Therefore, the K′-band measurements impose, over the available data, the most stringent limits to a possible maximum in the light curve of the GRB 971214 afterglow. Three possible light curve shapes can fit our data: a rising light curve (case 1) similar to that detected for GRB 970228 (Guarnieri et al. 1997, Pedichini et al. 1997) and GRB 970508 (Pedersen et al. 1998, Galama et al. 1998), a plateau phase (case 2), as it was seen in GRB 970508 between 4 and 24 hours after the burst (Castro-Tirado et al. 1998), or a power-law decay (case 3) as it was later reported for both GRB 970228 (Galama et al. 1997) and GRB 970508 (Sokolov et al. 1998).
3.2.1 Non fading light curve
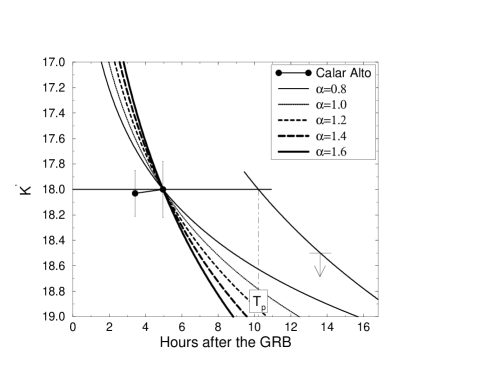
In case of a rising light curve (case 1) or a plateau (case 2) the light curve could not extend, following the same trend, until Dec 15.54, giving the upper limit of K 18.5 imposed by Garcia et al. (1997) (see Fig. 3).
Even an increasing curve until a time near Dec 15.54 followed by a very sharp bending over would be unrealistic. We have estimated the acceptable time for this turning in the following way: first we have assumed that the light curve displayed a plateau phase (at K) from Dec 15.18 onwards; then we have constructed a curve with a power-law decline index that matches the Garcia et al. (1997) measurement on Dec 15.54. The intersection between the constant light curve (initial phase) at K′=18.0 and the power-law fading light curve provides an upper limit for the time of the turnover point, Tp (see Fig. 3). On the other hand, if we assume an increasing light curve crossing our two data points at Dec 15.12 and Dec 15.18, the intersection with the power-law would move slightly backwards. Lower values of would also give lower values of Tp in all cases. We have not considered larger (unrealistic) values of . So, we conclude that the possible maximum or turning point took place Tp=10.2 hours after the gamma-ray event, at the latest.
3.2.2 Fading light curve
If we assumed a single-fading light curve (case 3) with a power-law decline in the near-IR with index (as used by Waxman (1997) and similar to the other two optical counterparts) a variation K′ between our images taken 1.5 hours apart of K magnitudes would be expected. However, our data imply a magnitude difference K, which is from the above mentioned prediction derived from the power-law (see Fig. 3). If the assumed power-law index were the rejection level would be , being necessary a power-law index (too unrealistic) in order to find a disagreement at a level between our points and the prediction of a power-law decay. The power-law light curve connecting our second measurement 5.0 hours after the gamma-ray event and the upper limit imposed by Garcia et al. (1997), would have an index . Therefore, power-law decays with indices are ruled out, because they imply a magnitude on Dec 15.54, which would be above the reported upper limit.
4 Conclusions
We have detected the GRB 971214 near-IR counterpart 3.5 hours and 5 hours after the gamma-ray event which enables to conclude that:
i) a magnitude difference K is derived from our measurements, whereas K would be expected assuming a power-law decay with index (similar to the one observed at optical wavelengths). This implies a deviation of . If the assumed power-law index were 1.4, then the rejection level would be . Thus, our measurements suggest a rising or a flat light curve segment with a duration hours (between 3.5 and 10.2 hours after the burst). This conclusion must be taken with care since the above-mentioned rejection levels are not stringent enough to assure the result with total confidence;
ii) the power-law decline in the near-IR should be steeper than the one given by ;
iii) for the observations carried out on Dec 15.44-15.51, there is a change in the slope of the measured energy distribution at some wavelength between the J and K′ bands (possibly around H).
5 Acknowledgments
We thank A. Fruchter, B. Montesinos and E. Pian for fruitful conversations. This work has been partially supported by Spanish CICYT grant ESP95-0389-C02-02.
References
- (1) Antonelli, L.A., Butler, R.C., Piro, L. et al. 1997, IAU Circ. 6792.
- (2) Bizinberger, P., McCaughrean, M., Birk, Ch., Thompson, D., Storz, C. 1998, SPIE 3354 “Astronomical Telescopes and Instrumentation”, A.M. Fowler, Ed. (in press).
- (3) Bond, H.E. 1997, IAU Circ. No. 6654.
- (4) Bradt, H.V., Rothschild, R.E & Swank, J.H. A&AS 1993, 97, 355.
- (5) Casali, M.M. & Hawarden T.G. 1992, JCMT-UKIRT Newsletter, No 3, 33.
- (6) Castander, F.J., Wyse, R., Gilmore, G. et al. 1997, IAU Circ. 6791.
- (7) Castro-Tirado, A.J., Gorosabel, J., Benítez N. et al. 1998, Sci 279, 1011.
- (8) Costa E., Frontera F., Heise J. et al. 1997, Nat 387, 783.
- (9) Diercks A.H., et al. 1998, ApJ submitted, (astro-ph 9803305).
- (10) Djorgovski, S.G., Metzger, M.R., Kulkarni, S.R. et al. 1997, Nat 387, 876.
- (11) Frontera, F., Costa E., Dal Fiume, D. et al. 1997, A&AS 122, 357.
- (12) Garcia, M.R., Muench A., Tollestrup, E., Callanan, P.J. & McCarthy, J. 1997, IAU Circ. 6792.
- (13) Galama, T.J., Groot, P.J., van Paradijs, J. et al. 1997, Nat 387, 479.
- (14) Galama, T.J., Groot, P.J., van Paradijs, J. et al. 1998, ApJ 497, L13.
- (15) Greiner J., 1998, Frascati workshop on Multifrequency behaviour of high energy cosmic sources, eds. F. Giovanelli and L. Sabau-Graziati, Vulcano, May 1997, Mem. Soc. It. Fis. (in press).
- (16) Guarnieri, A., Bartolini, C., Masetti, N. et al. 1997, A&A 328, L13.
- (17) Halpern, J., Thorstensen, J., Helfand, D. & Costa, E. 1997, IAU Circ. 6788.
- (18) Heise, J., in‘t Zand, J., Costa, E. et al. 1997a, IAU Circ. 6654.
- (19) Heise, J., in‘t Zand, J., Spoliti, G. et al. 1997b, IAU Circ. 6787.
- (20) Jager, R., Mels, W.A., Brinkman, A.C. et al. 1997, A&AS 125, 557.
- (21) Katz, J.I. & Piran, T. 1997, ApJ 490, 772.
- (22) Kippen, R.M., Woods, P., Connaughton, V. et al. 1997, IAU Circ. 6789.
- (23) Marshall, F.E., Takeshima, T., Barthelmy, S.D., Robinson, C.R. & Hurley, K. 1997, IAU Circ. 6683.
- (24) Metzger, M.R., Djorgovski, S.G., Kulkarni, S.R. et al. 1997, Nat 387, 879.
- (25) Murakami, T. 1998, 4th Huntsville Gamma-ray Burst Symposium proceedings, eds: C.A. Meegan, R. Preece, T. Koshut, AIP, in press.
- (26) Pedersen, H., Jaunsen, A.O., Grav, T. et al. 1998, ApJ 496, 311.
- (27) Pedichini, F., Di Paola, A., Stella, L. et al. 1997, A&A 327, L36.
- (28) Piro, L., Amati, L., Antonelli, L.A. et al. 1998, A&A 331, L41.
- (29) Reichart, D.E. 1998, submitted to ApJ, (astro-ph/9801139).
- (30) Rhoads, J. 1997, IAU Circ. 6793.
- (31) Sokolov, V.V., Kopylov, A.I., Zharikov, S.V. et al. 1998, A&A in press, (astro-ph/9802341).
- (32) Tanvir, N., Wyse, R., Gilmore, G., & Corson, C. 1997, IAU Circ. 6796.
- (33) van Paradijs J., Groot P.J., Galama T. et al. 1997, Nat 386, 686.
- (34) Wainscoat, R.J. & Cowie, L.L. 1992, AJ 103, 332.
- (35) Waxman, E. 1997, IAU Circ. 6794.