13 (13.07.1; 13.25.1;) 11institutetext: Istituto Tecnologie e Studio Radiazioni Extraterrestri, CNR, Via Gobetti, 101, 40129 Bologna, Italy 22institutetext: Dipartimento di Fisica, Università di Ferrara, Via Paradiso, 11, 44100 Ferrara, Italy 33institutetext: Astrophysikalisches Institut Potsdam, 14482 Potsdam, Germany 44institutetext: BeppoSAX Scientific Data Centre, c/o Nuova Telespazio, Via Corcolle 19, 00131 Roma, Italy 55institutetext: Istituto di Astrofisica Spaziale, CNR, Via E. Fermi, 00044 Frascati, Italy 66institutetext: Astrophysics Division, Space Science Department of ESA, ESTEC, NL-2200 AG Noordwijk, The Netherlands 77institutetext: Max-Planck-Institute fuer Extraterrestrische Physik, 85740 Garching, Germany
F. Frontera:filippo@tesre.bo.cnr.it
High resolution imaging of the X-ray afterglow of GRB970228 with ROSAT
Abstract
We report results of a ROSAT High-Resolution Imager (HRI) observation of the X-ray error box given by the BeppoSAX Wide Field Camera for the gamma-ray burst that occurred on 1997 February 28. The observation started 10 days after the burst and ended three days later, with a total exposure of 34.3 ks. An X-ray source was detected within the 3′ WFC error box and its position determined with a 10′′ radius accuracy. The source position is in the BeppoSAX Narrow Field Instrument source error box and is coincident (to within 2′′) with the optical transient associated with GRB970228. This is the most precise position obtained for an X-ray afterglow and confirms that the X-ray and optical afterglows have the same origin. We present the 0.1–2.4 keV combined HRI and BeppoSAX Low-Energy Concentrator Spectrometer decay light curve which can be well fit with a power-law. The decay is consistent with that measured at higher energies (2–10 keV) with the BeppoSAX Medium-Energy Concentrator Spectrometer.
keywords:
Gamma-rays: bursts; Gamma-rays: observations; X-rays:observation; X-rays: sources1 Introduction
Observations of celestial Gamma-Ray Bursts (GRB) performed over the last 25 years had not, until recently, succeeded in finding counterparts in other wavelength bands. The ability of the BeppoSAX satellite to provide arc minute precision positions (Piro et al. 1998) and to observe these positions within hours of the GRB changed this situation in 1997 when the X-ray afterglow of GRB970228 was measured (Costa et al 1997a). The burst was detected (Costa et al. 1997a) with the Gamma-Ray Burst Monitor (GRBM) (40–70 keV, Frontera et al. 1997a) on 1997 February 28.123620 UT and also detected in the 1.5–26 keV energy range by one of the two Wide Field Cameras (WFC No. 1) aboard the same satellite (Jager et al. 1997). Its position was determined with an error circle of 3 arcmin (3) radius, centered on , . Eight hours after the GRB trigger, from February 28.4681 to February 28.8330 UTC, the Narrow Field Instruments (NFI) on board BeppoSAX (Boella et al. 1997a) were pointed to the WFC error box. An X-ray source, SAX J0501.7+1146, was detected (Costa et al 1997b) in the field of view of both the Low Energy (0.1–10 keV) and Medium Energy (2–10 keV) Concentrators Spectrometers (LECS and MECS) (Parmar et al. 1997; Boella et al. 1997b). The source position (, ) is consistent with the GRB error circle. The source was again observed about three days later, from March 3.7345 to March 4.1174. During this observation, the 2–10 keV source flux had decreased by about a factor 20, while in the 0.1–2 keV energy range the source was not detected. Following the discovery of the GRB, searches for radio and optical counterparts to GRB970228 were conducted with most of the ground based telescopes in the northern hemisphere. Groot et al. (1997) reported the discovery of an optical transient at a position (, ), consistent with both the BeppoSAX WFC and NFI error boxes and with the long baseline timing Ulysses/BeppoSAX and Ulysses/Wind error annuli, of 31′′ and 30′′ half-width, respectively (Hurley et al. 1997; Cline et al. 1997). While the association of the transient X-ray source with the afterglow of GRB970228 was compelling on the basis of the properties of its decay curve when extrapolated backwards to the burst time (Costa et al. 1997c), the association of the optical transient with the burst afterglow was less strong. In spite of the positional consistency and temporal behaviour of the optical transient, it was not possible to exclude the possibility that the optical transient was unrelated to the GRB (see discussion by van Paradijs et al. 1997), like in the case of the radio source discovered in the earliest error box of GRB970111, which showed a time behaviour consistent with that expected from radio afterglows of GRBs, but later resulted to be unrelated tho the burst (Frail et al. 1997). The ROSAT satellite, thanks to its HRI focal plane instrument, offered the possibility of imaging the X-ray afterglow at 10′′ angular resolution (David et al. 1997). A Target of Opportunity observation was thus requested and obtained. Here we report on results of that observation and its consequences. Preliminary results were already previously reported (Frontera et al. 1997b).
2 Observation and analysis
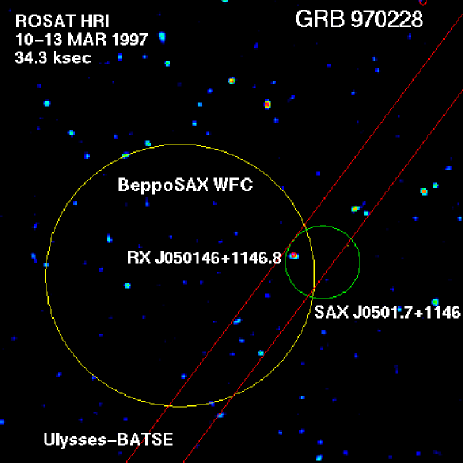
The ROSAT observation started on 1997 March 10 at 18:54:31 UT and ended on March 13 at 07:41:00 UT with a total exposure time of 34.3 ks. The pointing coordinates were and . In the telescope field of view of 20′ radius, eight sources were detected at 3 level in the 0.1–2.4 keV energy band. Of them, one source, RX J050146+1146.9, was found in the 3′ radius error circle given by the BeppoSAX WFC for GRB970228. The other X–ray sources are more than 5′ away from the nominal GRB position. The HRI source position, determined with an error radius of 10′′ (6 confidence level), is centered on and . Figure 1 shows a part of the HRI field of view with superposed the error boxes given by the BeppoSAX WFC and NFIs and the error annulus obtained using the GRB arrival time technique to the BeppoSAX GRBM and Ulysses detectors (Hurley et al. 1997). The plot is a likelihood image which has been obtained by fitting the point spread function of the HRI at a given off-axis angle to the photon source on a grid with 2.5′′ spacing in Right Ascension and Declination (see Greiner et al. (1995) for a more detailed description of the procedure). Since we deal only with the central part of the HRI detector, we have ignored all photons below HRI channel 2 and above HRI channel 12 in order to improve the signal to noise ratio (David et al. 1997). There is only one source with a likelihood larger than 8 (corresponding to 3 ), all other structures in the image are below the 3 significance level. As can be seen, the new HRI source is completely inside the larger error circle obtained with the BeppoSAX LECS and MECS instruments and is coincident with the optical transient within 2 ′′. Using the logN–logS curve obtained with ROSAT (Hasinger 1998), at the sensitivity level achieved in our observation the probability that the ROSAT source is inside the NFI error box (50′′ radius) by chance coincidence is . This shows that the BeppoSAX transient and the ROSAT source are likely the same object. In addition the positional coincidence of the ROSAT source with the optical transient confirms the identification of the optical transient with the X-ray transient.
The source flux was derived using intervals when the background level was lowest. With this constraint the useful observing time is reduced to 10.4 ks (5.3 ks at the beginning of the observation, 4.1 ks after 60 ks of elapsed time, and 1.0 ks just before the end of the observation). The count excess due to the source is (1.0. In order to derive the 0.1–2.4 keV source flux we assume the spectral shape measured for the transient source detected with LECS and MECS during the first BeppoSAX observation of the WFC error box (Frontera et al. 1997c). This assumption is reasonable, taking into account that the spectral hardness of the BeppoSAX source did not appear to change from the first to the second BeppoSAX observation (Frontera et al. 1997c). The spectrum during the first BeppoSAX pointing is consistent with a power-law with photon index and a hydrogen column density of 3.5 (90% confidence single parameter errors). The latter parameter is consistent with the galactic absorption (N) along the source direction. Assuming the estimated column density, we find an absorbed 0.1–2.4 keV flux of (, and an unabsorbed flux of ( in the same energy range. The unabsorbed flux is lower than the ROSAT all-sky survey 1.7 upper limit in the BSAX/WFC error box of GRB970228 (about 9.2, assuming a galactic absorption) (Boller et al. 1997). Thus, there is no evidence of variability from the ROSAT data alone.
3 Discussion
An important issue in the study of GRB afterglows is the shape of their flux decay with time after the initial event as a function of wavelength. Simple versions of fireball models (e.g., Mészáros & Rees 1997) predict that the afterglow decline law is independent of photon energy. Costa et al. (1997c) report on the decay curve of the X-ray afterglow of GRB970228 in the 2–10 keV energy range. They find that the decay is consistent with a power-law (t-α), where t is the time (in seconds) from the burst onset and , for at least 6.9 days after the initial event. Galama et al. (1997) reported a more complex time behavior for the R-band flux of the optical transient associated with GRB970228. For about 6 days from the burst the decay could be approximated by a power-law with a much higher slope () than found in the 2–10 keV energy range, whereas after 6 days . Fruchter et al. (1997), on the basis of a Space Telescope observation of the same source performed six months after the initial event (4 September 1997), found that the optical transient continues to decline according to a power-law with index , with the exception of time period from March 6 to March 13, which determined the result reported by Galama et al.(1997). By combining the ROSAT observation with the BeppoSAX observations, we can study the light curve behavior of the GRB970228 afterglow in a lower energy band (0.1–2.4 keV) and for a longer time (13 days from the initial event) than the observations quoted by Costa et al. (1997c). Figure 2 shows the overall light curve of the source in the 0.1–2.4 keV energy range without any correction for photoelectric absorption. The data points of the first BeppoSAX observation are those obtained with the LECS, while those of the second observation include both the LECS 3 upper limit and the extrapolation to the 0.1–2.4 keV band of the MECS flux measured in the 2–10 keV band, assuming the same spectrum as measured during the first observation. The source decline is fit with a power-law, (t in seconds), with index and (in units of ). Uncertainties are single parameter errors at 90% confidence level. This power-law index is fully consistent with that derived by Costa et al. (1997c) for the contiguous 2–10 keV energy band. No evidence for a cut-off, as predicted by relativistically expanding fireball models when the GRB remnant becomes non relativistic (Wijers et al. 1997), or a slower decline in the flux as observed by Galama et al. (1997) for the same afterglow in the optical band, are evident. The index of the decline power law is marginally consistent with the optical decline slope reported by Fruchter et al. (1997, 1998). The backward extrapolation of the best-fit power-law to the time of the burst (Fig. 3) gives a flux of of 8.4 in the burst time interval 35–80 s from its onset, when the X-ray afterglow is likely to start (Costa et al. 1997c, Frontera et al. 1997c). This value, when compared with the BeppoSAX/ WFC average 2–10 keV flux, in the same burst time interval, of 3.6, is consistent with the extrapolation of the energy spectrum of the burst in the same interval (a power-law with a photon index of for E2 keV, Frontera et al. 1997c).

4 Conclusions
The ROSAT HRI observation of the BeppoSAX WFC error circle of GRB970228 clearly shows the presence of a new X-ray source. Its position within the error box of the BeppoSAX source, the low probability of a chance coincidence () and the better imaging capabilities of the ROSAT HRI compared to the BeppoSAX NFI, indicate that the ROSAT source and the BeppoSAX source are the same object. The source position derived from the ROSAT observation is the most precise position of a GRB X-ray afterglow obtained thus far. Its position is also coincident with the optical transient associated to GRB970228 within 2′′. This result confirms that X-ray source and the optical transient are the same object. The X-ray source hows a 0.1–2.4 keV decline according to a power law decline with index for at least 13 days. This slope is fully consistent with that estimated in the 2–10 keV energy band (Costa et al. 1997c) and is marginally consistent with that reported by Fruchter et al. (1997, 1998) in the optical band. Thus it appears that from the X-ray to the optical band the GRB afterglow has the same decline law.

Acknowledgements.
It is a great pleasure to thank J. Trümper for granting the ROSAT target-of-opportunity time. JG is supported by the German Bundesministerium für Bildung, Wissenschaft und Forschung (BMBF/DLR) under contract No. 50 QQ 9602 3. This research was supported by the Italian Space Agency ASI. The ROSAT project is supported by the BMBF/DLR and the Max-Planck-Society.References
- [1] Boella G., Butler R.C., Perola G.C., et al., 1997a, A&AS 122, 299
- [2] Boella G., Chiappetti L., Conti G., et al, 1997b, A&AS 122, 327
- [3] Boller T., Voges W., Frontera F., et al. , 1997, IAU Circ. 6580
- [4] Cline T.L., Butterworth, P.S., Stilwell, D.E., et al. , 1997, IAU Circ. 6593
- [5] Costa E., Feroci M., Frontera F., et al. , 1997a, IAU Circ. 6572
- [6] Costa E., Feroci F., Piro L., et al. , 1997b, IAU Circ. 6576
- [7] Costa E., Frontera F., Heise J., et al. , 1997c, Nature 387, 783
- [8] David L.P., Harnden F.R., Kearns K.E., and Zombeck M.V., 1997, The ROSAT HRI calibration report, http://hea-www.harvard.edu/rosat/rsdc_www /HRI_CAL_REPORT/hri.html
- [9] Frontera F., Costa E., Dal Fiume D., et al. , 1997a, A&AS 122, 357
- [10] Frontera F., Greiner J., Antonelli L.A., et al. , 1997b, IAU Circ. 6637
- [11] Frontera F., Costa E., Piro L., et al. , 1997c, ApJ, 493, L67
- [12] Fruchter A.S., Livio M., Macchetto D., et al. , 1997, IAU Circ. 6747
- [13] Fruchter, A.S., Pian E., Thorsett S.E., et al. , 1998, Proc. 4th Huntsville Symposium on GRBs, in press.
- [14] Galama T., Groot P.J., van Paradijs J., et al. , 1997, Nature 387, 479
- [15] Greiner J., Boër M., Kahabka P., Motch C., Voges W., 1995, in NATO ASI C450 ”The Lives of the Neutron Stars”, eds. M. A. Alpar et al. , Kluwer Acad. Pub., p. 519
- [16] Groot P.J., Galama T.J., van Paradijs J., et al. , 1997, IAU Circ. 6584
- [17] Hasinger G., 1998, Astron. Nachr. 319, 37
- [18] Hurley K., Costa, E., Feroci F. et al. , 1997, IAU Circ. 6594
- [19] Jager R., Mels W.A., Brinkmann A.C., et al. , 1997, A&AS, in press
- [20] Mészáros P. and Rees M.J., 1997, ApJ 476, 232
- [21] Parmar A.N., Martin D.D.E., Bavdaz M., et al. , 1997, A&AS 122, 309
- [22] Piro L., Heise J., Jager R., Costa E., et al. , 1998, A&A 329, 906
- [23] Van Paradijs J., Groot P.J., Galama T. et al. , 1997, Nature 386, 686
- [24] Wijers R.A.M.J., Rees M.J., Mészáros P., 1997, MNRAS 288, L51