Abstract
Molecules dominate the cooling function of neutral metal-poor gas at high density. Observation of molecules at high redshift is thus an important tool toward understanding the physical conditions prevailing in collapsing gas. Up to now, detections are sparse because of small filling factor and/or sensitivity limitations. However, we are at an exciting time where new capabilities offer the propect of a systematic search either in absorption using the UV Lyman-Werner H2 bands or in emission using the CO emission lines redshifted in the sub-millimeter.
1 Damped Ly systems
1.1 Introduction
QSO absorption line systems probe the baryonic matter over most of the history of the Universe (0 5). The so-called damped Ly (hereafter DLA) systems are characterized by a very large H i column density ((H i) 21020 cm-2), similar to what is usually observed through local spiral disks. The case for these systems to be produced by proto-galactic disks is supported by the fact that the cosmological density of gas associated with these systems is of the same order of magnitude as the cosmological density of stars at present epochs (Wolfe 1996). The presence of heavy elements () and the redshift evolution of metallicity suggest ongoing star formation activities in these systems (Lu et al. 1996, Pettini et al. 1996, 1997). Moreover, strong metal line systems have been demonstrated to be associated with galaxies at low and intermediate (e.g. Bergeron & Boissé 1991). It has also been shown that the profiles of the lines arising in the neutral gas show evidence for rotation (Wolfe 1996, Prochaska & Wolfe 1997). Whether these arguments are enough to demonstrate that DLA systems arise in large disks is a matter of debate however. Indeed simulations have shown that the progenitors of present day disks of galaxies could look like an aggregate of well separated dense clumps at high redshift. The kinematics could be explained by relative motions of the clumps with very little rotation (Haehnelt et al. 1997, Ledoux et al. 1998). Moreover, using HST high spatial resolution images of the field of seven quasars whose spectra contain DLA lines at intermediate redshifts (0.4 1), Le Brun et al. (1997) show that, in all cases, at least one galaxy candidate is present within 4 arcsec from the quasar. There is no dominant morphological type in their sample: three candidates are spiral galaxies, three are compact objects and two are amorphous low surface brightness galaxies. Therefore, although the nature of the DLA systems is unclear they trace the densest regions of the Universe where star formation occurs.
1.2 Molecular hydrogen

It is thus surprising that despite intensive searches, the amount of H2 molecules seems quite low in damped Ly systems in contrast to what is observed in our own galaxy. Two detections of H2 molecules in high redshift DLA systems have been reported. Recently Ge & Bechtold (1997) have found strong absorptions in the = 1.9731 DLA system toward Q 0013–004. They derive (H2) = 6.9 1019 cm-2, = 15 km s-1, 70 K and (H) 300 cm-3 for a total hydrogen column density (H) = 6.41020 cm-2. This system has by far the largest H2 abundance = 2(H2)/[2(H2) + (H i)] 0.220.05 observed in DLA systems. However the exact number should be confirmed using higher resolution data. Other searches have led to much smaller values or upper limits ( 10-6, Black et al. 1987, Chaffee et al. 1988, Levshakov et al. 1992). Table 1 summarizes the caracteristics of damped Ly systems that have been searched for molecules.
Levshakov & Varshalovich (1985) suggested that molecules could be present toward PKS 0528–250 at a redshift ( = 2.8112), slighly larger than the emission redshift of the quasar. This claim has been confirmed by Foltz et al. (1988) using a 1 Å resolution spectrum. The latter authors derive (H2) = 1018 cm-2, = 5 km s-1, = 100 K and log (H i) = 21.10.3. By fitting the damped absorption together with the Ly emission from the quasar, Møller & Warren (1993) find log (H i) = 21.35.
New high resolution data has been recently obtained by Srianand & Petitjean (1998). They estimate the column density of H2 molecules (H2) 61016 cm-2 and the fractional abundance of H2, = 5.410-5 (see Fig. 1). The excitation temperature derived for different transitions suggests that the kinetic temperature of the cloud is 200 K and the density 1000 cm-3. The cloud has therefore a dimension along the line of sight smaller than 1 pc. Since it obscurs the broad-line emission region, its transverse dimension should be larger than 10 pc.
Upper limits are obtained on the column densities of C i ( 1012.7 cm-2) and CO ( 1013.2 cm-2; (CO)/(H i) 710-9). It is suggested that the ratio (H2)/(C i) is a useful indicator of the physical conditions in the absorber. Photo-ionization models show that radiation fields with spectra similar to typical AGNs or starbursts are unable to reproduce all the constraints and in particular the surprizingly small (C i)/(H2) and (Mg i)/(H2) ratios. In view of the models explored, the most likely ionizing spectrum is a composite of a UV-”big bump” possibly produced by a local starburst and a power-law spectrum from the QSO that provides the X-rays. This suggests that the gas is not predominantly ionized by the quasar and that star-formation may occur in the clouds, a conclusion reached as well by Warren & Møller (1996) and Ge et al. (1997). Dust is needed to explain the production of molecules in the cloud. The amount of dust is broadly consistent with the [Cr/Zn] abundance determination.
Tab. 1 - H2 molecules in DLA systems
| Name | 000-263 | 0013-004 | 0100+130 | 0528-250 | 1331+170 | 1337+113 |
|---|---|---|---|---|---|---|
| 4.110 | 2.084 | 2.681 | 2.770 | 2.081 | 2.919 | |
| 3.391 | 1.9731 | 2.309 | 2.811 | 1.776 | 2.796 | |
| (HI) (1021 cm-2 | 2.0 | 0.64 | 2.5 | 2.2 | 1.5 | 0.80 |
| (H2) (1016 cm-2 | 0.3 | 6900 | 0.5 | 6 | … | 5 |
| (10-4) | 0.03 | 2200 | 0.04 | 0.5 | … | 1.3 |
| Levshakov et al. (1992); Ge & Bechtold (1997); Srianand & Petitjean (1998) | ||||||
1.3 Is there a bias against detection of H2 molecules ?
The small number of H2 detections in damped systems is intriguing. Indeed in the interstellar medium of our Galaxy, all the clouds with log (H i) 21 have log (H2) 19 (Jenkins & Shaya 1979). Formation of H2 is expected on the surface of dust grains if the gas is cool, dense and mostly neutral, and from the formation of negative hydrogen if the gas is warm and dust free (see e.g. Jenkins & Peimbert 1997). Destruction is mainly due to UV photons. The effective photodissociation of H2 takes place in the energy range 11.1–13.6 eV, through Lyman-Werner band line absorption.
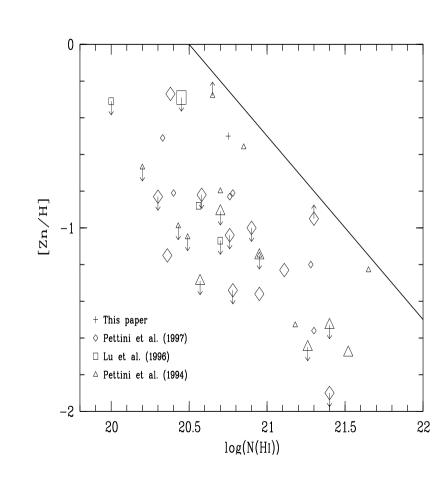
In the DLA system toward PKS 0528-250, (i) abundances are of the order of 0.1 ; (ii) the ratio [Cr/Zn] indicates a depletion factor into dust-grains of the order of half of that in the Galactic ISM; (iii) although it has been shown that the cloud is located at a distance larger than 10 kpc from the quasar, it is still close to it and exposed to its UV flux. Nonetheless, molecular hydrogen is detected. This suggests that indeed, molecular hydrogen should be seen in most of the damped systems. The small number of detections may be explained if observations are biased against the presence of molecules. Indeed it can be speculated that molecules should be found predominantly in gas with a non negligible amount of dust. However the corresponding extinction of the background quasar due to the dust in the damped system could be large enough to drop the quasar out of the sample of quasars that are usually observed for such studies. Boissé et al. (1998) notice that for the damped systems studied up to now, the larger the H i column density, the smaller the abundances (see Fig. 2). This suggests that the high column density DLA systems detected up to now are those with the smallest metallicities and consequently those with the smallest amount of dust. One way to clear up this problem is to observe a complete sample of quasars (if possible constructed without color selection) and to search for high column density damped systems.
2 CO emission in QSOs at high redshift

The initial detection of CO in FIRAS10214+4724 at (Brown & Vanden Bout 1992, Solomon et al. 1992) has been followed by CO detections in H1413+117 (The Cloverleaf) at (Barvainis et al. 1994), and more recently, in 53W002 at (Scoville et al. 1997). In the latter object, CO(3–2) is detected using the OVRO interferometer. This object is interesting because it appears to lie within a cluster of roughly 20 Ly emission line objects, the most distant such cluster known (Pascarelle et al 1996). In addition, CO(3-2) line emission is detected from the gravitationally lensed quasar MG 0414+0534 at redshift 2.64 (Barvainis et al. 1998), using the IRAM Plateau de Bure Interferometer. The line is broad, with vFWHM = 580 km s-1. The velocity-integrated CO flux is comparable to, but somewhat smaller than, that of IRAS F10214+4724 and the Cloverleaf quasar (H1413+117), both of which are at similar redshifts.
It is worth noting that all of the CO-detected objects mentioned above have also been detected in the far-IR (IRAS) or 1 mm/submm continuum. This indicates that these objects also contain large amounts of dust. Indeed, thermal emission has now been convincingly detected at 1.3 mm in 8 QSOs (Barvainis et al. 1992; McMahon et al. 1994; Isaak et al. 1994; Ivison 1995; Omont et al 1996b) and in one radio-galaxy at (Dunlop et al. 1992; Chini & Krügel 1994; Hughes et al. 1997). The strategy thus adopted to detect CO in high-redshift quasars is (i) to search for dust emission toward radio-quiet quasars in the millimeter or submillimeter ranges using single dish telescopes (Omont et al. 1996b); (ii) to follow-up the detections: search for CO emission and mapping the continuum using the IRAM interferometer (Omont et al. 1996a; Guilloteau et al. 1997).
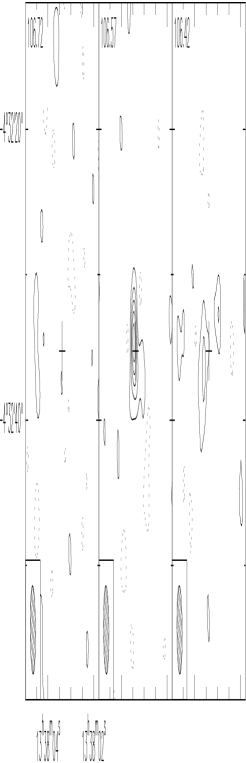
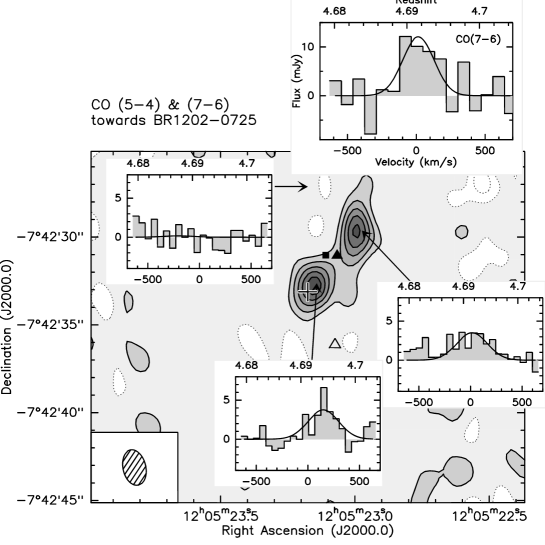
The two strongest 1.3 mm continuum emitters, BR 1202-0725 ( 4.7) and BRI 1335-0415 ( 4.4) have been detected in CO(5-4) with comparable total integrated line intensities (2.40.5, see Fig. 4, and 2.80.3 Jy km s-1, see Fig. 3, respectively). The corresponding mass of molecular gas is of the order of .
Such a jump in the redshift range of millimeter radioastronomy was made possible by: (i) the existence at large redshift of objects with molecular gas and dust contents on the one hand and starburst activity on the other similar to what is observed in the most powerful ultra-luminous IRAS galaxies; (ii) the increase with redshift of the apparent luminosity of a dusty object observed at fixed wavelength; (iii) the existence of gravitational lensing amplification at least in FIRAS10214+4724 and H1413+117. However, since some tentative detections of quasars and quasar absorption line systems have not been confirmed (Wiklind & Combes 1994; Braine, Downes & Guilloteau 1996), the number of detections of CO at remains small.
The detection of CO and dust at millimeter wavelength in a few prominent objects at very large redshift opens the possibility to study the molecular gas in high redshift galaxies. Although at present detections are biased toward highly luminous objects with intense activity (either starbursts or AGN or both), they open the exciting prospect to study more standard objects with the new instrumentation planned to be built soon.
Acknowledgements
The results presented in this papers have been obtained in collaboration with Alain Omont, Stéphane Guilloteau and R. Srianand. I would like to thank the organisers of the meeting for their hospitality and kindness.
References
- 1
- 2 Barvainis, R., Antonucci, R., Coleman, P.: 1992, Astrophys. J. 353, 41.
- 3 Barvainis, R., et al.: 1994, Nature 371, 586.
- 4 Barvainis, R., Alloin, D., Guilloteau, S., Antonucci, R.: 1998, Astrophys. J. 492, 13.
- 5 Bergeron, J., Boissé, P.: 1991, Astron. Astrophys. 243, 344.
- 6 Black, J.H., Chaffee, F.H., Foltz, C.B.: 1987, Astrophys. J. 317, 442.
- 7 Boissé, P., Le Brun, V., Bergeron, J., Deharveng, J.M.: 1998, astro-ph/9801146.
- 8 Braine, J., Downes, D., Guilloteau, S.: 1996, Astron. Astrophys. Lett. 309, L43
- 9 Brown, R.L., Vanden Bout, P.A.: 1992, Astrophys. J. Lett. 392, L11.
- 10 Chaffee, F.H., Black, J.H., Foltz, C.B.: 1988, Astrophys. J. 335, 584.
- 11 Chini, R., Krügel, E.: 1994, Astron. Astrophys. Lett. 288, L33.
- 12 Dunlop, J.S., et al.: 1994, Nature 370, 347.
- 13 Foltz, C.B., Chaffee, F.H.Jr., Black, J.N.: 1988, Astrophys. J. 324, 267.
- 14 Ge, J., Bechtold, J.: 1997, Astrophys. J. Lett. 477, L73.
- 15 Ge, J., Bechtold, J., Walker, C., Black, J.H.: 1997, Astrophys. J. 486, 727.
- 16 Guilloteau, S., Omont, A., McMahon, R., Cox, P., Petitjean, P.: 1997, Astron. Astrophys. Lett. 328, L1.
- 17 Haehnelt, M.G., Steinmetz, M., Rauch, M.: 1997, astro-ph/9706201.
- 18 Hughes, D.H., Dunlop, J.S., Rawlings, S.: 1997, Mon. Not. R. Astr. Soc. 289, 766.
- 19 Isaak, K., et al.: 1994, Mon. Not. R. Astr. Soc. 269, L28.
- 20 Ivison, R.J.: 1995, Mon. Not. R. Astr. Soc. 275, L33.
- 21 Jenkins, E.B., Peimbert, A.: 1997, Astrophys. J. 477, 265.
- 22 Jenkins, E.B., Shaya, E.J.: 1979, Astrophys. J. 231, 55.
- 23 Le Brun, V., Bergeron, J., Boissé, P., Deharveng, J.M.: 1997, Astron. Astrophys. 321, 733.
- 24 Ledoux, C., Petitjean, P., Bergeron, J., Wampler, J., Srianand, R.: 1998, in press.
- 25 Levshakov, S.A., Chaffee, F.H., Foltz, C.B., Black, J.H: 1992, Astron. Astrophys. 262, 385.
- 26 Levshakov, S.A., Foltz, C.B., Chaffee, F.H., Black, J.H: 1989, Astron. J. 98, 2052.
- 27 Levshakov, S.A., Varshalovich, D.A.: 1985, Mon. Not. R. Astr. Soc. 212, 517.
- 28 Lu, L., et al.: 1996, Astrophys. J. Suppl. 107, 475.
- 29 McMahon, R.G., et al.: 1994, Mon. Not. R. Astr. Soc. 267, L9.
- 30 Møller, P., Warren, S.J.: 1993, Astron. Astrophys. 270, 43.
- 31 Ohta, K., et al.: 1996, Nature 382, 426.
- 32 Omont, A., Petitjean, P., Guilloteau, S., McMahon, R., Solomon, P.M.: 1996a, Nature 382, 428.
- 33 Omont, A., et al.: 1996b, Astron. Astrophys. 315, 1.
- 34 Pascarelle, S.M., et al.: 1996, Astrophys. J. Lett. 456, L21.
- 35 Pettini, M., Smith, L.J., King, D.L., Hunstead, R.W.: 1997, astro-ph/9704102.
- 36 Pettini, M., King, D.L., Smith, L.J., Hunstead, R.W.: 1996, astro-ph/9607093.
- 37 Prochaska, J.X., Wolfe, A.M.: 1997, astro-ph/9704169.
- 38 Scoville, N.Z., et al.: 1997, Astrophys. J. Lett. 485, L21.
- 39 Solomon, P.M., Downes, D., Radford, S.J.E.: 1992, Astrophys. J. Lett. 398, L29.
- 40 Srianand, R., Petitjean, P.: 1998, in press.
- 41 Warren, S.J., Møller, P.: 1996, Astron. Astrophys. 311, 25.
- 42 Wiklind, T., Combes, F.: 1994, Astron. Astrophys. 288, 41.
- 43 Wolfe, A.M.: 1996, in ‘QSO absorption lines’, G. Meylan (Ed.), Springer, Garching, p.13.
- 44