The circumstellar shell of the post-AGB star HD 56126: the 12C12C/12C13C isotope ratio and 12C16O column density
Abstract
We have made the first detection of circumstellar absorption lines of the 12C13C (Phillips) system 1-0 band and the 12C16O first-overtone 2-0 band in the spectrum of the post-AGB star HD 56126 (IRAS 07134+1005). All current detections of circumstellar molecular absorption lines towards HD 56126 (12C2, 12C13C, 12C14N, 13C14N, and 12C16O) yield the same heliocentric velocity of km s-1. The 12C2, 12C13C, and 12C16O lines give rotational temperatures and integrated column densities of K, cm-2, K, cm-2, and K, cm-2 respectively. The rotational temperatures are lower for molecules with a higher permanent dipole moment. Derived relative column densities ratios are 12C2/12C13C, and 12C16O/(12C2+12C13C). Combined with data from Paper III we find relative column densities of 12C16O/(12C14N+13C14N) and 12C14N/13C14N.
Under chemical equilibrium conditions, 12C13C is formed twice as easily as 12C2. The isotopic exchange reaction for 12C2 is too slow to significantly alter the 12C2/12C13C ratio and the 12C2 to 12C13C ratio a good measure of half the carbon isotope ratio: 12C/13C=12C2/12C13C=. This is in agreeement with our prediction that the isotopic exchange reaction for 12C14N is efficient and our observation in Paper III of 12C14N/13C14N.
A fit of the C2 excitation model of van Dishoeck & Black (vandishoeckblackmodel (1982)) to the relative population distribution of C2 yields . At cm this translates in cm-3 and M⊙ yr-1.
1 Introduction
HD 56126 (IRAS 07134+1005) is in the post-AGB stage (also referred to as the Pre-Planetary Nebulae stage) of stellar evolution. This is the relative short transition stage from the Asymptotic Giant Branch (AGB) to the White Dwarf (WD) phase (Iben iben (1983)). Low-mass stars (0.8 M M 8.0 M⊙) may experience up to three dredge-up episodes. The first occurs on the Red Giant Branch (RGB). The second on the Early-AGB (E-AGB) is limited to stars with initial masses in the range of 4 to 8 M⊙. The third occurs on the Thermal Pulsating-AGB (TP-AGB). The last dredge-up changes the surface abundances of the star most drastically: most noticeable the carbon and s-process elements abundances enhanced (Forestini & Charbonnel forestinicharbonnel (1997)). Several studies of the photospheric abundance of post-AGB stars have indeed shown that some of these stars are carbon rich and have enhanced abundances of s-process elements (Luck & Bond luckbond (1989); Klochkova klochkova (1995); van Winckel vanwinckel (1997); Reddy et al. reddyetal (1997),reddybakkerhrivnak (1998); Decin et al. denin (1998)). Since AGB stars lose mass through a dense stellar wind, post-AGB stars are surrounded by a shell of material which expands at typically 3 to 30 km s-1. This material constitutes the circumstellar environment (CSE) of the star. The CSE material mixes with interstellar clouds and forms the parent material for the next generation of stars. In this manner, nucleosynthesis products are used to build new stars and the Galaxy is enriched with heavy elements (elements more massive than helium). The study of the chemical structure of the CSE of evolved stars is therefore of importance to understand the chemical enrichment of the Universe.
Stellar evolution theory needs constraints from observations. The 12C/13C suits this goal very well since during the AGB evolution 12C is formed in the helium burning layer, while 13C is formed as a by-product in the hydrogen burning layer. The observed ratio of these two isotopes depends on the efficiency and the relative strength of these two layers, and on the efficiency of the dredge-up processes.
Theoretical models of the chemical structure of the CSE of highly evolved stars have mainly concentrated on understanding the well-studied, and well-observed carbon star IRC +10216 (for references see Olofsson olofsson (1998)). When a star reaches the tip of the AGB, the mass-loss rate has its maximum strength and drops several orders of magnitude after the star leaves the AGB. Material ejected during the AGB phase slowly expands from the star and leaves a cavity in the CSE which will grow with time. Eventually leading to a cavity the size of a planetary nebulae. The elemental composition of the CSE is fixed after the material leaves the surface of the star. In contrast, the molecular composition of the CSE is constantly changing under the influence of the stellar and interstellar radiation fields: molecules are destroyed and formed continuously. Most studies of the CSE make use of molecular line emission in the sub-millimeter and radio (e.g. CO and HCN) while recently the ISO satellite has allowed a study of molecular lines in the infrared. Emission lines of spatially unresolved sources provide no positional information, and only partial velocity information (the radial component). This is obviously not the case for absorption lines since they are formed in a pencil-beam towards the continuum source and probe therefore a well defined region of the CSE. Secondly, a molecular absorption line spectrum has many lines allowing a study of the population of the energy levels of the molecules and processes like optical pumping. Absorption lines therefore yield information additional to that already available from emission line studies. As part of an ongoing effort to study the characteristics of post-AGB stars, we have been studying circumstellar 12C14N and 12C2 lines in the optical spectra of post-AGB stars (referred to as C2CN stars) which show the unidentified 21 m feature (Kwok et al. kwok89 (1989),kwok95 (1995); Hrivnak & Kwok hrivnakkwok (1991); Justtanont et al. justtanont (1996)). These electronic bands allow an accurate determination of the expansion velocity of the CSE, rotational temperature, column density, and molecular column density ratios (Bakker et al. 1996b (Paper I), paperII (1997) (Paper II), Bakker & Lambert paperIII (1998) (Paper III)).
In Paper III we presented measurements of the ratio CN/13CN (from now on C means 12C, N means 14N, and O means 16O). We found a ratio of but argued that the true C/13C ratio is likely closer to owing to the isotopic exchange reaction (). In this paper (IV) we present measurements of the C2/C13C ratio. Combining these two independent isotope ratios allows us to constrain the isotope exchange reaction and give a more accurate determination of the true C/13C ratio in the CSE surrounding HD 56126.
In Sec. 2 we discuss the optical and infrared observations and the source of the data on the equivalent widths used in our analysis. Sec. 3 describes the sources from which we obtained the molecular data (C2, C13C, and CO). Sec. 4 is the analysis and Sec. 5 the discussion.
2 Observations and equivalent widths
2.1 Optical
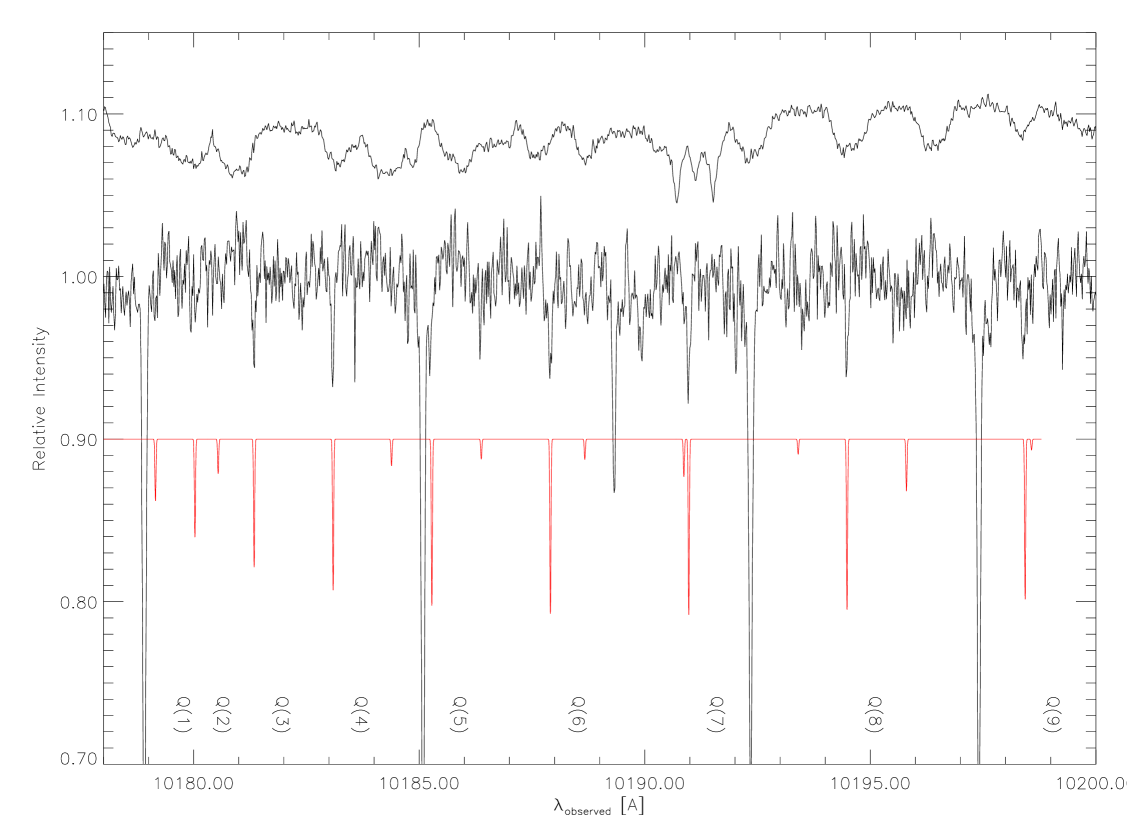
Spectra of the C2 and C13C (Phillips) system 1-0 band have been obtained using the coudé cross-dispersed echelle spectrograph (Tull et al. tull (1995)) of the 2.7 meter Harlan J. Smith telescope of the W.J. McDonald Observatory (Table 1). During three consecutive nights in January 1998, 36 exposures of each 30 minutes on HD 56126 have been made. Each exposure gives a CCD frame (TK3 with pixels) with 18 orders, with each order covering almost 19 Å. A log of the observations is presented in Table 1. Each exposure is individually reduced using the echelle package within IRAF: trimmed, scattered light subtracted, flat fielded, orders extracted, and wavelength calibrated. The 36 spectra are combined on an heliocentric wavelength scale, and finally continuum corrected to obtain the co-added spectrum (Fig. 1). The analysis presented is based on this final co-added spectrum. The spectral resolution, ( wide slit), has been determined from the of the C2 lines where the intrinsic width is expected to be less than the instrumental width. No ThAr lines are available in the order in which C2 occurs, but ThAr lines available in other orders give comparable numbers. In order to be able to remove telluric lines and features that result from fringes on the CCD, we observed the hot star Ori.
An interval 10160-10220 Å was observed that includes the high excitation C2 lines ( to 22) and low-excitation C13C lines ( to 9). Equivalent widths (Table 2) were measured in various ways using the tools available in IRAF/SPLOT.
2.2 Infrared
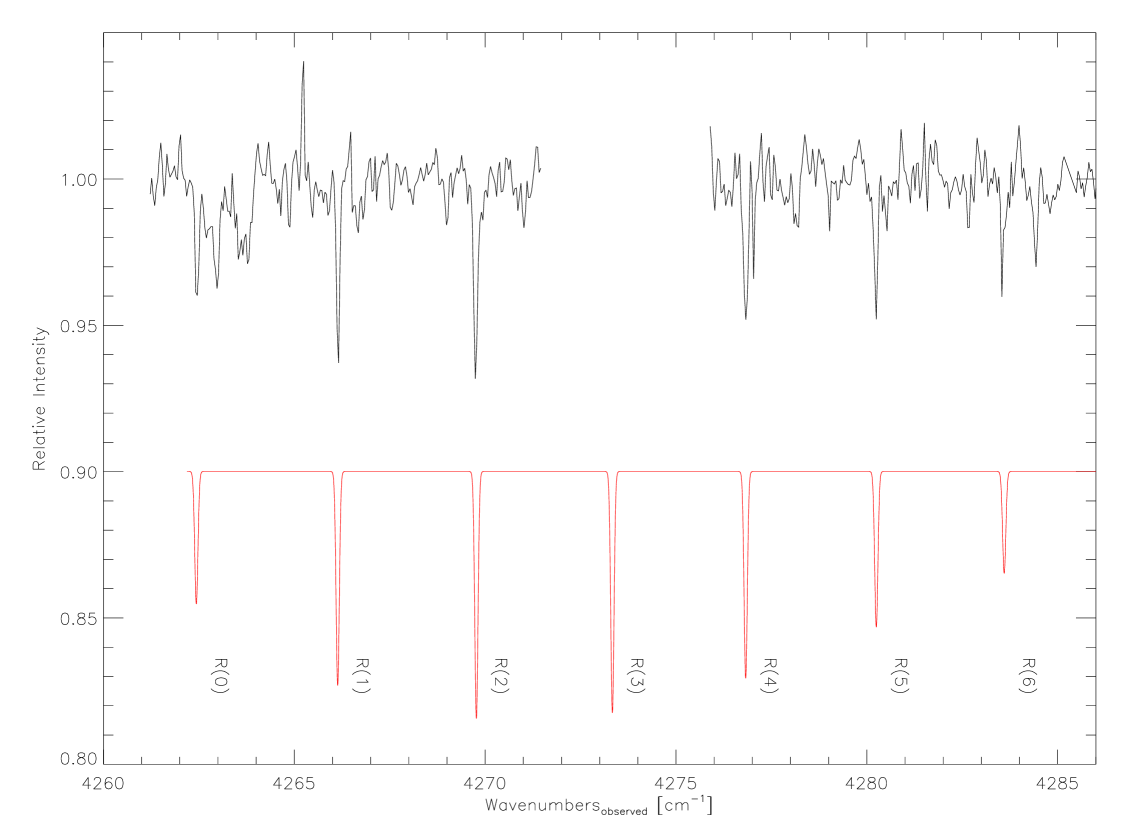
CO first-overtone 2-0 infrared spectra towards HD 56126 were acquired with the 3.0 meter NASA Infrared Telescope Facility (IRTF) on Mauna Kea, Hawaii, using the single-order cryogenic echelle spectrograph CSHELL (Tokunaga et al. tokunagaetal (1990); Greene et al. greeneetal (1993)) (Table 1). Spectra were obtained with a wide slit and (Greene & Denault greenedenault (1994)). The recorded spectrum covers about 10 cm-1. HD 56126 was observed at two settings. One for the 0,1,2 levels, and one the 4,5,6 levels. Observations of were not attempted since this line fell together with a strong telluric feature. In order to remove the sky background, the telescope was nodded east-west between two successive exposures. The hot star HR 2763 ( Gem) was observed to act as a reference spectrum to remove telluric features and instrumental artifacts.
The infrared data were reduced with IRAF. First two successive frames were subtracted to remove the bias and sky background. The result was divided by the flat field minus dark frame. The spectra were extracted and the wavenumber calibration was made on identified telluric lines using rest wavenumbers from the AFCRL absorption line catalog for basic input data (ATMOS program, using software written by E.N. Grossman), in combination with the atlas of Hinkle et al. (hinkleetal (1995)).
The resulting spectrum of HD 56126 was divided by that of the hot star and continuum corrected to obtain the final co-added spectrum (Fig. 2). The analysis presented is based on this final co-added spectrum. Equivalent widths (Table 3) were measured in various ways using the tools available in IRAF/SPLOT, and derived column densities are presented in Table 4, and a log of the observations is presented in Table 1.
3 Molecular data
The software program MOLLEY (Paper III) has been modified and expanded to compute the molecular parameters (line position and line strengths) for the C2 (Phillips) system bands and the CO rovibrational bands (and their isotopes). Given the rotational temperature , integrated molecular column density , Doppler broadening parameter (), and spectral resolution , a synthetic spectrum can be computed.
3.1 C2
C2 wavenumbers are computed from the molecular constants of Marenin & Johnson (mareninjohnson (1970)) and agree very well with the observed wavenumbers by Chauville & Maillard (chauvillemaillard (1977)). Wavenumbers for the isotopes were computed using the standard relations for the mass dependence of the various molecular constants (c.f. Bernath bernath (1995)) and the molecular constants for C2. Wavelengths for C13C (Table 2) have been computed from the wavenumbers by Amiot & Verges (amiotverges (1983)) as measured by Fourier Spectroscopy. Conversion from wavenumber (cm-1 in vacuum) to wavelength (Å in air) was made using the index of refraction of standard air as given by Morton (morton (1991)).
C2 band oscillator strengths for the Phillips system have been determined experimentally, primarily from measurements of the radiative lifetimes of vibrational levels of the A state, and estimated theoretically from quantum chemistry calculations. Unfortunately, experiment and theory are not in completely satisfactory agreement, see for example, the review by Lambert et al. (lambertetal (1995)).
Calculations appear to have converged upon a consistent set of oscillator strengths and radiative lifetimes. Langhoff et al. (langhoffetal (1990)) estimate that their predicted radiative lifetimes are accurate to about 5%. A similar accuracy surely applies to the band oscillator strengths. In our study, we combine observations of lines from the four bands 1-0, 2-0, 3-0, and 4-0 for which the predictions are and by Langhoff et al. (langhoffetal (1990)), by Langhoff (langhoffpc (1996)) and by van Dishoeck (vandishoeck (1983)) (adjusted to the band oscillator strength ratios of Langhoff et al.). Radiative lifetimes from laser pyrolysis and laser-induced fluorescence (Bauer et al. baueretal1 (1985),baueretal2 (1986)) are appreciably longer than the predicted lifetimes implying experimental oscillator strengths that are much smaller than the above estimates. Recent measurements by a different technique give results closer to the theoretical values: Erman & Iwamae (ermaniwamae (1995)) measure, for example, a lifetime of s for vibrational level for which Langhoff et al.’s prediction is s but measurements of and s were reported by Bauer et al. (baueretal1 (1985)) and Bauer et al. (baueretal2 (1986)) respectively. In light of the consistent theoretical results (see Langhoff et al. for references), Erman & Iwamae’s new experiments, and the estimates derived from observations of interstellar C2 absorption lines (Lambert et al. lambertetal (1995)), we adopt Langhoff et al.’s predictions and their assessment of their accuracy in our analysis.
The adopted method to compute line strengths from the band oscillator strength is extensively discussed in Paper I and II, and we refer the interested reader to that paper for all details. In computing the line strength for the transitions of the isotopes of C2 (Table 2 and MOLLEY) we assume that the oscillator strength for the C13C band is the same as for the C2 band. Band heads of cm-1 and cm-1 have been taken from Chauville & Maillard (chauvillemaillard (1977)) and for cm-1 and cm-1 from Ballik & Ramsay (ballikramsay (1963)).
C2 is a homo-nuclear molecule, while C13C is a hetero-nuclear molecule. For C2 only even levels exist (), while odd and even levels exist for C13C (). The electric dipole moment for C2 is strictly zero and therefore pure rotational electric dipole transitions () cannot occur. Electric quadrupole transitions () may occur but with an extremely low probability. The C13C molecule has a very weak electric dipole moment from failure of the Born-Oppenheimer approximation and thus pure rotational transitions are permitted, albeit with a low probability. It is important to realize that the absence of an infrared and sub-millimeter spectrum deprives C2 of a cooling mechanism and the molecule is excited by the stellar and interstellar radiation fields to supra-thermal temperature (). C13C on the other hand has a small dipole moment, and may cool. The population distribution for the two molecules, C2 and C13C, is therefore not necessarily the same and the rotational temperature for C13C may be lower than for C2. By studying these two molecules simultaneously, potentially important information on the conditions within the CSE could be extracted.
3.2 CO
CO wavenumbers are computed from the Dunham coefficients given by Farrenq et al. (farrenqetal (1991)). Wavenumbers for Table 3 are after Pollock et al. (pollocketal (1983)).
Oscillator strength for CO have been computed after Goorvitch & Chackerian (1994a ,1994b ) which have a band oscillator strength for CO of . Oscillator strength of the 2-0 band determined by Kirby-Docken & Liu (kirbydockenliu78 (1978)) is 85% of that of Goorvitch & Chackerian. This leaves us with an absolute uncertainty of at most 15 % on the adopted -value.
4 Analysis
The analysis presented in this paper is based on the spectra listed in Table 1 supplemented with previous data presented in Paper I (C2), II (C2), and III (CN and 13CN), and unpublished data for the C2 4-0 band. Use of this combined set of data assumes that there has been no change of the excitation conditions of the molecules in the interval of a few years.
The identification of the C13C 1-0 and the CO 2-0 bands yield heliocentric velocities of the line forming region of and km s-1. Within the errors, all velocities of circumstellar molecular absorption lines towards HD 56126 (C2 : ; C13C : ; CN : ; 13CN : ; CO : km s-1) yield the same heliocentric velocity for the CSE of km s-1 and successively an expansion velocity of km s-1. The equality of for the various species suggests that their regions of residence overlap considerably.
4.1 Doppler -parameter
In order to derive the column density from the equivalent width of a line, one has to take optical depth effects into account. The C13C and the CO lines are weak and optically thin and their derived column densities (Table 4) are practically independent of the adopted -value. However, many of the C2 lines are optical thick and an accurate determination of the -value is required to computed accurate column densities.
Optical depth effects are quantified by the Doppler -parameter of the line absorption coefficient that determines the extension of the curve of growth beyond the weak-line limit. To determine the shape of the curve of growth and, hence, the -parameter, lines from a single vibrational band may be treated as a single dataset. Such lines have accurate relative -values set by the rotational line strengths (Hönl-London factors). Lines from a given lower () level may be combined immediately to form a part of the curve of growth. This curve for the C2 Phillips bands may consist of up to twelve measured lines: a P, Q, and a R line from each of three 1-0, 2-0, 3-0, and 4-0 bands. This latter step requires that the relative -values of the three bands be known. Sets of lines from different levels may be combined after determining the ratio of the column densities of the levels or equivalently the rotational excitation temperature.
In Paper III, circumstellar lines of the CN Red system were combined to yield the -parameter of km s-1. The derived CN curve of growth is well definied. Particularly worthy to note is the fact that the line sample for almost every rotational level spans almost the entire range of equivalent width from weak unsaturated lines to saturated lines on the shoulder of the curve of growth. Thanks to this circumstance, the derivation of the -parameter and the rotational populations are effectively independent and lead to accurate results. Furthermore, the weak 13CN lines may be compared with rather similar weak CN lines of the same rotational levels such that the CN/13CN ratio is independent of the derived -parameter. The ratio is dependent on the adopted ratio of -values for the Violet and Red system bands. (The derived -parameter is dependent on the relative -values of the CN Red system bands.)
The C2 Phillips system 1-0, 2-0, 3-0, and 4-0 bands do not provide such a happy selection of lines. Lines from the four bands from a given lower () level do not span a large range in equivalent widths. The line selection does not run from weak to saturated lines. This necessarity means that the -parameter cannot be determined independently of the rotational population. It should also be noted that, except for limited measurements of the C2 1-0 lines, the equivalent widths comes from WHT spectra. Comparision for CN lines show that the McDonald spectra provide more accurate equivalent widths then those from the available WHT spectra.
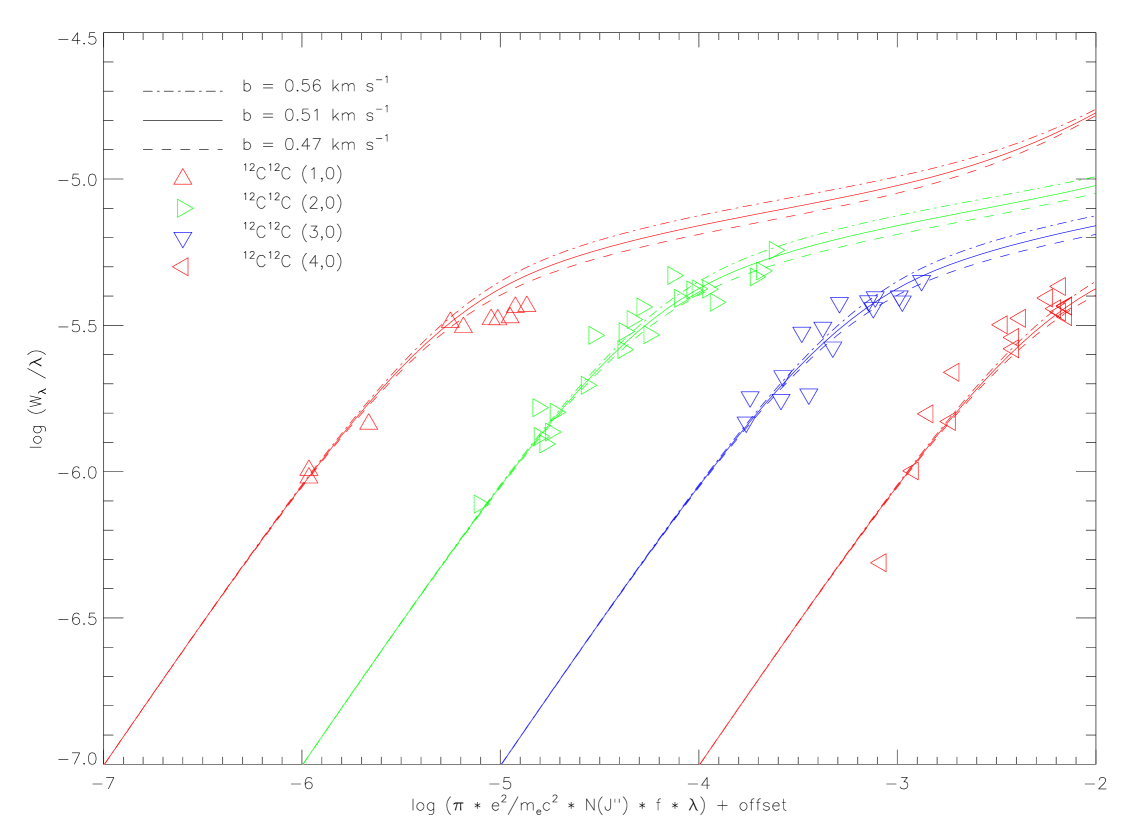
In light of these limitations, we elected to assume that the appropriate -parameter for C2 was the well-determined value found for CN. Curves of growth for the individual C2 bands are shows in Fig. 3 where the column densities are defined using all available lines. This shows clearly that the observed curve of growths of the bands needs to be shifted systematically relative to the theoretical curves. As noted above, this inconsistency between observed and theoretical curves of growth was not found for the CN Red system bands.
Several potential explanations for this problem affecting the C2 curves of growth have been considered. Could the relative -values be at fault? If the -values are considered as the adjustable parameter, the necessary adjustments corresponds to multiplicative factors of 0.62, 0.98, 1.53, and 2.26 for the 1-0, 2-0, 3-0, and 4-0 bands respectively. Recall that the adopted theoretical -values have been estimated to be accurate to about 5 %. It is instructive to compare relative -values: the requirement that lines from the four bands be forced to fit a single curve of growth requires ratios of and . In contrast, the theoretical estimates of the same ratios are 0.61 and 0.28 from Langhoff et al. with very similar ratios from other theoretical calculations; for example, van Dishoeck’s (vandishoeck (1983)) -values correspond to the ratios 0.59 and 0.27. Earlier calculations by Theodorakopoulos et al. (theodorakopoulos (1987)) calculations give the ratios of 0.64 and 0.31. In general, absolute values of the -values are more sensitive to the details of a calculation than are ratios of the -values that depend primarily on the well determined potential energy curves and secondarily on the variations of the electronic transition moment with inter-nuclear separation. In other words, it is not surprising that Theodorakopoulos et al.’s -values for the 2-0 band is 29 % larger than Langhoff et al.‘s but that the above sets of -values ratios from the same pair of calculations are identical to within 5-10 %. It is worth noting too that observations of interstellar C2 lines toward Oph. give the ratio (van Dishoeck & Black vandishoeckblack (1986)) in good agreement with the predictions from Langhoff et al. of 2.15, and in sharp disagreement with the ratio of 1.4 from fitting HD 56126’s lines to a single curve of growth. Our assessment of the theoretical -values for the Phillips system is that their uncertainties do not allow curves of growth for the individual bands to be shifted as here required.
Could emission affect the equivalent widths? If unresolved emission from the circumstellar shell fills in the absorption provided by C2 molecules along the line of sight to the star, the theoretical curves of growth for a uniform slab will be inappropriate. If the emission contribution declines in the order 1-0, 2-0, 3-0, and 4-0, the apparent inconsistencies in the column densities could be explained. It is certainly the case that, if the circumstellar shell is spherically symmetric and large with respect to the star, one expects a P-Cygni profile with blue-shifted absorption and emission to the red of the absorption. (Reddy et al. (reddybakkerhrivnak (1998)) observed that the circumstellar C2 Phillips lines of the post-AGB star IRAS 07431+1115 exhibit P-Cygni profiles while Cohen & Kuhi (cohenkuhi (1977)) found that the absorption component of C2 towards the Egg Nebulae was present in the polarized light (reflected by the nebulae), while the emission component was unpolarized.) Since the expansion velocity is 8.0 km s-1, the emission and absorption would be fully resolved at our resolution such that dilution of the absorption should be very small. Such emission is not seen in our spectra. We conclude that the shell does not meet the conditions of large and/or spherically symmetric. A special geometry must be provided such that emission from regions off the line of sight to the star provide sufficient flux to fill in the lines with the additional proviso that emission not dominate entirely.
Transition probabilities of Phillips system bands do suggest that emission might account for the apparent inconsistencies in the column densities. Branching ratios, , for emission from the levels of the upper state may be calculated from transition probabilities, A, given by van Dishoeck (vandishoeck (1983)). We find that %, that is 82 % of the radiative decays from are in the 1-0 band. For the other observed bands, %, %, and %. Emission rates of these bands depend also on the pumping rates from in the X state. These rates should be fairly similar to 1, 2, 3, and 4. Then, it is apparent that contamination of the absorption lines by emission should be most serious for the 1-0 band and least for the 4-0 band. This is in the correct sense to account for the apparent inconsistencies in the column densities. It follows that, if this is the correct explanation that C2 bands should also be seen in emission. for example, the 3-1 band is expected to have twice the emission strength of the 3-0 band. We looked for emission of the 3-1 band in the available spectra which cover this region, no such emission (nor absorption) was found to be present. A simpler and stronger argument against the “emission” hypothesis is that no such effects are seen in the CN Red system lines where the run of from 73 % to 7 % for 1-0 to 4-0 is similar to the run for the Phillips bands.
Could the CN -parameter be inappropriate for C2? The CN -parameter is dominated by contributions from small scale turbulence or a velocity gradient. Since CN and C2 seem likely to reside in similar layers of the shell, it seemed reasonable to suppose that the molecules have the same -parameter. It is, however, the case that a lower value, km s-1 put all lines on a single curve of growth whith adoption of the theoretical -values. We cannot reject this lower -parameter directly but note (see below) that it gives an unusually high isotopic ratio of C/13C.
Could the equivalent widths be in error ? A noticeable difference between the CN and C2 curves of growth is the larger scatter of the latter about the fitted theoretical curve of growth. We suspect that this reflects the fact that the CN equivalent widths are measured of higher resolution and higher signal-to-nose ratio spectra. Then the vast majority of the C2 lines, in particular, the C2 1-0 lines are in a ratter noisy region of the available spectra. Quite possibly, the C2 lines are subject to systematic errors. One contributing factor may be that the wings of the strongest lines make a significant contribution of the total equivalent width. For circumstellar lines (with a low -value), the intrinsic spectrum (as observed at infinite spectral resolution) reaches zero intensity in the core of the profile. Line wings are very extended (several times the of the line) and represent a significant fraction of the column density. These shallow wings are unfortunately very hard to measure and in most cases we did a Gaussian fit on the profile to obtain the equivalent width and assumed that the contribution of the wing is irrelevant. Tests on the difference between a Gaussian and Voigt profile shows indeed that this could account for a part of the inconsistensies. The stronger the line, the more our measured equivalent widths are in error. Unfortunately there is no easy way to measure the line wings unless we obtain additional very high signal-to-noise ratio spectra at very high-resolution ().
In conclusion, the inconsistencies in the derived column densities are most likely a result of the fact that we did not take the extended wings of the absorption profiles into account. Hence, for the saturated lines, our measured equivalent widths are too low.
Fig. 3 shows the curve of growth of C2 Phillips lines towards HD 56126. The -values for the Phillips bands have been multiplied by 0.62 1-0, 0.98 2-0, 1.53 3-0, and 2.26 4-0 to improve the fit, and the over-plotted curve of growth is for our preferred value of km s-1. Two other curve of growth have been over-plotted which have a -value marking the error bar of our determination. By changing the relative -values to obtain consistent column densities, we find that this introduces a shift of of 0.05 km s-1 towards lower -values. We therefore conclude that our analysis is not severely affected, but that an increased accuracy can only be reached by taking the (presumed) emission component into account.
In deriving C2 column densities, we suppose that the theoretical -values and km s-1 are correct, and attribute the offset from the theoretical curve of growth to errors affecting the measured equivalent widths. For the latter reason, we give low weight to the strong C2 1-0 lines.
4.2 Rotational diagram and column densities
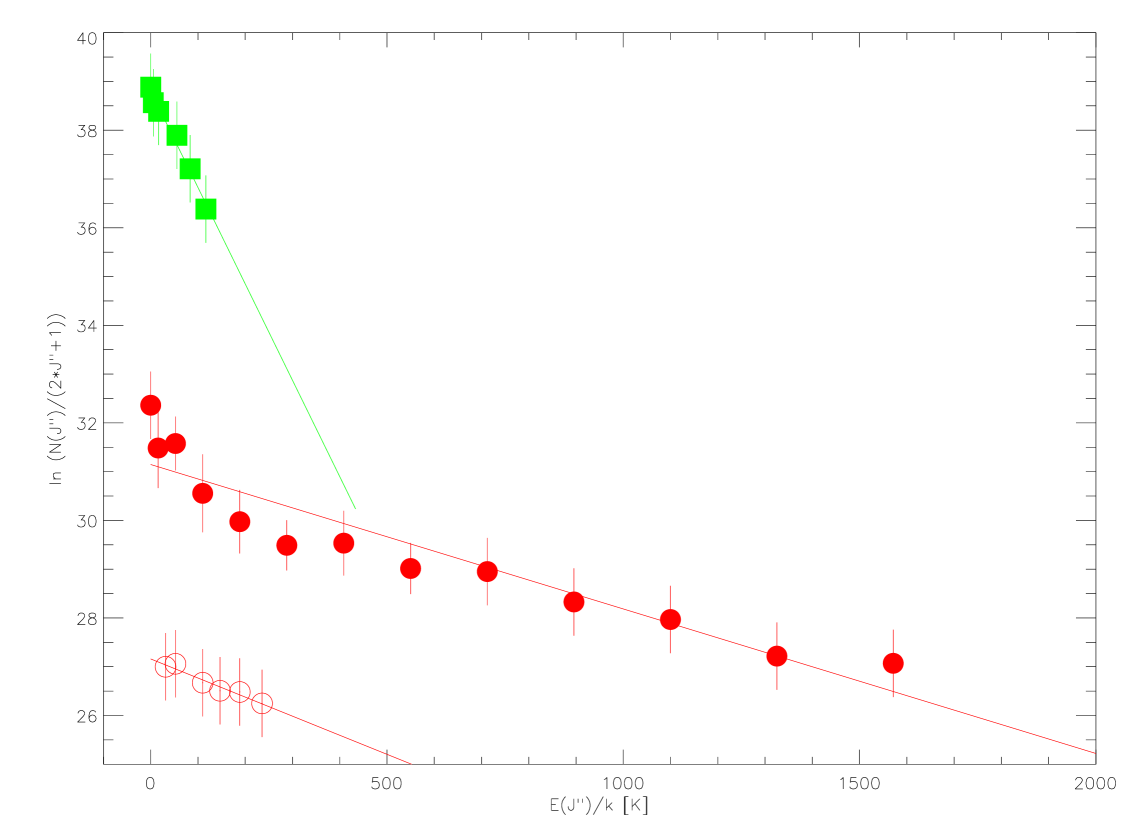
A rotational diagram has been constructed, using the -values given in Sec. 3, for C2, C13C, and CO (Fig. 4) using the column densities presented in Table 4. For a molecule in local thermodynamic equilibrium (LTE) for which the population distribution of its energy levels can be described by a Boltzmann distribution, the rotational diagram is a straight line. The rotational temperature is given by the negative of the inverse of the slope of the line. From previous work (see for details and references Paper I, II, III) we know that C2 and CN are not in LTE, their rotational diagram are not linear. The curvature for C2 in Fig. 4 suggests that this molecule is not in LTE. For the other molecules, too few levels are probed to make a similar claim.
To quantify the excitation of the molecule we make a linear fit to the rotational diagram to obtain an effective rotational temperature. We find K, cm-2, K, cm-2, and K, cm-2 for C2, C13C, and CO respectively (see also Table 4). The column densities from the observed levels are not always a good measure for the total column densities. This is best demonstrated by looking at C13C. With a rotational temperature of 256 K, the level that is most populated is . Since we observed only the Q-Branch with lower than 9, we miss about 50% of the column density. By assuming a constant rotational temperature and extrapolating to the unobserved levels, we can compute the total C13C column density. Another problem is encountered for C2. Since this molecule is not in LTE, the integrated column density will be different from the total observed column density.
5 Discussion
The rotational temperatures of C13C and CO are well constrained by a linear fit to their rotational curves (Fig. 4). Within the error C2 can be fitted to the same rotational temperature as C13C, but it is clear that the C2 rotational curve has a depression from a linear curve near K. For lower energies (lower J′′), the curve is steeper which translates in a lower rotational temperature, while for higher energies (higher J′′), the curve is flatter which translates in a higher rotational temperature. This effect has been noted before (Paper I, II) and is characteristic for a molecule which is not in LTE and has a rotational temperature in excess of the kinetic temperature of the gas. C2 is a homo-nuclear molecule and has therefore no permanent dipole moment. Selection rules do not allow rovibrational (infrared) and rotational (sub-millimeter) transitions. The molecule absorbs energy from the infrared to the ultraviolet (the observed molecular bands), but has no strong cooling mechanism. The result is that the molecule is rotationally excited above the kinetic temperature. An overall fit to the curve yields K. C13C has a very small electric dipole moment and very weak allowed rovibrational and rotational transitions allow the molecule to cool. The possibly lower rotational temperature for C13C of K is consistent with this model. CO has a permanent dipole moment ( Debye, for references see Kirby-Docken & Liu kirbydockenliu77 (1977)). It can effectively cool by emitting a photon in the infrared or sub-millimeter. It is thus not unexpected that we find a rotational temperature lower than that for C2 and C13C. CN, with a permanent dipole moment of Debye (Thomson & Dalby thomsondalby (1968)), cools more efficiently and has a lower rotational temperature of K. Besides the difference in dipole moment, there are second order factors which should be considered in order to understand the excitation of the molecule. Since each molecules has its own characteristic absorption spectrum, different molecules absorb different parts of the stellar spectrum. The energy distribution of the central stars, the star’s photospheric spectrum, and the reddening between the star and the line forming region should therefore be considered. Clearly, it would be of great interest to model the excitation of the five molecules detected and extract information about the conditions within the CSE from their excitation.
Because of the difference in rotational temperature between C2 and C13C, and the fact that C13C has twice as many levels available, the C2/C13C can not be determined for each level independently. Instead the only acceptable way is by integrating the population over all available levels. The unobserved levels for C13C contain a significant fraction of the total column density and the total C13C column density can therefore only be obtained by computing a rotational temperature and extrapolating to the unobserved energy levels (labeled as in Table 4). Using the integrated column densities for C2 and C13C we find C2/C13C.
The conversion from C2/C13C to C/13C is rather straightforward. Under chemical equilibrium conditions, C13C is formed twice as easily as C2 (Tatum tatum (1966)). This can be best demonstrated with Tatum’s example. In a draw there are equal number of white and black socks (12C and 13C atoms to make C2H2 C2H C2). By taking at random two socks out of the draw, the possible combinations are (white,white), (white,black), (black,white), and (black,black). Since (white,black) is the same as (black,white) the probability is 1:2:1 for a white, mixed, and black pair of socks. Hence the equilibrium abundance of the hetero-nuclear molecule must be twice that of the homo-nuclear molecule. Excluding any other reaction this leads to C/13CC2/C13C=.
CN is a polar molecule with a permanent dipole moment. The rate coefficient for the isotopic exchange reaction of CN with C+ is as high as cm-3 s-1 (Adams et al. adamsetal (1985)). Since 13CN has a 31 K lower zero-point energy than CN, the reaction making 13CN from CN is exothermic. In paper III we constructed a simple chemical model of the CSE of HD 56126 and found that for C2/13CN we get C/13C. C2 is a symmetric molecule possessing no permanent dipole moment, theory predicts a rate coefficient which is typically cm-3 s-1. Since C13C has a 25 K lower zero-point energy than C2 the reaction making C13C from C2 is exothermic. Since the zero-point energy difference for C13C and 13CN to C2 and CN respectively are about the same, and C2 and CN have about the same abundance with distance from the star, we can use the chemical model of Paper III (their Fig. 6.d.) to assess the importance of the isotopic exchange reaction for C2. We find that our model predicts C2/C13C=60 for C/13C=67. Taking into account the many uncertainties of this model (C+ abundance, kinetic temperature etc.) we argue that within the errors of our computations, the isotopic exchange reaction does not significantly alter the C2/C13C ratio in the circumstellar shell surrounding HD 56126.
Given these argument for C2 and CN, we argue that the intrinsic carbon isotope ratio is well constrained by the C2/C13C ratio as C/13C=, and that a rate coefficient for the CN isotopic exchange reaction of cm-3 s-1 is consistent with the observed CN/13CN ratio.
The prototype of the AGB stars, IRC +10216/CW Leo, is a massive, highly-evolved carbon star with (Guélin et al. guelinetal (1995)). For IRC +10216 the isotope ratios are well determined and give an estimate of the ratios which one might expect to detect for a carbon-rich post-AGB star like HD 56126: C/13C=44. (see Forestini & Charbonnel forestinicharbonnel (1997) for an overview). Our estimate of the C/13C ratio for HD 56126’s shell is consistent with that of IRC +10216. Results for circumstellar shells around four other carbon stars were provided by Kahane et al. (kahane (1992)): C/. These too suggest that HD 56126 is not exceptional.
Combining our results from Paper III and this paper yields a column density ratio of CO/(C2+C13C) and CO/(CN+13CN). These column density ratios do not necessarily reflect abundance density ratios. CO is abundant throughout the whole CSE, while C2 and CN are only present in a shell within the CSE where interstellar photons photo-dissociate HCN to CN and C2H2 via C2H to C2 (Cherchneff et al. cherchneff (1993)). Column density ratios of CO to C2 and CN (excluding their isotopes) have been measured in several ways. Olofsson (olofsson (1998)) lists abundances for a large range of molecules detected in the shell surrounding AGB stars (although most molecules are only detected in IRC +10216). From his work we find CO/C and CO/CN. Bachiller et al. (bachilleretal (1998)) present abundance ratios for, among others, CRL 2688 (Egg Nebulae) obtained from sub-millimeter line emission observations CO/CN=909. Within a factor of two these numbers are consistent with what we find for HD 56126. Bachiller et al. suggest that the CO/13CO likely reflects the C/13C for the planetary nebulae. If so, their C/13C is a factor three lower than ours. This could suggest that the objects observed by Bachiller et al. are not the precursors of HD 56126 but possible PN’s with higher mass progenitor ( M⊙) while the progenitor of HD 56126 has ( M⊙).
A model for the C2 molecule has been constructed by van Dishoeck & Black (vandishoeckblackmodel (1982)) which takes into account collisional and radiative excitation and de-excitation. For K we find cm-1 (see also Bakker et al. bakkeredinburg (1995)). It is curious that these estimates of and are quite similar to those derived from C2 molecules in diffuse interstellar clouds. This is surprising as in Paper II we estimated that the circumstellar C2 molecules are pumped largely by the stellar radiation field. From a fit to the rotational population, cm2 as the collisional cross-section for C2-H2 (Phillips phillips (1994)), and the ratio of the stellar radiation field relative to the standard interstellar radiation field, we find as the number of collisional partners for C2. At cm this translates in M⊙ yr-1. This mass-loss rate as derived from modeling the C2 excitation gives a result comparable to the mass-loss rate derived using other techniques.
Based on this work we can make some suggestions to continue this study. A critical detection would be that of the quadrupole transitions of H2 at 2.2m and 13CO rovibrational bands at 4.6 m. This would allow to determine the column density ratio of the detected molecules relative to the most abundant specie (H2) and the CO/13CO ratio. Secondly, more C2CN stars should be studied to determine the C2/C13C and CN/C13N ratio to get good statistics. The most ambitious project would be to model the excitation of all molecules simultaneously in order to obtain the physical conditions of the CSE (densities, radiation field, extinction etc.).
References
- (1) Adams, N.G., Smith, D. & Clary, D.C 1985, ApJ 296, L31
- (2) Amiot, C. & Verges, J. 1983, A&AS 51, 257
- (3) Bachiller, R., Forveille, T., Huggings, P.J. & Cox, P. 1997, A&A 324, 1123
- (4) Bakker, E.J., Lamers, H.J.G.L.M., Waters, L.B.F.M. & Schoenmaker, T. 1995, Ap&SS 224, 335
- (5) Bakker, E.J., Lambert, D.L. & van Dishoeck, E.F. 1996a, IAU Symposium 177 “The Carbon Star Phenomenon”, Ed. Wing, R.F. in press
- (6) Bakker, E.J., Waters, L.B.F.M., Lamers, H.J.G.L.M., Trams, N.R. & van der Wolf, F.L.A. 1996b, A&A 310, 893 (Paper I)
- (7) Bakker, E.J., van Dishoeck, E.F., Waters, L.B.F.M. & Schoenmaker, T. 1997, A&A 323, 469 (Paper II)
- (8) Bakker, E.J. & Lambert, D.L. 1998, ApJ 502, in press (Paper III)
- (9) Ballik, E.A. & Ramsay, D.A. 1963, J.Mol.Sp. 137, 84
- (10) Bauer, W., Becker, K.H., Hubrick, C., Meuser, R. & Wildt, J. 1985, ApJ 296, 758
- (11) Bauer, W., Becker, K.H., Bielefeld, M. & Meuser, R. 1986, Chem.Phys.Lett. 123, 33
- (12) Bernath, P.F. 1995, “Spectra of Atoms and Molecules”, Oxford University Press (New York)
- (13) Chauville, J.& Maillard, J.P. 1977, J.Mol.Sp. 68, 399
- (14) Cherchneff, I, Glassgold, A.E. & Mamon, G.A. 1993, ApJ 410, 188
- (15) Cohen, M. & Kuhi, L.V. 1977, ApJ 213, 79
- (16) Decin, L., van Winckel, H., Waelkens, C. & Bakker, E.J. 1998, A&A 332, 928
- (17) Erman, P. & Iwamae, A. 1995, ApJ 450, L31
- (18) Farrenq, R., Guelachvili, G., Sauval, A.J., Grevesse, N. & Farmer, C.B. 1991, J.Mol.Sp. 149, 375
- (19) Forestini, M. & Charbonnel, C. 1997, A&AS 123, 241
- (20) Goorvitch, D. & Chackerian, Jr., C. 1994a, ApJS 91, 483
- (21) Goorvitch, D. & Chackerian, Jr., C. 1994b, ApJS 92, 311
- (22) Greene, T.P., Tokunaga, A.T., Toomey, D.W. & Carr, J.C. 1993, Proc. SPIE 1946, 313
- (23) Greene, T.P. & Denault, A. 1994, “CSHELL: NASA IRTF” Cryogenic Echelle Spectrograph, User’s Manual, Revision 2.0.1
- (24) Guélin, M., Forestini, M., Valiron, P., Ziurys, L.M., Anderson, M.A., Cernicharo, J. & Kahane, C. 1995, A&A 297, 183
- (25) Hinkle, K., Wallace, L. & Livingston, W. 1995, “Infrared Atlas of the Arcturus Spectrum, 0.9-5.3 microns”, ISBN 1-886733-04-X
- (26) Hrivnak, B.J. & Kwok, S. 1991, ApJ 368, 564
- (27) Iben, I.Jr. 1983, ARAA 21, 271
- (28) Justtanont, K., Barlow, M.J., Skinner, C.J., Roche, P.F., Aitken, D.K. & Smith, C.H. 1996, A&A 309, 612
- (29) Kahane, C., Cernicharo, J., Gomez-Gonzalés, J., & Guélin, M. 1992, A&A 256, 235
- (30) Kirby-Docken, K. & Liu, B. 1977, J.Chem.Phys. 66, 4309
- (31) Kirby-Docken, K. & Liu, B. 1978, ApJS 36, 359
- (32) Klochkova, V.G. 1995, MNRAS 272, 710
- (33) Kwok, S., Volk, K. & Hrivnak, B.J. 1989, ApJ 345, L5
- (34) Kwok, S., Hrivnak, B.J. & Geballe, T.R. 1995, ApJ 454, 394
- (35) Lambert, D.L., Sheffer, Y. & Federman, S.R. 1995, ApJ 438, 740
- (36) Langhoff, S.R. 1996, Private Communications
- (37) Langhoff, S.R., Bauschlicher, Jr., Rendell, A.P. & Komornicki, A. 1990, J.Chem.Phys 92, 3000
- (38) Luck, R.E. & Bond, H.E. 1989, ApJ 342, 476
- (39) Marenin, I.R. & Johnson, H.R. 1970, JQSRT 10, 305
- (40) Morton, D.C. 1991, ApJS 77, 119
- (41) Olofsson, H. 1998, Ap&SS 251, 31
- (42) Phillips, T.R. 1994, MNRAS 271, 827
- (43) Pollock, C.R., Petersen, F.R., Jennings, D.A. & Wells, J.S. 1983, J.Mol.Sp. 99, 357
- (44) Reddy, B.E., Parthasarathy, M., Gonzalez, G. & Bakker, E.J. 1997, A&A 328, 331
- (45) Reddy, B.E., Bakker, E.J. & Hrivnak, B.J. 1998, A&A in preparation
- (46) Tatum, J.B. 1966, Pub.Dom.Ap.Obs.Victoria 13, 1
- (47) Theodorakopoulos, G., Petsalakis, I.D., Nicolaides, C.A. & Buenker, R.J. 1987, Chem.Phys. 112, 319
- (48) Thomson, R. & Dalby, F.W. 1968, Can.J.Phys. 46, 2815
- (49) Tokunaga, A.T., Toomey, D.W., Carr, J.S., Hall, D.N.B. & Epps, H.W. 1990, Proc. SPIE 1235, 131
- (50) Tull, R.G., MacQueen, P.J., Sneden, C. & Lambert, D.L. 1995, PASP 107, 251
- (51) van Dishoeck, E.F. 1983, Chemical Physics 77, 277
- (52) van Dishoeck, E.F. & Black, J.H. 1982, ApJ 258, 533
- (53) van Dishoeck, E.F. & Black, J.H. 1986, ApJ 307, 332
- (54) van Winckel, H. 1997, A&A 319, 561
| Date | Exp. time [s] | [Å] | Remark | ||
|---|---|---|---|---|---|
| HD 56126 | |||||
| 10 Jan. 1998 | 2450823.68 | 8876 | 20 | C13C 1-0 Q-branch | |
| 11 Jan. 1998 | 2450824.68 | 8876 | 20 | C13C 1-0 Q-branch | |
| 12 Jan. 1998 | 2450825.65 | 8876 | 20 | C13C 1-0 Q-branch | |
| Ori | |||||
| 10 Jan. 1998 | 2450823.64 | 8876 | 273 | … | |
| 11 Jan. 1998 | 2450824.65 | 8876 | 230 | … | |
| co-added HD 56126/ Ori | 8876 | 85 | C13C 1-0 Q-branch | ||
| Date | Exp. time [s] | [cm-1] | Remark | ||
| HD 56126 | |||||
| 22 Feb. 1998 | 2450866.718 | 4281 | 87 | CO 2-0 R()= 4,5,6 | |
| 23 Feb. 1998 | 2450867.704 | 4266 | 100 | CO 2-0 R()= 0,1,2 | |
| HR 2763 | |||||
| 22 Feb. 1998 | 2450866.770 | 4281 | 163 | CO 2-0 R()= 4,5,6 | |
| 23 Feb. 1998 | 2450867.756 | 4266 | 711 | CO 2-0 R()= 0,1,2 | |
| co-added HD 56126/HR 2763 | 4281 | 170 | CO 2-0 R()= 4,5,6 | ||
| co-added HD 56126/HR 2763 | 4266 | 180 | CO 2-0 R()= 0,1,2 | ||
a heliocentric Julian date of first observation.
b central wavelength or wavenumber of relevant order.
| () | [Å] | [Å] | [mÅ] | Remarks | |
|---|---|---|---|---|---|
| R(7) | 10162.961l | 10165.50 | 0.713 | 0.6 | tentative |
| R(6) | 10163.064l | 10165.60 | 0.731 | 1.6 | tentative |
| R(8) | 10163.297c | 10165.70 | 0.699 | 2.1 | tentative |
| R(5) | 10163.605l | 10166.27 | 0.756 | 2.2 | tentative |
| R(9) | 10164.070l | 10166.80 | 0.688 | 2.8 | tentative |
| R(4) | 10164.583c | … | 0.792 | … | blended |
| R(3) | 10165.998c | 10168.66 | 0.848 | 2.7 | … |
| R(2) | 10167.851l | … | 0.950 | … | not detected |
| R(1) | 10170.142c | … | 1.187 | … | not detected |
| R(0) | 10172.779c | … | 2.380 | … | not detected |
| Q(1) | 10176.478c | … | 1.186 | … | not detected |
| Q(2) | 10177.352c | … | 1.186 | … | blended |
| Q(3) | 10178.665c | 10181.33 | 1.186 | 4.0 | … |
| Q(4) | 10180.412l | 10183.08 | 1.186 | 5.2 | … |
| Q(5) | 10182.598l | 10185.24 | 1.186 | 2.7 | … |
| P(2) | 10183.699c | … | 0.237 | … | not detected |
| Q(6) | 10185.226l | 10187.90 | 1.185 | 5.1 | … |
| P(3) | 10188.189c | … | 0.339 | … | not detected |
| Q(7) | 10188.294l | 10190.96 | 1.185 | 5.0 | … |
| Q(8) | 10191.803c | 10194.48 | 1.185 | 5.5 | … |
| P(4) | 10193.123c | … | 0.395 | … | not detected |
| Q(9) | 10195.751l | 10198.39 | 1.184 | 4.9 | … |
| P(5) | 10198.450c | 10201.15 | 0.431 | 2.7 | tentative |
| P(6) | 10204.313l | … | 0.455 | … | not observed |
| P(7) | 10210.583l | … | 0.473 | … | not observed |
| P(8) | 10217.309l | … | 0.487 | … | not observed |
| P(9) | 10224.469l | … | 0.497 | … | not observed |
a wavelengths have been computed from the wavenumbers by
Amiot & Verges (amiotverges (1983))
and the index of refraction of
(Morton morton (1991)).
b appended to the wavelength; l: laboratory; c: computed.
c computed with .
d heliocentric velocity of the identified lines
km s-1
(excluding tentative and blended lines).
| (J′′) | [cm-1] | [cm-1] | [cm-1] | Remarks | |
|---|---|---|---|---|---|
| R(0) | 4263.837l | 8.957 | 4262.45 | 5.2 | … |
| R(1) | 4267.542l | 6.007 | 4266.14 | 7.1 | … |
| R(2) | 4271.177l | 5.439 | 4269.75 | 8.5 | … |
| R(3) | 4274.741l | 5.212 | … | … | not observed |
| R(4) | 4278.234l | 5.098 | 4276.83 | 8.7 | … |
| R(5) | 4281.657l | 5.036 | 4280.23 | 5.9 | blended |
| R(6) | 4285.009l | 5.002 | 4283.55 | 3.3 | blended |
| R(7) | 4288.290l | 4.985 | … | … | not observed |
| R(8) | 4291.499l | 4.979 | … | … | not observed |
| R(9) | 4294.638l | 4.981 | … | … | not observed |
a after Pollock et al. (pollocketal (1983)).
b appended to the wavenumber; l: laboratory.
c computed with .
d heliocentric velocity of the identified lines
km s-1
(excluding blended lines).
| C2 | C13C | CN | 13CN | CO | ||||||
| or | no.a | no.a | no.a | no.a | no.a | |||||
| [cm-2] | [cm-2] | [cm-2] | [cm-2] | [cm-2] | ||||||
| 0 | 3 | 0 | … | 10 | 1 | 1 | ||||
| 1 | … | … | 0 | … | 12 | 2 | 1 | |||
| 2 | 12 | 0 | … | 17 | 2 | 1 | ||||
| 3 | … | … | 2 | 11 | 2 | 0 | … | |||
| 4 | 6 | 1 | 1 | 0 | … | 1 | ||||
| 5 | … | … | 0 | … | 1 | 0 | … | 1 | ||
| 6 | 7 | 1 | 0 | … | 0 | … | 1 | |||
| 7 | … | … | 1 | 0 | … | 0 | … | 0 | … | |
| 8 | 7 | 1 | 0 | … | 0 | … | 0 | … | ||
| 9 | … | … | 1 | 0 | … | 0 | … | 0 | … | |
| 10 | 9 | 0 | … | 0 | … | 0 | … | 0 | … | |
| 11 | … | … | 0 | … | 0 | … | 0 | … | 0 | … |
| 12 | 6 | 0 | … | 0 | … | 0 | … | 0 | … | |
| 13 | … | … | 0 | … | 0 | … | 0 | … | 0 | … |
| 14 | 6 | 0 | … | 0 | … | 0 | … | 0 | … | |
| 15 | … | … | 0 | … | 0 | … | 0 | … | 0 | … |
| 16 | 4 | 0 | … | 0 | … | 0 | … | 0 | … | |
| 17 | … | … | 0 | … | 0 | … | 0 | … | 0 | … |
| 18 | 3 | 0 | … | 0 | … | 0 | … | 0 | … | |
| 19 | … | … | 0 | … | 0 | … | 0 | … | 0 | … |
| 20 | 3 | 0 | … | 0 | … | 0 | … | 0 | … | |
| 21 | … | … | 0 | … | 0 | … | 0 | … | 0 | … |
| 22 | 3 | 0 | … | 0 | … | 0 | … | 0 | … | |
| 23 | … | … | 0 | … | 0 | … | 0 | … | 0 | … |
| 24 | 2 | 0 | … | 0 | … | 0 | … | 0 | … | |
| 71 | 7 | 52 | 7 | 5 | ||||||
| [K] | ||||||||||
| C2/C13Cf | ||||||||||
| CN/13CNf | ||||||||||
| C/13Cf | ||||||||||
| CO/(C2+C13C)f | ||||||||||
| CO/(CN+13CN)f | ||||||||||
a number of lines used in averaging.
b if less than 5 lines used, then error is 0.30 dex.
c from Paper III.
d summed over all observed transitions [cm-1].
e integrated using the rotational diagram and an
infinite number of transitions [cm-1].
f column density ratios derived from .