02 (11.03.4 A2390; 11.03.3 ; 12.07.1 ; 13.09.1 ; 11.19.5 ; 11.19.6)
L. Lémonon ludovic.lemonon@cea.fr
Deep ISOCAM view of the core of the lensing cluster A2390
Abstract
We have imaged the inner square arcminute of the well known lensing and cooling flow cluster A2390 () down to a sensitivity of 65 and 130 Jy at 6.75 and 15 m , respectively. We report the first evidence of an active star-forming region in a cooling flow (at those wavelengths) and strong emission in the mid-IR from lensed galaxies located at .
keywords:
Galaxies : clusters : individual : Abell 2390 – Galaxies : cooling flows – Cosmology : gravitational lensing – Infrared : galaxies – Galaxies : stellar contents – Galaxies : structure1 Introduction
The cluster of galaxies A2390 (z=0.228) possesses remarkable properties which makes its study particularly attractive: presence of a “straight” giant gravitational arc (z=0.913), numerous arclets, an elongated galaxy distribution ([Mellier, 1989] ; [Pelló et al., 1991]) and a large velocity dispersion (1093 km s-1, Carlberg et al., 1996) as well as a high X-ray luminosity ( erg s-1 in the [0.1–2.4] keV band). A deep HRI ROSAT pointing revealed an elongated X-ray morphology, the existence of a secondary maximum responsible for the observed gravitational shear in the optical and a strong cooling flow of M⊙yr-1 (Pierre et al., 1996). All this indicates that A2390, and its underlying gravitational potential, is especially relevant for our understanding of massive cluster formation, which is, in a hierarchical scenario, closely related to the history of galaxy/star formation. This has motivated deep ISOCAM observations of the cluster core during the guaranteed time programme DEEPXSRC. We present here the observations and results of the cD galaxy and the lensed system. Throughout the paper we assume km s-1Mpc-1 and = 0.5.
2 ISOCAM observations
The core of Abell 2390 was observed by ISOCAM, during revolution 393, using a 66 microscan raster with a step of 10\arcsecand a pixel size of 3\arcsec. The observations were done in two bands, centered on 6.75 m (LW2) and 15 m (LW3), with an integration time of 5 s., including 30 read-outs per raster position. The scan covers and the maximum sensitivity area (5400 s of integration time per pixel position) . Thus images are centered on the “straight arc”, with a resulting pixel size, after distortion field correction, of 1\arcsec. Residual distortion errors on this corrected map are less than 0.2\arcsec. The Point Spread Functions (PSF) FWHM are about 3.5\arcsec in LW2 and 5\arcsec in LW3.
The two main steps in the detection of faint sources with ISOCAM are the removal of cosmic ray glitches and transient effects. A wavelet technique method (PRETI, [Starck et al., 1998]) has been designed to overcome these two effects and was successfully applied to the case of low luminosity sources. We adapted the method to our data in the manner described by Aussel et al. (1998). Sources were detected on the final map correlated with the noise map by a wavelet technique, and fluxes calculated by an aperture photometry in a radius of 3\arcsec. To achieve a correct calibration of the PRETI photometry algorithm and to evaluate associated uncertainties, as well as the completeness of the survey, we performed simulations for both channels by adding sources ranging from 25 Jy to 1 mJy, using a PSF model ([Okumura, 1997]) and a transient model ([Abergel et al., 1996]). For these observations, we have a 90% completeness level at 65 Jy and 130 Jy at 6.7 m and 15 m, respectively. The recovered flux is about 35%at 6.7 m and 20% at 15 m, due to the combined effects of detector transients, wavelet reconstruction, and PSF. Relative uncertainties of fluxes decrease from 50% at 100 Jy to 10% above 700 Jy.
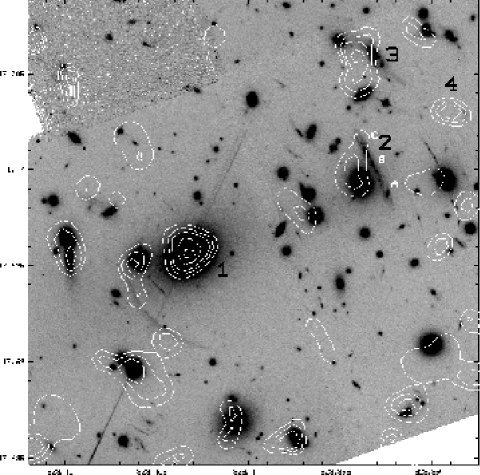
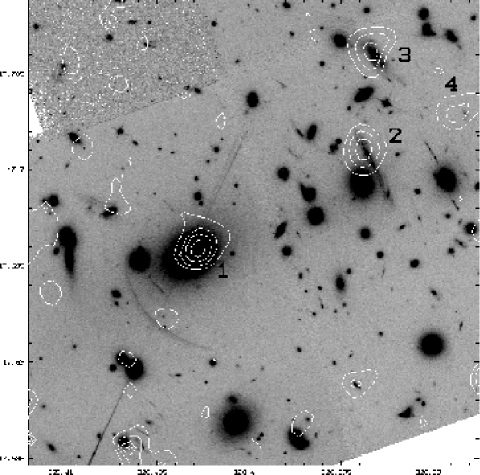
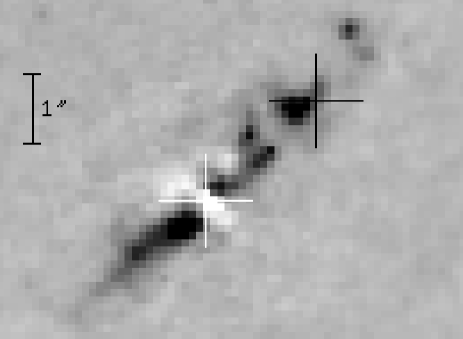
The 6.7 m and 15 m rasters were aligned on the HST image of A2390. The ISO attitude solution is accurate to within 6\arcsec, with negligible rotation for this field size, and hence mid-IR/optical alignment requires only a translation (Aussel, private communication). Superimposing the cD optical center on the centroid of its nearest 6.7 m neighboring source allowed us to unambiguously identify the brightest sources in the ISOCAM field (Fig. 1). The same method, applied to the 15 m raster, did not yield a satisfactory match between ISO and optical sources. This led us to consider the brightest non-blended point-like source detected in the maximum sensitivity area of both at 6.7 m and 15 m (source #4) and impose the coincidence of the two centroids. This latter configuration allowed satisfactory optical/IR agreement (Fig. 2). As a result of the alignment process, 6.7 m and 15 m emission peaks do not coincide. The resulting offset between the two centroids is 2\arcsec , approaching the limits on our position accuracy (Fig. 3).
| ID | name | R.A. | Dec. | 6.7 m | 6.7 m | 15 m | 15 m | lensing | V | I | B |
|---|---|---|---|---|---|---|---|---|---|---|---|
| J2000.0 | J2000.0 | adu/g/s | Jy | adu/g/s | Jy | factor | mag | mag | mag | ||
| 1 | cD galaxy | 21h53m36.76s | 17∘41\arcmin43.9\arcsec | 0.22 | 300 | 0.22 | 500 | - | 17.5 | 16.2 | 19.4 |
| 2 | straight arc | 21h53m34.46s | 17∘42\arcmin03.3\arcsec | 0.02 | 100* | 0.18 | 440 | 10–20 | 21.5 | 19.8 | 21.9 |
| 3 | object D | 21h53m34.37s | 17∘42\arcmin22.2\arcsec | 0.12 | 270* | 0.15 | 400 | 2–3 | 22.4 | 19.6 | 23.5 |
| 4 | faint object | 21h53m33.16s | 17∘42\arcmin11.0\arcsec | 0.06 | 110 | 0.11 | 350 | - | 25.4 | 23.5 | 26.2 |
| ID | name | z | B | g | V | R | r | IF814W | I’ | J | K’ | |
|---|---|---|---|---|---|---|---|---|---|---|---|---|
| (nm) | 437 | 486 | 545 | 641 | 669 | 799 | 832 | 1237 | 2103 | |||
| Cluster galaxy | 0.23 | 0.17 | 0.42 | 0.52 | 0.80 | 0.74 | 1.00 | 0.93 | 0.76 | 0.39 | ||
| 1 | cD galaxy | 0.228 | 0.37 | 0.75 | 0.58 | 0.94 | 0.70 | 1.00 | 1.11 | 0.94 | 0.44 | |
| filament | 0.63 | 0.2 | 0.97 | 0.29 | 0.18 | 1.00 | 0.7 | 0.3 | 0.1 | |||
| 2 | straight arc B-C | 0.913 | 0.21 | 0.57 | 0.58 | 0.51 | 0.63 | 1.00 | 1.28 | 1.08 | 0.61 | |
| straight arc A | 1.033 | 0.45 | 0.76 | 0.15 | 0.72 | 0.47 | 1.00 | 1.18 | 1.06 | 0.38 | ||
| 3 | object D | 0.913 | 0.10 | 0.14 | 0.19 | 0.28 | 0.30 | 1.00 | 0.76 | 1.40 | 0.95 | |
| 4 | faint object | 0.4† | 0.31 | - | 0.43 | 0.98 | 0.66 | 1.00 | 0.64 | 1.27 | 2.40 |
3 Results and discussion
In this letter, we restrict the discussion to the 4 sources found in the maximum sensitivity area of ISOCAM rasters and seen both at 6.7 m and 15 m, i.e. #1–4. Their photometric properties are summarized in Table 1. The visible and near-IR spectral energy distributions (SED) computed for these 4 sources are given in Table 2, and compared to those obtained for a typical cluster galaxy. Details on these photometric data can be found in Pelló et al. (1998) and the references therein. In addition, about 20 objects are identified at 6.7 m and 10 at 15 m, which will be discussed in a forthcoming paper. All sources are point-like for ISOCAM, except the cD galaxy which extends over two times the PSF FWHM at 6.7 m (i.e kpc), and then allow us to exclude a pure AGN emission.
3.1 The cD galaxy and its cooling flow
The cD galaxy is detected both at 6.7 m and 15 m, with a flux of Jy and Jy respectively. VLA observations ([Arnouts & Soucail, 1992]) show a point-like source with decreasing radio fluxes of 140, 16 and 5.5 mJy at 6, 2 and 1.3 cm, respectively. Assuming a power law spectrum, the mid-IR flux would be some fainter than observed, which excludes a jet-like synchrotron contribution to the observed mid-IR emission. In galaxies where the mid-IR emission is dominated by an old stellar population, the ratio 6.7 m/15 m is . An excess of 15 m emission in field galaxies indicates the presence of dust heated by UV photons from star-forming regions. Compared to the 6.7 m/15 m ratios observed in other nearby early-type galaxies ([Madden et al., 1998]) or in distant cD galaxies in clusters ([Lémonon et al., 1998]), the ratio of found here for the cD is exceptional. This ratio is compatible with the colors of the disk component of Centaurus A ([Mirabel et al, 1998a]), a nearby giant early-type galaxy exhibiting active star-forming regions in dust lanes, due to a merge with a spiral galaxy. Thus, the cD in A2390 is probably also undergoing active star formation. However, our cD galaxy looks notably different in other wavelengths. Cen A shows a jet plus an extended radio emission but our cD does not. In addition, a B image reveals the existence of a filament extended along the main axis of the cD, while V and I HST images show the presence, within the filament, of very blue globules possibly associated with the 15 m maximum (Fig. 3). Strong emission lines are present across the long-slit spectrum of the filament (Fig. 4) with ratios indicative of massive star formation associated with shocks and incompatible with an active nucleus ([Allen, 1995], [Baldwin et al., 1981]). Finally the SED of the filament exhibits a clear excess in the V and B bands with respect to what is expected for a typical elliptical. Assuming that the V flux is mainly produced by forming stars, we derive and a SFR of h M⊙ yr-1 for the optical filament, in agreement with the values obtained from the B flux, corrected for the emission. No absorption has been considered in this calculation, so this estimated SFR has to be taken as a lower limit. According to the results derived from V and B band, and from IR, the optical light is probably coming from the most external regions of the star-forming system, whereas part of the star-formation activity remains shrouded within more dense and dusty clouds, as in the Antennae Galaxies, where absorption is ten times higher when derived from mid-IR than from J, H, K bands, as most massives stars are not visible at optical wavelengths ([Mirabel et al, 1998b]). This implies that we can not exclude a SFR as high as ten times what is derived from the optical for the cD of A2390. Those differences explain why, with a 6.7 m/15 m ratio of 0.6, we can not just consider the cD of A2390 as an early-type galaxy undergoing simple star-formation in dust lanes as Cen A, but most probably as the place of one or several massive star-bursts which may be located in the central globules (see Fig 3). Indeed, the study of the X-ray image of this cluster demonstrated the presence of one of the strongest cooling flows known ( M⊙ yr-1 within a cooling radius of 200 kpc), surrounding the cD galaxy ([Pierre et al., 1996]). Giving the size of the mid-IR emitting region in the cD, kpc, we derive a mass flow of 80 M⊙ yr-1, assuming that ([Fabian, 1994]). Note that 20 kpc is also about the size of the optical filament (Fig. 3). However, our present understanding of the relationship between mid-IR dust emission and star formation is still too preliminary to infer quantitative constraints on the IMF or even on the heating processes involved in this complex medium. Finally, the total star-formation rate of M⊙yr-1 deduced from the optical in the filament is clearly a lower limit, and the huge quantity of gas needed could be provided by the cooling flow. However, despite the fact that spiral galaxies are very rare in the core of rich clusters, the hypothesis of a past merge with a late-type galaxy cannot be formally excluded here, which would also provide gas for some years.

3.2 What is new in the arc system of Abell 2390 ?
After the detection of the giant arc at in Abell 370 ([Metcalfe et al., 1998]), observation of the complex arc system of Abell 2390 confirms the capability of ISOCAM to point up very distant lensed objects. The giant arc consists of three parts, A at ([Frye & Broadhurst, 1997]), and B–C, at ([Pelló et al., 1991]). Near IR imaging already distinguished A from B–C, as A was not detected in the K band ([Smail et al., 1993]). HST images revealed that B and C are likely two interacting galaxies. The present ISOCAM images are in full agreement with this picture. Although it was not possible to estimate properly the 6.7 m flux because of blending, the 15 m/6.7 m ratio for the B–C component is well larger than unity which is indicative of the presence of an active star forming region in agreement with the strong [OII] line detected in the optical spectrum ([Pelló et al., 1991]). Except for its lower amplification factor, the case of object D is very similar. Its morphology in the HST images is complex with probable signs of interaction and low surface brightness extensions. The existence of starburts in the two interacting galaxies is then not a surprise. The optical and near-IR SEDs of objects B–C and D appear brighter in the near-IR and fainter in the blue bands compared to A. These SEDs can be fitted by different synthetic spectra at , using the GISSEL96 code (Bruzual & Charlot, 1998) to approximately constrain the parameters, and a single stellar population (instantaneous burst), an extinction curve of SMC type (Prévot et al. 1984), and assuming the Scalo IMF (1986). The best fits of the sources B–C and D are obtained with a rest-frame in both cases, a stable result with respect to metallicity changes. The corrected magnitudes for objects B–C and D (lensing and absorption) are very similar () , the total mass involved in the burst being in both cases. Despite uncertainties on burst age, a constant star-forming model gives similar results and a mean corrected SFR of to . According to these results, the two lensed sources detected by ISOCAM at are strongly reddened star-forming galaxies. In the case of A, there is no need for a reddening correction to fit the SED.
Finally, the ISOCAM source #4 detected in both channels may be associated with a very faint source in the HST image (I = 23.5), with a fuzzy shape. Its 15 m/6.7 m ratio is very high (). A photometric redshift of is proposed for this object by techniques described by Miralles & Pellò (1998). Even if the results are much more uncertain in this case ( confidence), the best fit of the SED gives 3.5–4.2 in order to explain the high J and K′ emission compared to the optical bands. The corrected SFR is relatively low, . Taking the photometric redshift into account, the SED of this object, with strong mid-IR emission with respect to its optical counterpart, is probably dominated by the so-called unidentified infrared band emitters, and its colors are similar to those of the post-starburst companion of M51 (Boulade et al., 1996).
3.3 Summary and conclusion
From deep and high-resolution ISOCAM images of the core of Abell 2390 we discovered active star forming regions in the two most distant lensed galaxies ever seen in a cluster by ISO. This allowed us to support the scenario of two interacting galaxies at in the “straight arc” of A2390, as well as in the other galaxy observed at the same redshift. More interesting, we detect a very faint emission from the cD galaxy at 6.75 m, compared to other cluster dominant galaxies at similar redshift ([Lémonon et al., 1998]). But, for the first time, the strong 15 m/6.75 m emission ratio flags the presence of a large amount of warm dust in the cD, probably associated with a very active star forming region located within the envelope of the galaxy. Thus, our observation may further elucidate the fate of part of accumulating gas in the complex cooling flow radio core environment.
Acknowledgements.
We are grateful to J.-P. Kneib for numerous informations on the HST images. Thanks also go to J.-L. Starck, H. Aussel and S. Madden for helpful discussions. The ISOCAM data presented in this paper were analysed using ”CIA”, a joint development by the ESA Astrophysics Division and the ISOCAM Consortium led by the ISOCAM PI, C. Cesarsky, Direction des Sciences de la Matiere, C.E.A., France.References
- [Abergel et al., 1996] Abergel, A., Bernard, J.P., Boulanger, F., et al., 1996, A&A 315, L329
- [Allen, 1995] Allen S.W., 1995, MNRAS 276, 947
- [Arnouts & Soucail, 1992] Arnouts & Soucail, 1992, OMP unpublished internal report
- [Aussel et al., 1998] Aussel H., Cesarsky C.J., Elbaz D., Starck J.L., 1998, A&A submitted
- [Baldwin et al., 1981] Baldwin J.A., Phillips, M.M., Terlevich, R., 1981, PASP 93, 5
- [Boulade et al., 1996] Boulade O., Sauvage M., Altieri B., et al., 1996, A&A 315, L85
- [Bruzual & Charlot, 1998] Bruzual & Charlot, 1998, in preparation
- [Carlberg et al., 1996] Carlberg, R.G., Yee, H.K.C., Ellingson, E., Abraham, R., Gravel, P., Morris, S., Pritchet, C.J., 1996, ApJ 462, 32
- [Doane & Mathews, 1993] Doane, J.S. & Mathews W.G., 1993 ApJ 419, 573
- [Fabian, 1994] Fabian, A.C., 1994, Annu. Rev. Astron. Astroph. 32, 277
- [Frye & Broadhurst, 1997] Frye B. & Broadhurst T., astro-ph/9712111, ApJL in press
- [Lémonon et al., 1998] Lémonon, L., Pierre, M., et al., 1998 in preparation
- [Madden et al., 1998] Madden, S.C., Vigroux, L., Sauvage, M., 1998, “Mid Infrared Observations of early-type galaxies”, in Extragalactic Astronomy in the Infrared, Proceedings of the XVIIth Moriond Astrophysics Meeting, eds. Thuan T., Mamon, G., Van, J.T.T. , Editions Frontière, in press
- [Mellier, 1989] Mellier Y., 1989 in Clusters of Galaxies, ed. M. Fitchett (Baltimore: Space Telescope Science Institute)
- [Metcalfe et al., 1998] Metcalfe, L., Altieri, B., Aussel, H. et al., 1998, “ISO Mid-Infrared Observations of Abell 370” Moriond proceeding (ibid.)
- [Miralles & Pelló, 1998] Miralles J.M. & Pelló R., submitted to ApJ, astro-ph/9801062
- [Mirabel et al, 1998a] Mirabel, I.F. et al.,1998a, in preparation
- [Mirabel et al, 1998b] Mirabel, I.F., Vigroux L., Charmandaris V., et al., 1998b, A&A in press, astro-ph/9802176
- [Okumura, 1997] Okumura K., 1997, ISOCAM PSF report, http://isowww.estec.esa.nl:80/instr/CAM/cal_wksp/
- [Pelló et al., 1991] Pelló, R., Le Borgne, J.-F., Soucail, G., Mellier, Y., Sanahuja, B., 1991, ApJ 366, 405
- [Pelló et al., 1998] Pelló R. et al., 1998, in preparation
- [Pierre et al., 1996] Pierre M., Le Borgne, J.-F., Soucail, G., Kneib, J.-P., 1996, A&A 311, 413
- [Prévot et al., 1984] Prévot M.L., Lequeux J., Prévot L., Maurice E., Rocca-Volmerange B., 1984, A&A 132, 389
- [Scalo, 1986] Scalo, J.M., 1986, Fundamentals of Cosmic Physics 11, 1
- [Smail et al., 1993] Smail I., Ellis R.S., Aragón-Salamanca A., Soucail G., Mellier Y., Giraud E., 1993, MNRAS 263, 628
- [Starck et al., 1998] Starck J.-L., Aussel, H., Elbaz, D., Cesarsky, C.J., 1998, “Faint Source Detection with ISOCAM using the PRETI method”, Moriond proceeding (ibid.)