First results from the 2dF galaxy
redshift survey
Abstract
The 2dF Galaxy Redshift Survey is a major new initiative to map a representative volume of the universe. The survey makes use of the 2dF multi-fibre spectrograph at the Anglo-Australian Telescope to measure redshifts for over 250,000 galaxies brighter than bJ=19.5 and a further 10,000 galaxies brighter than R=21. The main goals of the survey are to characterise the large-scale structure of the universe and quantify the properties of the galaxy population at low redshifts. This paper describes the design of the survey and presents some preliminary results from the first 8000 galaxy redshifts to be measured.
1 The goals of the survey
Cosmology is undergoing a fin-de-millennium flowering brought on by the hothouse of recent technological progress. Cosmography, one of the roots of cosmology, is thriving too—maps of the distribution of luminous objects are covering larger volumes, reaching higher redshifts and encompassing a wider variety of sources than ever before. New ways of interpreting these observations are yielding a richer and more detailed picture of the structure and evolution of the universe, and of the underlying cosmology.
The 2dF Galaxy Redshift Survey at the Anglo-Australian Telescope aims to map the optically-luminous galaxies over a statistically-representative volume of the universe in order to characterise as fully as possible the large-scale structure of the galaxy distribution and the interplay between this structure and the properties of the galaxies themselves. In doing so, the survey will address a variety of fundamental problems in galaxy formation and cosmology. The major scientific goals include:
-
(i)
Measuring the power spectrum of the galaxy distribution on scales up to a few hundred Mpc, filling the gap in our knowledge of the power spectrum between scales less than 100 h-1 Mpc derived from earlier galaxy redshift surveys and scales greater than 1000 h-1 Mpc probed by microwave background anisotropy observations. The shape of the power spectrum on these large scales provides a strong constraint on the nature of the dark matter (i.e. whether it is hot or cold) and the total mass density .
-
(ii)
Measuring the distortion of the large-scale spatial clustering pattern in redshift space due to the peculiar velocity field produced by the mass distribution. This distortion depends on both the mass density parameter and the bias factor of the galaxy distribution with respect to the mass distribution, and its measurement constrains the combination .
-
(iii)
Investigating the morphology of galaxy clustering and the statistical properties of the fluctuations: on large scales, to determine whether the density distribution is Gaussian as predicted by most inflationary models of the early universe; on small scales, to probe the non-linear evolution of the density field.
-
(iv)
Determining the variations in the spatial and velocity distributions of galaxies as a function of galaxy properties, including luminosity and spectral type. This provides a detailed picture of the link between the masses and star-formation histories of galaxies and their local environment within the large-scale distribution. Such information will constrain models of galaxy formation and evolution.
-
(v)
Tracking the galaxy luminosity function, clustering amplitude and mean star formation rate out to a redshift of 0.5, in order to test models for the evolution of the galaxies’ stellar populations and large-scale distribution.
-
(vi)
Defining large, homogeneous samples of groups and clusters of galaxies and other large-scale structures. Redshifts for many galaxies in a representative sample of clusters and groups will give a snapshot of the dynamical evolution of the most massive bound objects in the universe at the present epoch. Mapping the infall patterns around clusters will also yield dynamical estimates of cluster masses at large radii.
The redshift survey will also provide a massive database for use in conjunction with other surveys or as a source for follow-up programs. Various interesting subsamples of galaxies (such as AGN or cDs) can be defined using the positions, luminosities and spectral types provided by the survey. Other rich veins of information can be tapped by correlating the galaxies in this survey with sources found at other wavelengths (X-ray, infrared, radio) by existing or planned satellite or ground-based surveys (ROSAT, IRAS, WIRE, FIRST, etc.).
2 Survey design
The survey design seeks to achieve the above goals using the capabilities of the 2dF multi-fibre spectrograph on the Anglo-Australian Telescope (AAT) in approximately 100 nights of telescope time. A full description of the 2dF facility is available on the WWW at http://www.aao.gov.au/2df/. However for the purposes of the survey, the essential features of 2dF are its 2 degree diameter field of view covered by 400 fibres and that it is attached to a 4m telescope. With both the goals of the survey and the capabilities of 2dF in mind, and with the limitation that the survey should not require more than about 100 nights of AAT time, we have arrived at the following survey design.
a Source catalogue
The source catalogue for the survey is a revised and extended version of the APM galaxy catalogue (Maddox et al. 1990a,b,c). This catalogue is based on Automated Plate Measuring machine (APM) scans of 390 plates from the UK Schmidt Telescope (UKST) Southern Sky Survey. The magnitude system for the Southern Sky Survey is defined by the response of Kodak IIIaJ emulsion in combination with a GG395 filter, zeropointed by CCD photometry to the Johnson B band. The extended version of the APM catalogue includes over 5 million galaxies down to bJ=20.5 in both north and south Galactic hemispheres over a region of almost 104 sq.deg (bounded approximately by declination +3 and Galactic latitude 20). The fields included in the catalogue are shown as the red squares in Figure 1. The astrometry for the galaxies in the catalogue has been significantly improved, so that the rms error is now 0.25 arcsec for galaxies with bJ=17–19.5. Such precision is required in order to minimize light losses with the 2 arcsec diameter fibres of 2dF. The photometry of the catalogue is calibrated with numerous CCD sequences and has a precision of approximately 0.2 mag for galaxies with bJ=17–19.5.
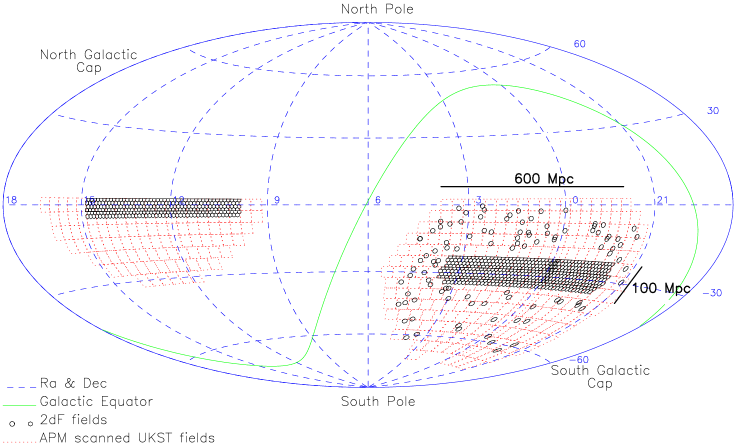
b Survey geometry
The geometry of the survey was chosen to be an effective compromise between the desire to sparsely sample the largest possible volume in order to determine the power spectrum on very large scales and the desire to fully sample a representative but compact volume in order to investigate the redshift space distortions and the topology of the galaxy distribution. There is also the observational requirement to spread the survey over a wide R.A. range to permit efficient use of telescope time. The survey geometry adopted is shown in Figure 1. It consists of two contiguous declination strips plus 100 random 2-degree fields. One strip is in the southern Galactic hemisphere and covers approximately 75∘15∘ centred close to the South Galactic Pole at (,)=(,); the other strip is in the northern Galactic hemisphere and covers 75∘7.5∘ centred at (,)=(,). The 100 random fields are spread uniformly over the 7000 sq.deg region of the APM catalogue in the southern Galactic hemisphere. At the mean redshift of the surey (), 100 h-1 Mpc subtends about 20 degrees, so the two strips are 375 h-1 Mpc long and have widths of 7.5 h-1 Mpc (south) and 3.8 h-1 Mpc (north). The volume directly sampled by the survey (out to =0.2) is 3107 h-3 Mpc3; the volume sparsely sampled including the random fields is 1108 h-3 Mpc3.
c Sample selection
The sample is chosen to be magnitude-limited at bJ=19.5 after extinction-correcting all the magnitudes in the APM catalogue using the extinction maps of Schlegel et al. (1998). This limit was chosen because the mean number of galaxies per square degree at bJ=19.5 is well-matched to the density of fibres available with 2dF. Due to clustering, however, the number in a given field varies considerably. To make efficient use of the instrument we employ a sophisticated tiling algorithm to cover the survey area with the minimum number of 2dF fields. With this algorithm we are able to achieve a 93% sampling rate with on average fewer than 5% wasted fibres per field. Over the whole area of the survey there are in excess of 250,000 galaxies. The mean redshift of this bJ=19.5 magnitude-selected sample is =0.11.
d The faint survey
The ‘bright’ survey described above will be supplemented by a ‘faint’ survey of 10,000 galaxies down to R=21. These are drawn from APM scans of deep UK Schmidt Telescope films taken on Kodak TechPan emulsion. The faint survey is limited to selected fields in the two survey strips and is carried out as an over-ride on the bright survey in the best observing conditions. The mean redshift of the faint survey is =0.3, and thus extends the bright survey sample by a factor of 3 in depth and a factor of 10 in luminosity at the cost of a 10% increase in total observing time.
3 Survey observations and status
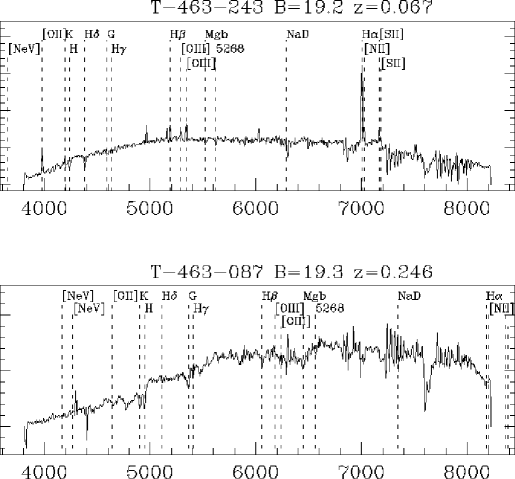
The total integration time on a given field has a lower limit set by the time required for 2dF’s robotic fibre positioner to configure the off-line field-plate. Other than this hardware limitation, the integration time is determined by the requirement that we can obtain precise and reliable redshifts and spectral type classifications, which is comfortably met with integrations of 60 min. The spectra we obtain cover the range 3800–8000Å with a two-pixel resolution of 8.6Å, and have a minimum S/N of about 10 per pixel at 5000Å; most spectra will easily exceed this target. Two example spectra from the survey are shown in Figure 2. One is a bJ=19.2 emission-line galaxy at =0.067 and the other is a bJ=19.3 absorption-line galaxy at =0.246.
This minimum S/N permits very reliable automatic spectral classification and redshift measurement. Employing both a standard cross-correlation and line-fitting code and a new code which uses principal component analysis and -fitting to simultaneously classify the spectrum and measure its redshift (Glazebrook et al. 1998), we find we achieve a very high level of reliability. A comparison of the redshifts obtained from these codes with redshifts determined via visual inspection shows a very low level of failures in the automatic algorithms. The success rate in identifying redshifts for survey galaxies is currently 90–95%; the goal is to achieve an overall success rate in excess of 95%.
The first data for the survey was taken at the start of 2dF’s commissioning in November 1996. The first survey observations with all 400 fibres were obtained in October 1997. As of this writing (March 1998) we have obtained 8000 redshifts for the survey in 43 different fields (many of which were observed with only 200 fibres and most of which were shared with the QSO survey—see Boyle, these proceedings). At present the fibre positioner is taking 110 min to configure a typical field, limiting the survey to 4–5 fields per night. However it is confidently expected that fine-tuning of the robot’s hardware and software will reduce this configuration time to about 60 min within the next few months, doubling the rate at which fields are done. We therefore currently expect to complete the survey before the end of 2000.
(a)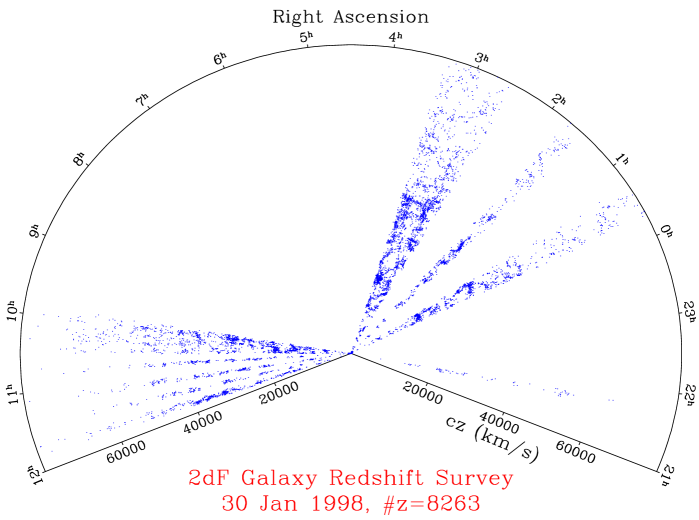
(b)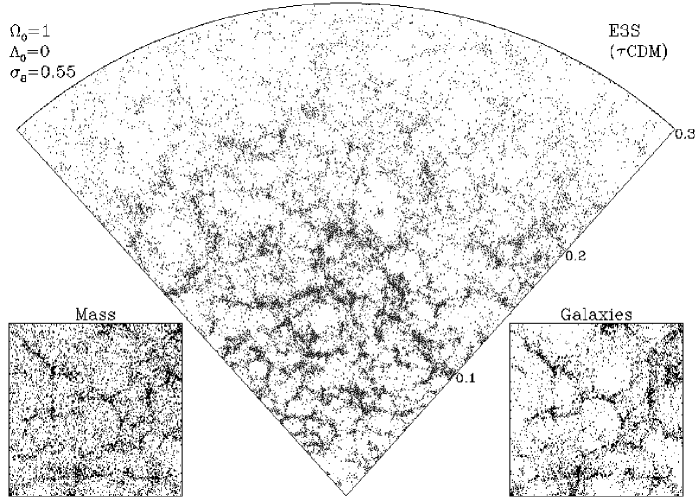
4 Preliminary Results
The survey is still in its infancy, with less than 3% of the total number of redshifts measured to date. Moreover the fields observed so far are scattered over the survey volume, making the analysis of the large-scale structure of the distribution problematic. Nonetheless, the preliminary results presented here do provide some hints of the power and scope of the full survey.
Figure 3a is a cone plot showing the distribution of the 8000 galaxies observed so far. Note that fields at all declinations are projected onto this right ascension slice through the galaxy distribution, which combines both the northern and southern strips. Even with the highly incomplete filling of the slice by the fields obtained to date, there are clear glimpses of significant large-scale structures. To provide a visual reference for comparison, Figure 3b shows a 90∘3∘ slice through a mock 2dF survey based on a CDM N-body simulation and a recipe for galaxy biasing (see Cole et al. 1998).
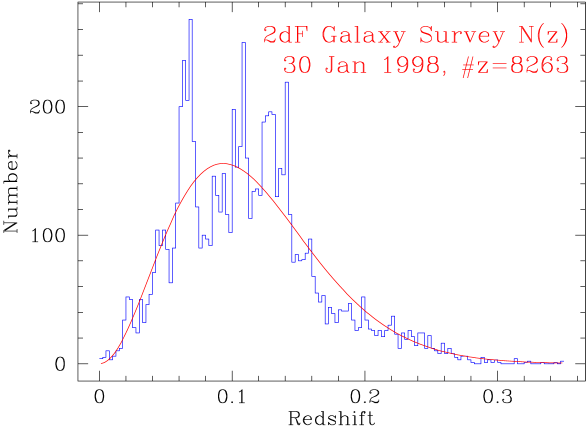
Figure 4 shows the combined redshift distribution for all fields in comparison to the predicted distribution in a homogeneous universe. The mean redshift is 0.11, as expected, although the clear signature of clustering shows that we are still far from having a representative volume of the universe, in which the deviations from the redshift distribution approach the Poisson limit.
(a) 
(b) 
Preliminary measurements of the galaxy correlation function are shown in Figure 5. The redshift-space distortion of the distribution is illustrated in Figure 5a, which shows , the correlation function in redshift-space as a function of separation in the plane of the sky () and along the line-of-sight (). At small separations we see that the correlation function is flattened along the line of sight due to the finger-of-god effect. At sufficiently large separations (i.e. in the linear regime) we expect a flattening in the plane of the sky that depends on , although the preliminary determination of presented here is too noisy on large scales to permit an estimate of . We can project in the plane of the sky (i.e. onto the axis) to obtain the projected real-space correlation function . Figure 5b shows , since (the deprojected real-space correlation function) in the case of a power-law, . For 10 h-1 Mpc we find that in agreement with most previous studies and notably with the prediction by Baugh and Efstathiou (1993) from the deprojection of the angular correlation function for the full APM galaxy survey. On larger scales is as yet poorly determined due to the small number of fields and their irregular geometry.

Although so far we have observed too few fields to effectively address questions of large-scale structure, we do have a sufficiently large sample of redshifts to begin to look at the properties of local galaxies. Figure 6 shows the galaxy luminosity function for the entire sample. This preliminary determination uses a single global K-correction and is normalized by the number counts from the APM input catalogue, so that the both the shape and normalization may change in the final analysis. Note however that we are achieving a good determination of the luminosity function 5 magnitudes below even with this small subset of the full survey. The LF is generally well represented by a Schechter function with , and .

The crucial missing element in this analysis is a spectral classification scheme, needed both in order to determine K-corrections for individual galaxies and also in order to investigate the variation in the luminosity function for different galaxy populations. As a first step towards this goal, we have determined spectral types from a principal component analysis for a subset of 3000 galaxies (Folkes et al. 1996). The galaxies were split into five spectral types based on their projection in the plane of the first two principal components (Folkes 1998). The mean spectra corresponding to each of these five spectral types are shown in Figure 7. Type 1 corresponds to a purely absorption-line galaxy spectrum and type 5 corresponds to a strongly emission-line dominated spectrum, with the other types intermediate.

The luminosity function for these 3000 galaxies with spectral types, now with appropriate K-corrections, is shown in the top left panel of Figure 8. The remaining panels of the figure show the luminosity functions for each type separately, and reveal a trend towards fainter characteristic magnitudes and steeper faint end slopes as we move from ‘early’ types (with absorption-line spectra) to ‘late’ types (with emission-line spectra). With the full survey sample we will be able to refine this analysis in exquisite detail, determining the variations in the luminosity function with both spectral type and environment (i.e. local density) simultaneously.
Previous descriptions of the 2dF galaxy redshift survey and the 2dF facility can be found in Colless (1997), Maddox (1998) and Colless and Boyle (1998). Updates are posted on the WWW at http://msowww.anu.edu.au/colless/2dF/ and http://www.ast.cam.ac.uk/2dFgg/.
References
- 1 Baugh C.M., Efstathiou G., 1993, MNRAS, 265, 145
- 2 Cole S., Hatton S., Weinberg D.H., Frenk C.S., 1998, MNRAS, in press
- 3 Colless M.M., 1997, Wide Field Spectroscopy and the Universe, Wide Field Spectroscopy, eds Kontizas M., Kontizas E., Kluwer, pp.227–240
- 4 Colless M.M., Boyle B.J., 1998, in ‘Highlights of Astronomy’, Vol.11, in press
- 5 Folkes S.R., 1998, PhD thesis, University of Cambridge
- 6 Folkes S.R., Lahav O., Maddox S.J., 1996, MNRAS, 283, 651
- 7 Glazebrook K., Offer A.R., Deeley K., 1998, ApJ, 492, 98
- 8 Maddox S.J., 1998, in ‘Large Scale Structure: Tracks and Traces’, World Scientific, in press
- 9 Maddox S.J., Efstathiou G., Sutherland W.J., Loveday J., 1990a, MNRAS, 242, 43p
- 10 Maddox S.J., Sutherland W.J., Efstathiou G., Loveday J., 1990b, MNRAS, 243, 692
- 11 Maddox S.J., Efstathiou G., Sutherland W.J., 1990c, MNRAS, 246, 433
- 12 Schlegel D.J., Finkbeiner D.P., Davis M., 1998, ApJ, 499, in press