11 (11.01.2; 11.05.2; 11.06.2; 11.09.2; 11.19.3; 11.19.7)
to H. Wu
A statistical study of the spectra of very luminous IRAS Galaxies
Abstract
111Table 1 is only available in electronic form at the CDS via anonymous ftp to cdsarc.u-strasbg.fr(130. 79.128.5) or via http: //cdsweb.u-strasbg.fr/Abstract.html.Spectroscopic observations of a sample of 73 very luminous IRAS galaxies ( for ,) from the 2Jy redshift survey catalogue were carried out using the 2.16m telescope at the Beijing Astronomical Observatory. The observational data, including the optical images (extracted from Digital Sky Survey) and spectra for these galaxies, are presented in paper I (Wu et al., 1998). In this paper, we give the spectral and morphological classifications for these very luminous IRAS galaxies (VLIRGs). We show that about 60% of VLIRGs exhibit AGN-like spectra (Seyfert 1s, Seyfert 2s, LINER-like galaxies). This fraction goes up to 82% for the ultraluminous IRAS galaxies (ULIRGs) subsample (). 56% of the VLIRGs show strong interaction or merging signatures; this fraction rises to 91% for the ULIRGs. These statistical results strongly suggest that interaction triggers nuclear activities and enhances the infrared luminosity. We find that LINER and a mixture type which have optical properties of both HII galaxies and LINERs could be at the transition stage from infrared luminous HII galaxies to AGNs; their main energy production is from starbursts as well as AGNs.
Both infrared luminosities and equivalent widths increase dramatically as nuclear separations between VLIRGs and their nearest neighbors decrease. There is little doubt that strong starbursts happen in the nuclei of VLIRGs. Assuming class 0 as advanced merger, we construct a simple merger sequence, from morphological classes 1 to 4 (with near or far companions), to class 5 and 6 (interacting pairs and mergers) and then to class 0 (isolated galaxies). Along this sequence, VLIRGs evolve from HII galaxies to AGNs.
keywords:
luminous infrared galaxies – spectra – environment1 Introduction
Very luminous infrared galaxies (VLIRGs) , especially ultraluminous infrared galaxies (ULIRGs) have bolometric luminosities comparable with quasars and dominate the top end of the galaxy luminosity function (Soifer, et al., 1987). Many theoretical and observational studies (Sanders et al., 1988; Norris et al., 1988; Struck-Marcel and Tinsley, 1978; Rieke et al., 1980; Norman and Scoville, 1988; Rieke, 1988; Condon et al., 1991; Leitherer and Heckman, 1995) show that the high infrared luminosities are associated with the phenomena of active galactic nuclei (AGNs) and starbursts, rather than the radiation from an old stellar population (Thronson, et al., 1990) and cloud-cloud collision (Harwit, et al., 1987).
The main energy output mechanism for luminous infrared galaxies is still being debated. Both AGNs and starbursts have been proposed as the main energy provider. Sanders et al. (1988) found that a high proportion of AGNs seems to be present in ULIRGs, but Rigopoulou, Lawrence and Rowan-Robinson (1996) found that the starburst model fits well the radio, sub-millimeter/IR to soft X-ray observations for Sanders’ 10 ULIRGs. Recent 3D infrared spectroscopic imaging observation (Kroker et al., 1996) suggests that both Seyfert 1 nucleus and circumnuclear star formation contribute significantly to the total luminosity. It is possible that AGNs and starbursts co-exist in the central region. Recently, Veilleux, Sanders and Kim (1997) reported the results of a near-infrared search for hidden broad-line regions in a sample of 25 ULIRGs with no broad-line regions in the optical band. They detected broad recombination lines in five objects and all of them are Seyfert 2 galaxies. This observation provides important clue that there could exist evolution connection from nuclear starbursts to AGNs in the central region of luminous infrared galaxies.
In order to learn more about the central region of luminous infrared galaxies, and to understand the possible evolutionary process from starbursts to AGNs and how they are associated with galaxy’ interaction/merging, we carried out spectroscopic observations for a large sample of 73 VLIRGs compiled from the 2Jy redshift survey catalogue (Strauss et al. 1990, 1992). The spectra and the optical images were presented in a companion paper (Wu et al. 1998, hereafter paper I). In this paper, we report the spectral classification and analysis for the sample (section 2). The morphological classification and their environmental properties are discussed in section 3. In section 4, we point out a possible spectral evolutionary process of luminous infrared galaxies using the relationship between the spectral and morphological classifications. A possible nuclear and evolutionary model for these galaxies is then constructed. Throughout this paper, we use and .
2 Spectral analysis
2.1 Choice of line ratios
Active galaxies are normally classified spectroscopically by several emission line ratios (Veilleux and Osterbrock 1987, hereafter VO87). Following VO87, we select lines with higher signal to noise ratios. The ratios are formed by only one element or with HI Balmer lines and the wavelength separation are chosen to be small, in order to minimize the effects caused by low accuracy, reddening, flux calibration and different metallic abundances. The ratios we used are , , and .


2.2 Line ratios
Before performing spectral classifications, we first correct reddening for emission lines. In principle, reddening includes contributions from the Galaxy, the intergalactic medium and the host galaxy. We ignore the second term since it is expected to be small and there is little knowledge. The Galactic reddening is corrected according to the Burstein and Heiles’ (1984) machine-readable reddening table. Since almost all the galaxies we observed have emission lines, and most of them show both and emissions, we can obtain the host galaxy reddening from the ratios of . The Whitford reddening curve as parameterized by Miller and Mathews (1972) is used. We adopt an intrinsic ratio of 2.85 for HII galaxies and 3.10 for LINERs and Seyferts (Veilleux et al., 1995, hereafter V95). The color excesses E(B-V) can be derived by the relation (Gebel, 1968 and VO87), here is defined by (Miller and Mathews, 1972):
The Galactic color excess, observed and theoretical , color excess of host galaxies, observed and de-reddened emission line ratios are listed from column 2 to column 8 in table 1. We also give the continuum ratios at and in column 9. The uncertainty is about 15% as discussed in paper I. Colons(:) and semicolons(;) indicate values with uncertainties about 30% and 50% respectively.
It is clear from table 1 that for most of our sample galaxies, the reddening corrections are very small, so the errors mainly come from the measurement and aperture effects due to different slit-widths and extraction windows. Since most of the sources have strong line emission of ,, , and , the errors from measurements are less than 10%. From the observation and data reduction, we found that aperture effect introduce errors no larger than the measurement errors. Therefore the final errors for these lines are about 10%-15%. For the line the lower S/N and possible blending make the measurement harder, as a result the line ratio is more uncertain (cf. paper I and section 4.1).
2.3 Spectral classification
The early classification criterion was given by Baldwin, Phillips and Terlevich (1981), which was based on the ratio of and mean excitation to distinguish HII galaxies, Seyfert 2s and LINERs. However, most of our spectra do not cover the line and further a reliable determination of this line ratio is often difficult even when this line is covered due to its low S/N, therefore, following Osterbrock (1989), we use the line ratios of , , and for classification purposes instead. The diagnostic diagrams of classifications are shown in Figs. 1-3. The curve and horizontal line at figures divide each panel into three areas. HII galaxies locate at the left side of the curve. The line , is used to separate AGN with high excitations – Seyfert 2’s from LINERs. We also plot the mean error bar in the low-left.
It is obvious from Figs.1-3 that there is no clear boundary to separate the different types of galaxies, especially HII galaxies and LINERs. There are quite a few sample galaxies located near the solid curves at figures. Though we have considered the possible errors, there are still some objects which can not be satisfy all the definitions of either HII galaxies or LINERs; for these galaxies they locate at HII galaxies region in one or two diagnostic diagrams, but locate at LINERs region in other diagnostic diagrams. We therefore classify these galaxies as a mixture type. The mixture type galaxies show some similar properties as the LINERs and could be a transitional phase from HII galaxies to AGN (see section 4).
It is clear from Figs. 1-3 that there are no galaxies with relatively high ionization level () at the HII galaxy region. This distribution of VLIRGs at the diagnostic diagrams is quite different from the optical sample of VO87, but similar with the results from the the IRAS Bright Galaxy Survey (BGS, V95) and the infrared color-selected samples (Armus, Heckman and Miley, 1989). As pointed out by Allen et al. (1991) that the high ionization HII galaxies include extreme starbursts and WR galaxies, the lack of high ionization galaxies in VLIRGs (We found only few WR galaxy in our sample) indicates that VLIRGs do not belong to the young starburst population.
The classifications are listed in column 10 of table 1. “H” stands for HII galaxy, “L” for LINER, “S2” for Seyfert 2 and “S1” for Seyfert 1. We use “LH” to represent the mixture type with properties of both HII galaxies and LINERs. “S?” is for unclassified AGNs which can only be distinguished from HII galaxy, due to the lack of data on . ”O” represents galaxies which can not be classified because they show no or few observed emission lines. We also list the Verons’ classification (1993) for some sources in column 11. For most objects the two classifications are consistent. However, there are two objects IR23254+0830 and IR13536+1836 which are classified as Seyfert 1’s in Verons’ Catalogue but show Seyfert 2 properties in our optical spectra and show Seyfert 1 properties only in polarized spectra (Miller and Goodrich, 1990). A Seyfert 1 galaxy – IR23532+2513B (Zou et al., 1995) and a Seyfert 2 galaxy –IR23594+3622 are discovered by us.

2.4 Statistic results
Because more than 40% of our sample galaxies are in pairs, possible groups of galaxies or the systems with double nuclei or multi-nuclei of galaxy, the first thing is to determine which component emits the high infrared luminosity. For most target galaxies, the identification is easy using the IRAS position and error ellipse. But for a few sources, we have to use the infrared colors or follow the method of V95 by orders of activity (Seyefrt 1, Seyfert 2, LINER and HII galaxy) to identify the optical counterparts.
The statistical results of classification are listed in table 2a-c. We present the results of both spectral and morphological classes in these tables. Morphological class would be discussed in section 3.1. In order to keep the results of statistics complete, throughout the paper we use the sample of 73 VLIRGs for statistics. From table 2, we can see that there are 40% (29/73) HII galaxies in our VLIRGs sample, which is lower than 59% in BGS (V95). It results from our selection of IRAS galaxies with higher infrared luminosity. AGNs (Seyfert 1s, Seyfert 2s, LINERs and mixture types) appear in 44 nuclei (60%) of galaxies. Here we include the mixture types, because they show some similar properties as LINERs as will be shown in section 4.2. There are 6 Seyfert 1’s (8%), 6 Seyfert 2’s (8%), 6 LINERs (8%), 23 mixture types (32%) and 3 unclassified AGNs (4%). It is obvious that LINER-like objects (LINERs and mixture types) dominate the infrared luminous AGN (66%, 29/44). For a ultraluminous subsample with 11 galaxies, there are 2 HII galaxies (18%), 3 Seyfert 1’s (27%), 1 Seyfert 2’s (9%), 2 LINERs (18%), 2 mixture types (18%) and 1 unclassified AGN (9%). For the subsample with , there are 3 Seyfert 1s (5%), 5 Seyfert 2s (8%), 4 LINERs (6%), 21 mixtures (34%), 2 unclassified AGNs (3%) and 27 HII galaxies (44%).
It is clear from our statistical results that the proportion of AGNs (82%) in the ultraluminous subsample is much higher than that in relatively lower luminous subsample (56%). In addition, the LINER-like galaxies in AGNs decrease rapidly from 71% (25/35) to 44% (4/9), in contrast Seyfert 1s in AGNs increase from 9% (3/35) to 33% (3/9). All these results support the point of view of V95 that the proportions of AGN-like and Seyfert-like galaxies increase as the infrared luminosity increases. The proportions of Seyferts are 13% (8/62) and 36% (4/11) for our lower and higher infrared luminosities’ subsamples, respectively. We conclude that our two subsamples have different statistical properties; higher infrared luminosity relates strongly with AGN phenomena.
2.5 Dust in VLIRGs


We have three dust indicators: E(B-V), EW(NaID) and C6563/C4861(Ratio of continuum fluxes at 6563 and 4861). E(B-V) represents the reddening of line emission region, C6563/C4861 probes the reddening of continuum emission region and EW(NaID) the interstellar reddening. E(B-V) is obtained from the ratio of . The systematic errors in E(B-V) is unavoidable from the larger wavelength separation of and . Furthermore, the aperture sizes in observation and extraction could introduce uncertainty due to the complex geometric structure of dusty regions in the nuclei of VLIRGs. The underlying stellar absorption of and could also influences the accurate measurement of and emission. Combined all these possible factors, the uncertainty of could be as large as 20%-25%. Similar to , the measurement of continuum C6563/C4861 may also have a larger uncertainty, 20%, because of the large wavelength separation. For EW(NaID), the error is about 10%-15%.
Fig. 4 is a histogram of E(B-V) for different types of VLIRGs. The median values of E(B-V) for Seyfert 1s, Seyfert 2s, LINERs, Mixtures and HII galaxies are 0.02, 0.97, 0.92, 1.02 and 0.86 respectively. K-S tests show that the probability that Seyfert 1 are drawn from the same distribution as the other four types of galaxies is less than 0.03. Fig. 4 also shows the distributions of EW(NaID). It shows that the Seyfert galaxies have lower median EW(NaID) (0.0 for Seyfert 1’s and 2.2 for Seyfert 2’s) than that of others (3.2 for HII galaxies, 4.2 for mixture types and 5.6 for LINERs). LINERs and mixture types have larger NaID absorption than HII galaxies. Both E(B-V) and EW(NaID) show that Seyfert 1s have less dust and LINER-like galaxies show more dust than that of HII galaxies.
Fig. 5 is a plot of EW(NaID) versus E(B-V) for different types of VLIRGs. Seyfert 1’s have the lowest E(B-V) and EW(NaID) values, indicating that they are not much affected by dust. For HII galaxies, there is a significant correlation between the E(B-V) and EW(NaID); the probability that the correlation is fortuitous is 0.015. supports the interstellar origin of NaID absorption. Similar correlations exist among other dust indicators for HII galaxies (Figs. 6 and 7): the probability of no-correlation between C6563/C4861 and E(B-V) for HII galaxies is 0.0016, and that between C6563/C4861 and EW(NaID) is 0.02. These strong correlations indicate that all three reddenings have a similar origin and HII galaxies have a simple nuclear structure.
However the statistical tests do not show significant correlations among the three reddening indicators for the LINER-like galaxies and Seyfert 2’s. This indicates that the line and continuum emission may come from different regions in the nuclei, and the nuclear or circumnuclear regions are much complex compared with those of HII galaxies.
2.6 emission
As an indicator of star formation, emission is clearly quite important. Fig. 8 shows the distribution of equivalent width of for different types of galaxies. The median EW() are 197, 89, 35, 34 and 55 for Seyfert 1s, Seyfert 2s, LINERs, mixture types and HII galaxies respectively. It is clear that the Seyfert galaxies have the strongest emission, and LINER-like galaxies the weakest. We found that the LINER and mixture type of galaxies have similar median value of EW(). K-S tests show that, among the five types, only LINERs and mixture types could come from the same population (the K-S probability is 0.996). It indicates that these two types have similar emission properties. therefore, it is reasonable to combine them as a LINER-like type as we have used in section 2.4 (see also section 4.2).
3 Galaxy interaction
3.1 Classification of galaxy interactions
A number of CCD images of ULIRGs are now available, such as deep optical images (Leech et al. 1994), near-infrared images (Murphy et al., 1996) and HST images (Surace et al., 1998). Unfortunately, the overlap number of galaxies with CCD images with our sample is small. Our morphological classification and the study of environments of VLIRGs are based on the Digital Sky Survey (DSS) images (see Paper I). For the overlap galaxies with CCD images, our classification do not conflict with those based on the near-infrared or HST images.
We use the classification scheme for VLIRGs of Lawrence et al. (1989), who define isolated galaxies as class 0, galaxies with far and near companions as class 1 to 4, interacting pairs as class 5 and mergers as class 6. Morphological classifications and environment parameters for our sample galaxies are listed in table 3. In practice, we find it difficult to separate class 5 from class 6, because there is no exact dividing line between interacting pairs and mergers, it is therefore better to join classes 5 and 6 into a single class. Also one should be careful to define class 0. Our statistics show that this type has similar maximum infrared luminosity to that of class 5 and 6 and higher than that of class 1-4. Moreover, the percentage of AGN in class 0 is even higher than that in class 5 and 6 (see section 4.3). Therefore, it is likely that the class 0 is in the advanced or post merging stages.
As described in section 2, table 2a-2c list the statistics of morphological types for the whole sample and two subsamples. It is clear from table 2a that 56% (41/73) of VLIRGs are interacting or merging systems (class 5 or class 6). 18% (13/73) are isolated (class 0). The fraction of class 1-4 objects are about 26%.
For the subsample with , nearly all the objects, namely 91% of ULIRGs, are strong interaction or merging systems (there are 10 ULIRGs belong to class 6 and the rest belong to class 0). These results are consistent with those of Sanders et al. (1988), Melnick and Mirabel(1990) and Clements et al. (1996a,b); the fractions are, however, higher than those found by Zou et al. (1991, 1993) and Leech et al. (1994). The different results for ULIRGs can be understood as follows: most of ULIRGs in Sanders’, Melnick’s and our sample are nearby galaxies with redshifts , for which the disturbed features could be detected more easily than the ULIRGs in Zou et al.’s and Leech et al.’s samples, which are most far-away.
In order to avoid the large optical reddening, Murphy et al. (1996) obtained near-infrared images of 56 ULIRGs, 95% of these show evidence for current or past interaction. Recently, Surace et al.(1998) present HST images of 9 ULIRGs, in which 8 sources are advanced mergers. These near-infrared and high-resolution HST images show that there may exist very few truly isolated ULIRGs with no disturbed features. It should be very interesting to study the small class of “isolated” galaxies with high resolution and/or infrared imagings.
It is also obvious from table 3 and DSS images that at least 14% (10/73) of VLIRGs are in groups of galaxies or in multiple-merging systems: 7 VLIRGs are located in groups of galaxies which include at least 3 galaxies with consistent redshifts, and 3 VLIRGs with multiple-nuclei. For example, IRAS 23532+2513 (Zou, et al., 1995) is in a compact group with one Seyfert 1 galaxy and one starburst galaxy. Mrk 273 is a multiple-merging system with 10 faint objects (within a projected distance of 100kpc), one of which is a companion dwarf galaxy showing an unusually high soft X-ray luminosity (Xia et al., 1998). ULIRGs and VLIRGs seem to be evolutionally connected with compact groups of galaxies; studying this class of galaxies may provide important clues for galaxy evolution.
3.2 Projected separation
The separation between an infrared galaxy and its nearest neighbor in double or multiple-nuclei is one important parameter that describes the intensity of galaxy interaction. It is also a good indicator of evolution in interacting galaxies. Since we can not obtain the physical separation between two objects we have to use projected separation instead. Bushouse, Lamb and Werner (1988), Telesco et al. (1988) and Wei (1990) have studied this parameter on optically selected interacting pairs. Wei (1994) also extended this to far-infrared galaxies. But since there was no redshift data for each source, these results are prone to errors induced by chance alignment. In contrast, the redshift information obtained from our observed spectra completely eliminate this error and allow us to study the relation between projected separations and activities of VLIRGs.
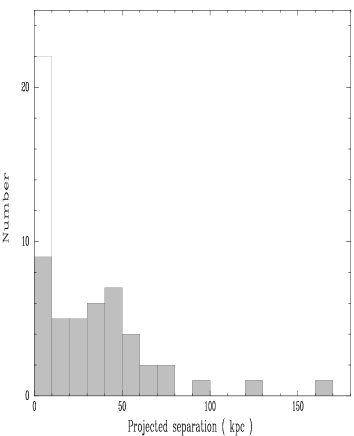
The angular separations measured from the DSS images are transformed to projected separations using the redshift of infrared galaxies. For groups or multiple-nuclei, the minimum separation is used. Fig. 9 shows the distribution of projected separation. The hollow box includes the isolated galaxies, which are assumed as advanced merger with only one remaining nucleus. It can be seen that most VLIRGs have companion within 50kpc. This is consistent with previous works by several authors that more active far-infrared galaxies have closer companions. If we include the isolated galaxies, we find that for large number of VLIRGs the project separations are smaller than 10kpc.

Fig. 10 shows the relation between infrared luminosities and the projected separations of VLIRGs. Though there is no obvious correlation between them, the upper limiting boundary line (dotted line) decreases dramatically as projected separations increase. This trend can be easily understood as a result of projection effects. It is reasonable to assume that the fitted envelope line represents the relationship between infrared luminosity and true separation. We define a character separation as the separation when the infrared luminosity is about half of the peak value of very close sources (separation ). The separation is found to be about 10kpc with a corresponding infrared luminosity is . This result agrees with that of Melnick and Mirabel (1990) and Murphy et al. (1996).

A similar behavior can be also seen in a plot of equivalent width versus projected separation (Fig. 11). The envelope line goes up rapidly as the separation decreases. Considering that both infrared luminosity and equivalent width are good indicators of star formation, Figs. 10 and 11 strongly suggest that interactions trigger starbursts.
3.3 Relative Radial velocity
Besides the projected separation, the relative velocity is another important parameter that quantifies the interaction between galaxies. Since the true relative velocity can not be obtained, we use the relative radial velocity inferred from the redshift difference between an infrared source and its nearest companion. The uncertainty in the relative radial velocity is 30km/s in our data. Fig. 12 shows the distribution of relative radial velocity. It is clear that the companions for most VLIRGs have small relative radial velocities. Fig. 13 shows that the equivalent width increases as the relative radial velocity decreases. This relation is very interesting because it imply that small relative radial velocity among interaction galaxies should be the favorate condition for triggering starburst.


4 Discussion
4.1 Comparison with V95
Because our VLIRGs sample are selected from 2Jy redshift survey catalogue which covers the BGS () sample, there are a large number of overlap galaxies between our sample and the V95 sample. The total overlap number is 37 if we count companions. We compare these overlap galaxies in the diagnostic emission line ratios, such as , , and .
The ratios of and for these two samples agree very well, with mean difference less than 0.02 and scatter about 0.1; the difference is within our error bar (see section 2.2). However, the mean difference and scatter for the ratios of are much larger, about 0.06 and 0.21, respectively. The reason is that the emission lines for most sample galaxies are weak and blended, and are therefore more uncertain. For , the difference and scatter are also large, about 0.05 and 0.23, respectively. This can not be solely attributed to the low S/N because the line for most sample galaxies is strong. As we have discussed before, the reason could be due to several factors, such as aperture effects, underlying stellar absorption of the host galaxy, etc.
There is a difference in the color excess E(B-V) between two samples. Our mean value of E(B-V) is 0.99, which is about 0.13 lower than that of 1.12 of V95 in the overlay objects. The Galactic extinction can account for one-fourth(0.03). The remainder could come from different estimates of underlying stellar absorption, aperture effect (e.g., IR23488+1949A) and possible low S/N of of spectra.
Since spectral classification is based on emission line ratios, aperture effect and other uncertainties can also render different spectral classifications. A comparison shows that the our and V95’s classifications agree for about 70% (26/37) of the overlap objects.
4.2 LINER-like VLIRGs
The original definition of LINERs by Heckman (1980) was based on the following conditions on oxygen forbidden line ratios, namely, and . However, the spectra for most of our galaxies do not cover the wavelength of and the large wavelength separation between and could bring serious errors due to uncertain reddening correction. Therefore we use the criteria suggested by VO87 instead. In fact, for the galaxies with line, the two definitions are consistent.
As discussed at section 2.3, some of our sources present properties of both HII galaxy and LINER, and could not be classified accurately as either type. We classify them into a mixture type. From the spectral analysis, we find that they are similar with LINERs for the properties of reddening and emission, so we regard the mixture types as LINER-like galaxies.
Considering that the mixture type VLIRGs show spectral features of both LINERs and HII galaxies, we can also assume that LINER-like galaxies could be the composite systems consisting of both AGN and HII region components. As discussed in section 2.3, a few HII VLIRGs present high ionized level, the combination of such low ionized HII spectra and AGN spectra is similar to the spectra of LINER-like galaxies. Nearby galaxy NGC7679 (V95) is a good example for this assumption. As the aperture size increases, the spectrum of NGC7679 changes from that of Seyfert 2 to LINER-like type. This supports the idea that NGC7679 has an active nucleus and circumnuclear HII region. Recent high resolution HST images (Surace et al. 1998) show that there indeed exist many blue “knots” of star formation region in the inner few kpc of ULIRGs as well as possible active nuclear.
In summary, it is very probably from our spectral analysis that the LINER-like VLIRGs are mixture type galaxies with both active nucleus and starburst regions. Also this type of galaxies may at the evolution stage from nuclear starbursts to AGNs. As AGN features become more dominant, they evolve toward the optical AGNs.
4.3 Relationship between spectral and interaction classifications
Spectral classifications provide information about the main energy output mechanism for galaxies whereas morphological classifications give the knowledge of evolution phase of interaction galaxies. The correlation between these two types of classifications may give important clue for understanding the possible evolution connection between starbursts to AGNs.
In section 3.2 we analyzed the statistical properties of optical and infrared properties as a function of the nuclear separation in the double or multiple-nuclear system. As the separation decreases, both infrared luminosity and equivalent width increase. Since both infrared luminosity and equivalent width are indicators of star formation, it is very clear that as the separation decreases, the star formation rate increases.
Table 2 gives the results of spectral and morphological classifications. As we discussed in section 3.1 we combine seven morphological types into three types, namely, galaxies with near or far companions (class 1 to 4), interacting or merging galaxies (class 5,6) and isolated galaxies (class 0), and assuming that the isolate galaxies are at the last phase of merging, although there still exists the possibility that some of them are truly isolated galaxies and not at the end-state of merging. These three new types construct a simple merger sequence. From table 2, we can see that the fraction of HII galaxies in VLIRGs decreases rapidly along the merger sequence, from 53% (10/19) of class 1-4 to 39% (16/41) of class 5-6 and then to 23% (3/13) of class 0. On the contrary, the fraction of AGN (LINER-like galaxies, Seyferts) increases dramatically. The corresponding fractions of LINER-like galaxies are 37%, 37% and 54% and those of Seyfert 1s are 5%, 7% and 15%, respectively. Therefore, we can conclude that along the evolutionary sequence of interacting galaxy, the spectral properties of VLIRGs change from HII-like to AGN-like. In the last merger stage, they could evolve either to Seyfert 1’s or LINERs.
We have discussed in section 4.2 that quite a few VLIRGs are in loose or compact groups of galaxies. For the ten confirmed VLIRGs in group of galaxies in our sample, 8 are HII galaxies, one is a LINER-like galaxy and one is an unclassified AGN. There are no Seyfert in these groups. The high proportion of HII galaxies indicates that VLIRGs in group of galaxies are in the early evolution phase and the Seyferts or LINERs could also be formed in the more advanced stage of multiple-merger process. Therefore, the existence of relatively large fraction 14% (10/73) of VLIRGs in groups hints that merging is an important evolutionary process during galaxy formation.
5 Conclusion
We have conducted a spectroscopic survey for a complete sample of VLIRGs selected from the 2Jy redshift survey catalogue. We have studied their optical properties and the spectral and morphological classifications for these objects. Important clues are found concerning the nature of VLIRGs and the possible evolution connection between starbursts and AGNs.
References
- [1] Spectral classification shows that over half (60%,44/73) of VLIRGs present AGN-like spectra. As the infrared luminosity increases, this fraction increases from 56% () to 82% (). If we exclude LINER-like galaxies, the fraction of AGNs is 13%, 36% for the two subsamples, respectively (see table 2 a-c).
- [2] From HII galaxies to AGNs, there is no clear boundary in the diagnostic diagrams (see Figs. 1-3). We classified galaxies with both HII and LINER spectral features as a mixture type. Evidences show that this type of VLIRGs has similar properties as LINERs. We combine the LINERs and the mixture type into a single class as LINER-like galaxies.
- [3] Statistics show that there exist correlations among three dust indicators: E(B-V), EW(NaID) and C6563/C4861 in the nuclei of HII galaxies, but not in the nuclei of LINER-like galaxies and Seyfert 2s. This indicates complex nuclear structures of AGNs. The line and continuum emission could come from different nuclear or circumnuclear regions. Seyfert 1’s show less reddening.
- [4] As separations between VLIRGs and their nearest neighbors decrease, infrared luminosities and equivalent widths increase significantly. There exists a character separation, about 10kpc, in ULIRGs, below which the infrared luminosity becomes . The histogram of the relative velocity shows that many of our sample galaxies have even smaller separations, which provides the favorable condition for triggering starbursts, and hence the high infrared luminosities for theses objects.
- [5] It is clear from the relationship between spectral and morphological types that the interaction between galaxies triggers massive starbursts as well as nuclear activities. VLIRGs have circumnuclear starburst regions around central AGN. As the spectra evolve from HII-like to AGN-like, the dominant energy output mechanism for VLIRGs changes from starbursts to AGNs.
Acknowledgements.
We would like to thank Dr. J.Y. Wei for his support for the project. Many thanks are due to Profs. J.Y. Hu, J.H. Huang, H.J. Su and Dr. S. Mao for valuable suggestions. We are grateful to Prof. J.S. Chen and his group for their help in the data analysis. Finally, we acknowledge Dr. M.A. Strauss for his valuable comments on this paper. This work was partially supported by NSFC.References
- [1] Allen, D.A., Norris, R.P., Meadows, V.S., and Roche, P.F., 1991, MNRAS, 248, 528
- [2] Armus, L., Heckman, T. and Miley, G.K., 1989, ApJ, 347, 727
- [3] Baldwin, J.A., Phillips, M.M.,and Terlevich, R., 1981, PASP, 93, 5
- [4] Burstein, D., and Heiles, C, 1984, ApJS, 54,33
- [5] Bushouse, H.A., Lamb, S.A., and Werner, M.W., 1988, ApJ, 335, 74
- [6] Clements, D.L., Suherland, W.J., Saunders, W., Efstathiou, G.P., Mcmahon, R.G., Maddox, S., Lawrence, A. and Rown-Robinson, M., 1996a, MNRAS, 279, 459
- [7] Clements, D.L., Sutherland, W.J., McMahon, R.G. and Saunders, W., 1996b, MNRAS, 279, 477
- [8] Condon, J.J., Huang, Z.P., Yin, Q.F. and Thuan, T.X., 1991, ApJ, 378, 65
- [9] Gebel, W.L., 1968, ApJ, 153, 743
- [10] Harwit, M., Houck, J.R., Soifer, B.T. and Palumbo, G.G.C., 1987, ApJ, 315, 28
- [11] Heckman, T.M., 1980, A&A, 87, 152
- [12] Kroker, H., Genzel, R., Krabbe, A., Tacconi-Garman, L.E., Tecza, M., Thatte, N. and Beckwith, S.V.W., 1996, ApJ, 463, L55
- [13] Lawrence, A., Rowan-Robinson, M., Leech, K.J., Jones, D.H.P. and Wall, J.V., 1989, MNRAS, 240, 329
- [14] Leitherer, C. and Heckman, T.M., 1995, ApJS, 96, 9
- [15] Leech, K.J., Rowan-Robinson, M., Lawrence, A. and Hughes, J.D., 1994, MNRAS, 267, 253
- [16] Melnick, J., and Mirabel, I.F., 1990, A&A, 231, L19
- [17] Miller, J.S., and Mathews, W.G., 1972, ApJ, 172, 593
- [18] Miller, J.S., and Goodrich, R.W., 1990, ApJ, 355, 456
- [19] Murphy, T.W., Armus, J.L., Matthews, K., Soifer, B.T., Mazzarella, J.M., Shupe, D.L., Strauss, M.A. and Neugebauer, G., 1996, AJ, 111, No.3, 1025
- [20] Norman, C. and Scoville, N., 1988, ApJ, 332, 124
- [21] Norris, R.P., 1988, MNRAS, 230, 345
- [22] Osterbrock, D.E., 1989, Astrophysics of Gaseous Nebulae and Active Galactic Nuclei, University Science Books, Mill Valley, California
- [23] Rieke, G.H., Lebofsky, M.J., Thompson, R.I., Low, F.J., and Tokunaga, A.T., 1980, ApJ, 238,24
- [24] Rieke, G.H., 1988, ApJ, 331,L5
- [25] Rigopoulou, D., Lawrence, A., and Rowan-Robinson, M., 1996, MNRAS, 278, 1049
- [26] Sanders, D.B., Soifer, B.T., Elias, J.H., Madore, B.F., Matthews, K., Neugebauer, G. and Scoville, N.Z., 1988, ApJ, 325, 74
- [27] Soifer, B.T., Sanders, D.B., Madore, B.F., Neugebauer, G., Danielson, G.E., Elias, J.H., Lonsdale, C.J. and Rice, W.L., 1987, ApJ, 320, 238
- [28] Strauss, M.A., Davis, M., Yahil, A., and Huchra, J.P., 1990, ApJ, 361, 49
- [29] Strauss, M.A., Huchra, J.P., Davis, M., Yahil, A., Fisher, K.B. and Tonry, J., 1992, ApJS, 83, 29
- [30] Struck-Marcell, C. and Tinsley, B.M., 1978, ApJ, 221, 562
- [31] Surace, J.S., Sanders, D.B., Vacca, W.D., Veilleux, S. and Mazzarella, J.M., 1998, ApJ, 492, 116
- [32] Telesco, C.M., Wolstencroft, R.D., and Done, C., 1988, ApJ, 329, 174
- [33] Thronson, H.A., Majewski, J.S., Descartes, L. and Hereld, M., 1990, ApJ, 364, 456
- [34] Veilleux, S., and Osterbrock, E., 1987, ApJS, 63, 295 (VO87)
- [35] Veilleux, S., Kim, D.C., Sanders, D.B., Mazzarella, J.M. and Soifer, B.T., 1995, ApJS, 98, 171(V95)
- [36] Veilleux, S., Sanders, D.B., and Kim, D.C., 1997, ApJ, 484, 92
- [37] Veron-Cetty, M.-P., and Veron, P., 1993, A Catalogue of Quasars and Active Nuclei (6th Edition)
- [38] Wei, J.Y., 1990, Master Degree Thesis
- [39] Wei, J.Y., 1994, Ph.D thesis
- [40] Wu, H., Zou, Z.L., Xia, X.Y. and Deng, Z.G., 1998, A&AS, 127, 521(Paper I)
- [41] Xia, X.Y., Boller, Th., Wu, H., Deng, Z.G., Gao, Y., Zou, Z.L., Mao, S. and Börner, G., 1998 ApJL, in press (astro-ph/9801238)
- [42] Zou, Z.L., Xia, X.Y., Deng, Z.G. and Su, H.J., 1991, MNRAS, 252, 593
- [43] Zou, Z.L., Xia, X.Y., and Deng, Z.G., 1993, Publ. Beijing Astronomical Observatory, No.23, 103
- [44] Zou, Z.L., Xia, X.Y., Deng, Z.G. and Wu, H., 1995, A&A, 304, 369