Snapshot Distances to Type Ia Supernovae – All in “One” Night’s Work
Abstract
We present an empirical method which measures the distance to a Type Ia supernova (SN Ia) with a precision of 10% from a single night’s data. This method measures the supernova’s age and luminosity/light-curve parameter from a spectrum, and the extinction and distance from an apparent magnitude and color. We are able to verify the precision of this method from error propagation calculations, Monte Carlo simulations of well-sampled SNe Ia, and the Hubble diagram of scarcely observed supernovae. With the reduction in telescope time needed, this method is three to four times more efficient for measuring cosmological parameters than conventional light-curve based distance estimates.
1 Introduction
The explosion of a Type Ia supernova (SN Ia) is a catastrophic phenomenon veiled in layers of complexity. Recent efforts to monitor these events have led to an increased ability to predict, if not fully understand, the stages of SN Ia evolution.
The model for the photometric history of SNe Ia has been refined from a homogeneous description Leibundgut (1988); Branch & Miller (1993); Sandage & Tammann (1995) to one which characterizes a relation between peak luminosity and light-curve shape Phillips (1993); Hamuy et al. (1995, 1996); Riess, Press, & Kirshner (1995); Kim et al. (1998). The slower, broader light-curves are intrinsically brighter at peak than the faster, narrower light-curves. Recognizing and exploiting such relations has led to a renaissance in the use of SNe Ia as extragalactic distance indicators. Extending luminosity/light-curve relations to multiple passbands separates the competing effects of dust, intrinsic differences, and distance on the light of SNe Ia Riess, Press, & Kirshner (1996a). Distances with 5-10% uncertainty can be obtained using the light-curve shapes of well-observed supernovae.
The optical spectra of SNe Ia are rich in information [see Filippenko (1997) for a review]. Many of the elements synthesized and ejected in the explosion have been identified despite the blending of their high-velocity profiles Branch et al. (1983); Nugent (1997). In addition, the relative strengths of some spectral features have been shown to correlate with SN Ia peak luminosity Nugent et al. (1995). As the supernova evolves, predictable casts of features appear and disappear, illuminated by the photosphere’s recession through the synthesized layers. The temporal evolution of these features is sufficiently reliable to be used as a clock to determine the current age of a SN Ia to a precision of 1-2 days Minkowski (1939); Riess et al. (1997a).
Unfortunately, supernovae occur without warning, making it difficult to collect the observations necessary to measure their distances. Observing an unscheduled event in up to four filters many times over the course of 100 days is a time consuming and logistically formidable task. The observing record for a typical SN Ia is quite fragmentary. Following this process, it will be many years of work to gather the number of SN Ia distances necessary to put strong limits on cosmological parameters. Even at high redshifts (), where a strategy for batch detections of multiple supernovae has made it possible to schedule supernova discoveries and their follow up Perlmutter et al. (1997), difficulties arise. Since these observations require the largest telescopes, the light-curves are typically more poorly sampled than the nearby ones caught at a similar phase.
Yet, from a single night’s observations, a SN Ia’s spectrum and photometric magnitudes can reveal its age, intrinsic luminosity, extinction, and apparent brightness. From this information one can estimate the distance to a supernova without further observations (except for the possible need of a galaxy image to subtract the host’s light).
Here we explore this possibility with two independent sets of SNe Ia. We describe this technique in §2 and its expected uncertainty in §3. In §4 we apply it to randomly selected snapshots of extensively observed SNe Ia to determine the precision of such distance estimates. In §5 we construct the Hubble diagram of “cast-off” SNe Ia: objects which were observed only once or a few times. We extend the application of this method in §6 to SNe Ia with . In §7 we discuss variations of this technique and its leverage on estimating cosmological parameters.
2 A Snapshot Distance
All of the information necessary to estimate the distance to a SN Ia may be garnered from a single spectrum and epoch of photometric magnitudes. Below we describe how to determine a SN Ia’s age, intrinsic luminosity, extinction, and distance from this glimpse. An example of how this is done is illustrated in Figure 1.
The absence or presence of features in a SN Ia spectrum is a sensitive indicator of its current age. Riess et al. (1997a) developed an algorithm to measure the spectral feature age (SFA) of a SN Ia by comparing the goodness-of-fit of its spectrum to a database of SNe Ia spectra of known age. For high signal-to-noise ratio spectra (), the age uncertainty is 1.4 days. Given a single SN Ia spectrum, we estimate the SFA in this way (Figure 1a). With two or more spectra, we can improve the age estimate by adding the individual goodness-of-fit curves in the time frame of the supernova.
Having determined the age of the spectral epoch(s), we can estimate the intrinsic luminosity of the SN Ia by measuring the ratio of specific spectral features. Nugent et al. (1995) have shown that at maximum light the ratios of the depths of the Si II absorption features at 5180 and 6150 Å [(Si II)] and the heights of features at 3940 and 3970 Å associated with Ca II [(Ca II)], are strongly correlated with the SN Ia peak luminosity and light-curve shape. Here we extend that method by correlating a luminosity/light-curve parameter with these ratios measured over the range in supernova age of six days before maximum to twenty days after maximum. For the spectral database considered by Riess et al. (1997a) and spectra of SNe Ia considered by Nugent et al. (1995) and Phillips et al. (1998) – a total of spectra – we measured (Si II) and (Ca II) as prescribed by Nugent et al. (1995). For this same set of SNe Ia, we measured the luminosity/light-curve parameter from their multicolor light-curve shapes (MLCS) Riess, Press, & Kirshner (1996a). We then derived the linear relationships between the MLCS luminosity/light-curve parameters and the spectral ratios as a function of light-curve age. These relations are described in detail in Appendix A.
For a given SN Ia spectrum we measure (Si II) and (Ca II), as shown in Figure 1b. We then estimate its luminosity/light-curve parameter from the spectral ratio relation valid for the spectrum’s SFA. If there is more than one spectral ratio or more than one spectrum we average the estimates of the luminosity/light-curve parameter weighted by the dispersion of the relations given in Appendix A.
The luminosity/light-curve shape parameter identifies the expected photometric history for the SN Ia in up to four passbands: and Riess, Press, & Kirshner (1996a). The age estimate determines when in the course of SN Ia history a photometric epoch was observed. For SNe Ia with we correct for the effect of (1+) time dilation on the difference in time between the spectral and photometric observations. We also include a K-correction on the supernova light as described by Hamuy et al. (1993) and for those at higher redshifts () as described by Kim, Goobar, & Perlmutter (1996). By placing the observed magnitudes at the appropriate time on the light-curves (with their shapes determined from the spectral ratios), we determine the apparent distance moduli (Figure 1c). Because of the reddening and absorbing properties of interstellar dust, the distance moduli of the shorter wavelength bands are expected to be equal to or greater than those of longer wavelength bands. These differences are the color excesses caused by intervening dust. If a red color excess is measured, we can use the conventional interstellar extinction law Savage & Mathis (1979); Riess, Press, & Kirshner (1996b) to correct the supernova light for interstellar extinction.
Though it may seem surprising, the natural consequence of the results of Riess et al. (1997a), Riess, Press, & Kirshner (1996b), and Nugent et al. (1995) is that the distance to a SN Ia can be measured from a single night’s observations. These works have established the tools which, when combined, reveal the predictive powers of a single epoch of SN Ia data. In the following sections we seek to answer the question of how well such limited data can constrain the distance to a SN Ia.
3 Theory of Errors
We can estimate the expected precision of these snapshot distances by propagating all known sources of error which affect the distance estimate.
Apparent distance moduli may be calculated from and apparent magnitudes, and , measured when a SN Ia is days after maximum ( may be negative), as
| (1) |
| (2) |
where and are the broad-band absolute magnitudes of a “fiducial” SN Ia, and is the difference in maximum () luminosity between the fiducial SN Ia and any other; is the luminosity/light-curve parameter for the MLCS method discussed in §2. and are proportionality constants which, when multiplied by , describe the luminosities of individual SNe Ia as a function of their age Riess, Press, & Kirshner (1996a).
The quantity of interest is the extinction-free distance, ,
| (3) |
where we assume the Galactic extinction law is valid for SNe Ia (Savage & Mathis 1979; Riess, Press, & Kirshner 1996b). The expected error in the extinction-free distance, , is given by substituting equations (1) and (2) into (3) and applying error propagation:
Both terms on the third line of equation (3) contribute an error of less than 0.02 mag to the distance estimate because , , and the value of inferred from the spectral ratios are slowly varying functions of supernova age, . The remaining error is
where we define and to separate SN Ia luminosity from color.
The first line in equation (3) depends only on the errors in the photometric magnitudes. For a likely photometric error of 0.02 mag for nearby () SNe Ia, this error contributes 0.10 mag to the distance uncertainty. The remaining terms in equation (3) are fortuitously small, as follows.
The second line in equation (3) depends on the uncertainty, , in measuring the age of a SN Ia at the time of the photometric epoch. An incorrect estimate of the age has two effects on the distance estimate which are compensatory. For example, on the post-maximum side of the light-curve, an underestimate of the age would result in an overestimate of the supernova’s current luminosity and the prediction of a distance which is too far by the amount . But this underestimate of the age would also result in a prediction that the SN Ia is currently bluer and therefore more extinguished for its observed color. This overestimate of the extinction would give a prediction for the distance which is too close by the amount . For expected age uncertainties of 1.4 days Riess et al. (1997a) over the first three weeks of typical SN Ia light-curves Riess, Press, & Kirshner (1996a), the sum of these compensating errors contributes a distance uncertainty of 0.10 to 0.15 mag (see Figure 2). However, on the pre-maximum side of the light-curve this compensation does not occur. If spectra are obtained which indicate the SN Ia is pre-maximum, it is desirable to obtain additional photometry no earlier than 3 days before maximum to take full advantage of the above effect which reduces the distance error.
The last line in equation (3) which rises with the uncertainty, , in the estimate of the luminosity/light-curve parameter , is also limited by compensating effects. An incorrect estimate of the luminosity/light-curve parameter leads to an erroneous estimate of the luminosity and color and hence of the extinction. These effects have a partially balancing influence on the distance estimate. For example, an overestimate of the luminosity by the amount would lead to a prediction that the SN Ia is farther away by , but the subsequent prediction that the SN Ia is intrinsically bluer leads to an overestimate of the extinction, and hence a prediction that the distance is closer by the amount . For likely uncertainties in the estimate of the luminosity/light-curve parameter, , of 0.20 to 0.25 mag (see Appendix A), we find this term contributes a 0.03 to 0.18 mag uncertainty to the distance estimate depending on the age of the supernova (see Figure 2). This effect was discussed by van den Bergh (1995) and Branch et al. (1996) and may be summarized by noting that a red supernova might be either intrinsically dim or extinguished by dust. The sizes of these effects on the distance are slightly different Riess, Press, & Kirshner (1996a), but their direction is the same.
Combining all of these expected sources of error leads to the predicted distance uncertainties in Figure 2. The uncertainty, for a single spectrum and epoch of and photometry, ranges between 0.17 and 0.26 mag depending on the age of the SN Ia. For noisier data expected to accompany SNe Ia at , this uncertainty will be greater (see §6). Within the first week after maximum, the distance precision is greatest because of the slow rate of change of the light-curves as well as the availability of both the Si II ratio and the Ca II ratio. Procuring data in three or four passbands and at multiple epochs will lead to modest improvements to the distance precision. Yet additional data are invaluable as a guard against systematic errors in measuring the SNe Ia apparent magnitudes and colors. These errors can result from cosmic rays hits, defective pixels, or poor background subtraction.
4 Simulated Snapshots
Although our ambition is to measure SNe Ia distances from as little as one spectrum and photometry epoch, we can test the feasibility of this endeavor on more extensively monitored objects. Our procedure is to select, at random, one epoch of photometry and one spectrum from the set of observations of SNe 1993ac, 1993ae, 1994M, 1994Q, 1994S, 1994T, 1995D, 1996C, and 1996X. These SNe Ia are in the range 2000 km s-1 15000 km s-1 and were extensively observed by Riess (1996) and Riess et al. (1998a).
We calculated the distance for random “snapshots” of these SNe Ia by the procedure described in §2, and measured the dispersion of these distances around the best-fit Hubble line. We repeated this exercise to build a distribution of dispersions. With this “Monte Carlo” exercise, we can determine the statistical and systematic components of error for snapshot distances. Because of our inability to reliably make use of (Si II) and (Ca II) earlier than six days before maximum or later than twenty days after maximum (see Appendix A), we restricted our selection to epochs within this range.
The solid line in Figure 3 shows the distribution of Hubble dispersions for simulated snapshot distances. The most frequently occurring dispersion was 0.21 mag in the distance modulus with a standard deviation of mag, implying a remarkable precision of 10% in distance. For comparison, the original treatment of the data using full light-curves produces a dispersion of 0.12 mag or 6% in distance (Riess, Press, & Kirshner 1996a). The accompanying distribution of Hubble constants peaks at km s-1 Mpc-1, consistent with the value of km s-1 Mpc-1 determined from MLCS distances for these same nine SNe Ia, implying that no additional systematic bias is apparent in the snapshot distances relative to light-curve distances. These uncertainties in the Hubble constant reflect only the small point-to-point variance of the observed Hubble flow and do not account for the much larger uncertainty in the determination of the SN Ia absolute magnitude and the connection to the Cepheid distance scale. These latter uncertainties limit the determination of the Hubble constant to 10% precision Feast & Walker (1987); Kochanek (1997); Madore & Freedman (1998). The snapshot distances do not provide an independent measurement of the Hubble constant or of the distances to these SNe Ia. Rather, our distance indicator is estimating the distances which would have been predicted by the MLCS method (RPK 1996a) if well-sampled light-curves were available.
An alternate way to explore the variance of the snapshot distances is to determine the distribution of snapshot distances for a single well-observed object. This is the same Monte Carlo exercise employed above except we do not compare the simulated snapshot distances to the distance predicted from the supernova’s redshift. Consequently, the distribution of distances for an individual SN Ia is not broadened by uncertainties in absolute photometry or by the peculiarities of a SN Ia which might cause a systematic mis-estimate of its SFA or luminosity parameter from any spectral epoch. Rather, this distribution shows the range of snapshot distances which would have been estimated from a single spectrum and photometric observation collected at different epochs. For this exercise we used SN 1996X which had the greatest number of available spectral epochs (10) and photometric epochs in four colors (12 per color), yielding over 200,000 combinations of possible snapshot data sets. For each randomly selected snapshot data set we estimated the snapshot distance to SN 1996X; the resulting distribution has a dispersion of 0.10 mag about the mean and is given by the solid symbols in Figure 4.
The light of the SN Ia host galaxy can contaminate the measured light of the SN Ia if not properly subtracted (e.g., Boisseau & Wheeler 1991). Such galaxy contamination is commonly removed from supernova photometry (e.g., Schmidt et al. 1998), but is not typically removed from SNe Ia spectra. We performed a test of the effects of host galaxy contamination on the snapshot distances by repeating the above exercise with SN 1996X using spectra contaminated by galaxy light. Specifically, we added early-type and late-type galaxy light to the spectra of SN 1996X in the amount of 33% of the SN brightness ( band). The resulting distribution of snapshot distances derived from these contaminated spectra is shown in Figure 4. In general we find a small decrease in the inferred SFA of 0.5 to 1.0 days and a mild decrease of 15% in the value of (Si II) and (Ca II). Again, due to the compensating effects described in §3, the affect on the inferred distances is substantially reduced. Late-type galaxy contamination on the SN Ia spectra at this level increased the mean distance by 0.02 mag and increased the dispersion from 0.10 to 0.11 mag. Early-type contamination decreased the mean distance by 0.01 mag and increased the dispersion from 0.10 to 0.11 mag.
In §7 we discuss the random and systematic errors of distance estimates from a single epoch of SN Ia observations which neglect the effects of extinction and intrinsic luminosity differences.
Having estimated and simulated the precision of snapshot distances, we now apply this technique to SNe Ia which were sparingly observed.
5 The Hubble Diagram of Snapshot Distances
The primary result of §3 and §4 is that snapshot distance estimates have uncertainties of 0.2 mag or 10%. A convincing demonstration of the distance precision available from single-epoch observations can be made with an independent set of SNe Ia which were observed only one or a few times. For such a set, no other means of measuring the distance to the SNe Ia is available.
We have searched for recent SNe Ia which were observed only one to a few times spectroscopically and photometrically. Our selection criteria were based on the feasibility of measuring a snapshot distance and were as follows.
-
1.
A spectroscopically confirmed SN Ia which yields a reliable SFA within twenty days after maximum light.
-
2.
At least one epoch of CCD photometry available in at least two passbands.
-
3.
Recession velocity km s-1.
Condition 1 is necessary to be able to make a useful estimate of the luminosity/light-curve parameter from the ratio of spectral features as well as to be able to determine when along the SN Ia light-curve a photometric epoch was observed. The measurement of a reliable SFA is a prerequisite for determining the luminosity/light-curve parameter from (Si II) and (Ca II) as the use of these ratios requires knowledge of the age of a SN Ia spectrum (Appendix A). A current limitation of this method is posed by two rare and unusual varieties of SNe Ia, characterized by SN 1991T and SN 1991bg Filippenko et al. (1992a, b); Phillips et al. (1992); Branch, Fisher, & Nugent (1993). The presence of atypical features as well as the absence of typical features in such spectra hinders our ability to locate such objects within our database of SNe Ia temporal evolution. Specifically, the SFA method (Riess et al. 1997a) does not provide a robust indication of the age of these atypical SNe Ia near maximum light. Until more such objects are observed, it will not be possible to measure their age reliably from their spectral evolution. With the addition of recent examples SN 1995ac, SN 1997br, SN 1997cw, and SN 1997cn Riess et al. (1998a) (see also IAUC 6642, 6699 and 6661) to the literature, we expect even this limitation to be lifted. More than a week after maximum, spectra of SN 1991T began to resemble typical SNe Ia. At such times, SN 1991T does provide reliable SFA’s; the spectra 10 and 15 days after maximum yield an SFA of 7.5 and 13.3 days after maximum, respectively Filippenko et al. (1992a); Phillips et al. (1992). Consequently, SN 1991T would pass condition 1 if spectroscopically observed more than 1 week after maximum.
Condition 2 requires that photometry from at least two passbands be available to measure the extinction from the color excess. Although snapshot distances can be estimated from complete light-curves, we sought out SNe Ia which were observed only one to a few times to emphasize the unique utility of snapshot distance estimates. An exception to this was SN 1997I, where we used the two photometry epochs with the highest signal-to-noise ratio. (If SN 1997I were observed only twice for this purpose a conscientious observer would likely have insured such high signal-to-noise ratios with generous telescope integrations.) Condition 3 is only necessary for the purpose of measuring the precision of snapshot distance estimates from deviations from the Hubble law.
Our search was neither exhaustive nor complete. Our procedure was to scan the IAU Circulars for SNe Ia which seemed likely to meet the three conditions listed above. After identifying a suitable candidate, we contacted the observer listed in the Circular to obtain the data. In Table Snapshot Distances to Type Ia Supernovae – All in “One” Night’s Work we have listed the data and its source for a set of seven sparsely observed SNe Ia. In all cases the spectra were calibrated by the listed observer. All photometry was calibrated by the authors of this paper and is presented in Appendix B.
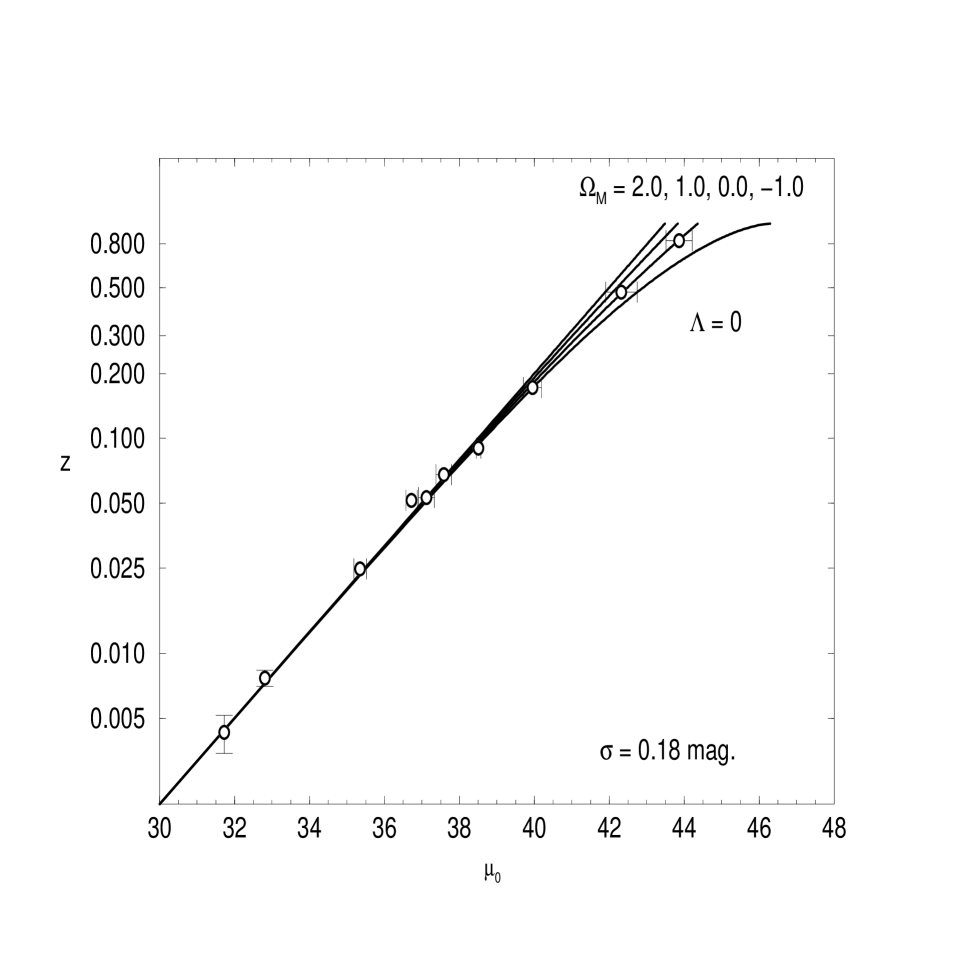
We measured the distance to the SNe Ia listed in Table Snapshot Distances to Type Ia Supernovae – All in “One” Night’s Work with the method described in §2. Typically, each SN Ia was observed one or two times photometrically and spectroscopically. The redshifts of the host galaxies and the parameters related to the SNe Ia distance estimates are given in Table 2. In all cases we assume a 300 km s-1 velocity error to account for velocity flows. The Hubble diagram constructed from this information is shown in Figure 5. Distance errors were calculated by propagating the effects of perturbing age, luminosity, and photometry measurements by their uncertainties around their expected values. The dispersion around the best fitting Hubble line is 0.18 mag, highly consistent with the error estimates in §3 and the Monte Carlo simulations in §3.
6 Snapshot Distances at High Redshift
The advantage of the snapshot method over light-curve shape methods is the dramatic reduction in required observing time for a modest reduction in distance precision. This advantage can be of great benefit at redshifts . In this searchable volume, the number of SNe Ia which can be discovered far exceeds the number whose light-curves can be monitored.
At these redshifts, SNe Ia are discovered by subtracting past galaxy images from current ones to detect new objects Perlmutter et al. (1997); Schmidt et al. (1998). Candidates are identified as SNe Ia through certain characteristics of their spectra Branch, Fisher, & Nugent (1993); Filippenko (1997). Continued monitoring of the light-curves is done at great expense of telescope time and effort, yet such additional supernova data may not be necessary.
In §3 we calculated the uncertainty of a snapshot distance for SNe Ia within to be 10%. This result was independently verified from both Monte Carlo simulations of well-sampled SNe Ia and from the Hubble diagram of sparsely sampled SNe Ia. We can repeat this calculation for high-redshift SNe Ia, including a larger uncertainty in age estimates and photometry of more distant supernovae. Riess et al. (1997a) estimate a mean age uncertainty of 2.0 to 2.5 days from spectra obtained at the Keck-II telescope of SN 1996bj, a SN Ia at . Images of SN 1996bj obtained near maximum at the Blanco 4 m telescope at the Cerro Tololo Inter-American Observatory recorded the brightness of the supernova with a precision of 5% Schmidt (1997). Incorporating these uncertainties into equation (3) results in an expected snapshot distance uncertainty of 15-20% or 0.3-0.4 mag (see Figure 1).
As a test of the feasibility of measuring a snapshot distance for SNe Ia with we measured the distance to SN 1995K, a SN Ia at Schmidt et al. (1998) and SN 1997ap at Perlmutter et al. (1998).
An identification spectrum of SN 1995K was obtained at the New Technology Telescope at ESO by B. Leibundgut and J. Spyromilio on 3 April 1995. Complete light-curves in and were obtained by Schmidt et al. (1998). We have used the identification spectrum and the two photometry epochs with greatest signal-to-noise ratio (JD 2449807, 2449813) to measure a snapshot distance to SN 1995K. If SN 1995K had been sparsely observed for the purpose of measuring its snapshot distance, the paucity of observations would have merited long telescope integrations to reach a signal-to-noise ratio at least as high as that for the observations of JD 2449807 and 244981. The spectral feature age of SN 1995K on April 3 was 1 days after maximum light. This age is in good agreement with the complete light-curves for SN 1995K Schmidt et al. (1998). The value of (Si II) was found to be 0.30, indicating that SN 1995K was of typical luminosity for most SNe Ia (see Appendix A). The measured colors are not redder than those expected for the estimated age and luminosity, indicating no significant extinction of the supernova light. The estimated distance modulus of SN 1995K is mag (see Figure 5). This snapshot distance estimate is highly consistent with the more precise MLCS estimate of . Yet, the investment of time to gather the data for the snapshot estimate was less than 10% of that needed for the MLCS estimate.
SN 1997ap was discovered by the Supernova Cosmology Project on 5 March 1997 UT, during a two-night supernova search at the CTIO 4-m telescope. The supernova light-curve was followed with scheduled -band and -band imaging at the CTIO, WIYN, ESO 3.6 m, and INT telescopes, and with spectroscopy at the Keck-II telescope. In addition, SN 1997ap was followed with scheduled imaging with the Hubble Space Telescope. The spectrum and full light-curves can be seen in Perlmutter et al. (1998). Once again, we have used the identification spectrum and the two photometry epochs with greatest signal-to-noise ratio (JD 2450547, 2450555) to measure a snapshot distance. The SFA method Riess et al. (1997a) was developed to measure the age from features in the SN Ia spectrum in the rest wavelength range of 3800 to 6800 Å. The substantial redshift of SN 1997ap carries many of these features out of the optical window, yet brings equally useful features from the ultraviolet into our window. To make better use of the available data, Perlmutter et al. (1998) have extended the SFA method to use the UV features at the rest wavelength range of 2750 to 3800 Å. Spectra from the International Ultraviolet Explorer Cappellaro, Turatto, & Fernley (1995) in combination with ground-based spectra were used to perform these calculations. The March 14 spectrum yields an age of SN-restframe days (4 observer’s days) before the supernova’s maximum light in the restframe -band which is consistent with a supernova age of SN-restframe days after maximum inferred for this date from the fit to the light curve. The value of (Ca II) was found to be 1.32, which indicates that the supernova was slightly overluminous ( mag). Both the age and the measurement of the light-curve shape from the spectrum are in excellent agreement with the results from the full light-curve analysis as seen in Perlmutter et al. (1998). The colors at maximum are slightly bluer ( mag) than the expected color at maximum of mag for supernovae with similar light-curve shapes, indicating that SN 1997ap suffers no extinction [though the uncertainty on both measurements is large Perlmutter et al. (1998)]. The snapshot distance modulus of SN 1997ap is mag, in exact agreement with the full light-curve analysis (where the error bars are only mag), yet just a small fraction of the available data were incorporated.
For the snapshot distances in Table 2, we find for a flat universe () that km s-1 Mpc-1 and with a reduced . For a universe, km s-1 Mpc-1 and with a reduced . The former uncertanties in the Hubble constant reflect the variance in the Hubble flow; the latter uncertainties result from the uncertainty in the SN Ia absolute magnitude and the Cepheid distance scale (Feast & Walker 1987; Kochanek 1997; Madore & Freedman 1987). Our results for this very preliminary study at high redshift are similar to those of Perlmutter et al. (1998), Garnavich et al. (1998) and Riess et al. 1998b which employ full light-curves; however, we do note a mild disagreement with the earlier results of Perlmutter et al. (1997) at the 80% level. While it is too early to place strong constraints on the cosmological parameters from this exploratory study, the results from a small data set of sparsely observed supernovae are encouraging.
7 Discussion
In principle, enough information can be garnered from a single supernova spectrum and photometric epoch to estimate the distance to a SN Ia. In practice, the results of §3, 4, and 5 suggest this method produces distances having a precision of 10%, with variations that are a function of the quality of the data and the age of the supernova. Depending on the amount of host galaxy contamination, it may be necessary to obtain spectra and images of the host galaxy after the supernova has faded.
The snapshot distance method employs the same luminosity and extinction corrections used in the MLCS method of Riess, Press, and Kirshner 1996a (and more recently updated in Riess et al. 1998b). We find no significant offset between the distance estimates of the two methods and only a modest reduction in precision for the snapshot distance method. There are three more limited versions of a distance method using single epoch SN Ia observations which reveal the utility of luminosity and extinction corrections (see Table 3 and Figure 3). These variants employ the SFA measurement but lack the luminosity correction, the extinction correction, or both.
Disregarding individual luminosities and light-curve shapes predicted by the spectral ratios, we fit homogeneous, fiducial templates to the photometric epoch. Further, we discarded our estimate of the extinction from the color excess. We measured the resulting “standard candle” distances to SNe Ia using the Monte Carlo technique described in §4. As seen in Figure 3, the distribution of dispersions has a mean of 0.35 mag, a value consistent with previous SNe Ia distance estimates which assume SN Ia light curve homogeneity and do not correct for extinction Sandage & Tammann (1993, 1995); Hamuy et al. (1995, 1996); Riess, Press, & Kirshner (1995, 1996a); Branch & Miller (1993); Vaughan et al. (1995). These distances are also 15% greater in the mean (or smaller in the implied Hubble constant) than either MLCS or snapshot distances, consistent with other comparisons of distance estimates which assume homogeneity instead of heterogeneity of SNe Ia Sandage & Tammann (1995); Hamuy et al. (1995, 1996); Riess, Press, & Kirshner (1995, 1996a).
To simulate the effect of single filter information, we used our luminosity correction without an extinction correction. This procedure results in a mean dispersion of 0.25 mag and distances which are only 3% greater than those obtained from MLCS. This result, though better than the standard candle method, is still worse than the complete snapshot procedure.
A final variant is to disregard a luminosity/light-curve shape correction but maintain an extinction correction from the color excess. Such a method using light-curves was proposed by van den Bergh (1995) to account for both intrinsic luminosity differences as well as absorption by dust. This method takes advantage of the coincidental near-agreement between the standard reddening law and the relation between intrinsic color and luminosity to correct for both extinction and luminosity differences. Riess, Press, & Kirshner (1996a) have noted that while both sources of luminosity variation affect the SN color in the same direction, the specific ratios of the luminosity difference to color difference are not precisely the same for extinction and intrinsic SN Ia variation. Monte Carlo simulations of this method combined with a SFA measurement give a mean dispersion of 0.19 mag and distances which are 5% greater in the mean than those of the MLCS method. Despite the low dispersion of this method, we are suspicious of the distances it predicts. The distribution of dispersions obtained from our Monte Carlo simulation (see Figure 3 and Table 3) is more skewed than any other, including an asymmetric “tail” encompassing dispersions greater than 0.3 mag. We believe that for SNe Ia with only moderate amounts of extinction or whose luminosities are similar to those of typical SNe Ia, this method has merit. Yet for very red SNe Ia, this method can predict distances which are systematically and considerably in error due to the inability to distinguish between absorption by dust and intrinsic variation.
The snapshot method predicts distances which agree in the mean with only a moderate reduction in precision from light-curve shape methods. Yet because of the greatly diminished expense in data collection, this method can be more effective for problems which benefit equally well from a high quantity of SNe Ia distances as from the quality of those distances. Two such applications are mapping the nearby peculiar velocity field and determining the cosmological parameters which dictate global geometry.
Recent attempts to map the cosmic velocity field with SNe Ia Riess et al. (1997b) suffer from dilute spatial sampling. Replete peculiar velocity maps could reveal the influence of matter fluctuations and constrain the matter content of the local Universe. Nearby, many more SNe Ia are discovered than can be regularly monitored. By decreasing the observational requirements of each SN Ia, it should be possible to increase the sampling of the local velocity field. The light-curves employed by Hamuy et al. (1996) and Riess, Press, & Kirshner (1996a) are typically sampled for 10 to 15 epochs. The observational demands increase as the supernova rapidly fades. With the telescope time invested in a single set of SN Ia multi-color light-curves, sufficient data for 15 to 25 SNe Ia snapshot distances could be gathered. Accounting for the inherent distance uncertainties, telescope time spent collecting snapshot distance data is 3 to 4 times more efficient than time spent collecting light-curves for distance estimates.
Efforts to measure the cosmological parameters and from distant SNe Ia could also profit from snapshot distances. Systematic searches for SNe Ia at z have yielded a plethora of objects Perlmutter et al. (1995); Schmidt et al. (1995). Combining a new generation of large telescopes with 1 degree fields of view and multi-fiber spectrometers with the snapshot method could allow SNe Ia distances to be gathered in batch at an unprecedented rate. At the current rate of discovery, a night spent searching five 1-degree fields followed by a night collecting spectra of the candidates with a multi-fiber spectrometer could yield 50 SNe Ia distances Schmidt (1997); Pain et al. (1996). Repeating this process every new moon could yield up to 600 distances a year. At this rate of accumulation, it should be possible to convincingly separate the effects of various sources of energy density on the redshift-magnitude relation Goobar & Perlmutter (1995).
A more optimal method for measuring SN Ia distances would employ both the predictive power of SN Ia light and color curve shapes with that of SN Ia spectra. Such a method would replace the distinction between a snapshot distance and a light-curve distance with a distance estimate which makes the most economical use of all available SN Ia observations. Using the tools described in Riess, Press, and Kirshner 1996a, Nugent et al. 1995, Riess et al. 1997, Riess et al. 1998b, and this paper, such a method appears to be quite feasible.
This work was supported by the NSF through grant AST–9417213 to A.V.F. and AST-9528899 and AST-9617058 to R.P.K., by the Miller Institute for Basic Research in Science through a fellowship to A.G.R., and by the Director, Office of Computational and Technology Research, Division of Mathematical, Information, and Computational Sciences of the U.S. DoE under contract number 76SF00098 to P.E.N. Some of the calculations presented in this paper were performed at the National Energy Research Supercomputer Center (NERSC), supported by the U.S. DoE. We thank Stephan Benetti and George Djorgovski for allowing us to use their spectra of SNe Ia prior to publication, and Bruno Leibundgut for suggestions that helped improve this paper.
Appendix A The Correlation of with (Si II) and (Ca II)
Following the prescription by Nugent et al. (1995) for measuring (Si II) and (Ca II) at maximum light, we present the linear relationships found between these ratios and the MLCS parameter (Riess, Press, & Kirshner 1996a) for a time sequence of supernovae. The data were binned into three-day intervals to allow for possible errors in the light-curve estimate of maximum light ( 1.4 days) and to increase the number of data points in each bin. A complete description of this work is presented in Phillips et al. (1998). In Table 5 and Table 4 we list the slope () and intercept (), along with the dispersion (), for the linear relationship assumed between [(Si II), (Ca II)] and as defined by
| (A1) |
The ratio (Si II) was utilized from 7 days before to 7 days after maximum light and (Ca II) was utilized from 7 days before to 19 days after maximum light. The number of spectra available earlier than 7 days before maximum light limits our ability to define the relationships between these ratios and the luminosity. The technique presented by Nugent et al. (1995) for measuring (Si II) cannot be employed for SNe Ia older than 7 days after maximum light because the Si II trough at 5800 Å loses its short wavelength boundary. Likewise the data becomes too sparse more than 19 days after maximum light, inhibiting our ability to predict the relationship between (Ca II) and the luminosity. The scatter in the relationship between (Si II) and is 0.25 mag while for (Ca II) a range of 0.17 0.40 mag exists. The Si II relationship is nearly always an excellent estimator of intrinsic luminosity while the Ca II relationship works best during more limited epochs. Additional methods for using the Ca II feature to measure intrinsic luminosity are presented in Phillips et al. (1998), with an emphasis placed on how to improve the utility of Ca II.
Appendix B Photometry for the SNe
After determining the expected precision of snapshot SNe Ia distances to be 10%, we sought to verify this result on a set of sparsely observed SNe Ia. The selection criteria for such objects are given in §5. In Table 6 we list the available photometry. The photometry was calibrated by the authors of this paper. The methods used for measuring the brightness of the SN Ia and its uncertainty are those of Riess (1996). Galaxy subtraction was performed on all the objects followed by point-spread-function (PSF) fitting. The exceptions were SN 1997bp and SN1996V, whose brightnesses could be computed directly from a PSF without significant contamination by background light.
References
- Benetti (1997) Benetti, S. 1997, private communication.
- (2) Boisseau, J. R., & Wheeler, J. C. 1991 AJ, 101, 1281
- Branch et al. (1983) Branch, D., et al. 1983, ApJ, 270, 123
- Branch & Miller (1993) Branch, D., & Miller, D. L. 1993, ApJ, 405, L5
- Branch, Fisher, & Nugent (1993) Branch, D., Fisher, A., & Nugent, P. 1993, AJ, 106, 2383
- Branch et al. (1996) Branch, D., Fisher, A., Baron, E., & Nugent, P. 1996, ApJ, 470, L7
- Cappellaro, Turatto, & Fernley (1995) Cappellaro, E., Turatto, M., & Fernley, J. 1995, IUE - ULDA Access Guide No. 6: Supernovae, ESA, The Netherlands
- Djorgovski (1997) Djorgovski, G. 1997, private communication.
- Feast & Walker (1987) Feast, M. W., & Walker, A. R. 1987, ARA&A, 25, 345
- Filippenko (1997) Filippenko, A. V. 1997, ARA&A, 35, 309
- Filippenko et al. (1992a) Filippenko, A. V., et al. 1992a, ApJ, 384, L15
- Filippenko et al. (1992b) Filippenko, A. V., et al. 1992b, AJ, 104, 1543
- Garnavich et al. (1998) Garnavich, P., et al. 1998, ApJ, 493, 53
- Goobar & Perlmutter (1995) Goobar, A., & Perlmutter, S. 1995, ApJ, 450, 14
- Hamuy et al. (1993) Hamuy, M., Phillips, M. M., Wells, L., & Maza, J. 1993, AJ, 105, 689
- Hamuy et al. (1995) Hamuy, M., Phillips, M. M., Maza, J., Suntzeff, N. B., Schommer, R. A., & Aviles, R. 1995, AJ, 109, 1
- Hamuy et al. (1996) Hamuy, M., Phillips, M. M., Maza, J., Suntzeff, N. B., Schommer, R. A., & Aviles, R. 1996, AJ, 112, 2391
- Kim et al. (1998) Kim, A., et al. 1998, ApJ, in preparation
- Kim, Goobar, & Perlmutter (1996) Kim, A., Goobar, A., & Perlmutter, S. 1996, PASP, 108, 190
- Kochanek (1997) Kochanek, C. S. 1997, ApJ, 491, 13
- Leibundgut (1988) Leibundgut, B. 1988, Ph.D. thesis, University of Basel
- Madore & Freedman (1998) Madore, B. F., & Freedman, W. L. 1998, apj, 492, 110
- Minkowski (1939) Minkowski, R. 1939, ApJ, 89, 156
- Nugent (1997) Nugent, P. 1997, Ph.D. thesis, University of Oklahoma
- Nugent et al. (1995) Nugent, P., Phillips, M., Baron, E., Branch, D., & Hauschildt, P. 1995, ApJ, 455, L147
- Pain et al. (1996) Pain, R., et al. 1996, ApJ, 473, 356
- Perlmutter et al. (1997) Perlmutter, S., et al. 1997, ApJ, 483, 565
- Perlmutter et al. (1998) Perlmutter, S., et al. 1998, Nature, 391, 51
- Phillips et al. (1998) Phillips, M., et al. 1998, in preparation
- Phillips (1993) Phillips, M. M. 1993, ApJ, 413, L105
- Phillips et al. (1992) Phillips, M. M., et al. 1992, AJ, 103, 1632
- Perlmutter et al. (1995) Perlmutter et al. 1995, IAU Circ. No. 6270
- Riess (1996) Riess, A. G. 1996, Ph.D. thesis, Harvard University.
- Riess et al. (1997a) Riess, A. G., et al. 1997a, AJ, 114, 722
- Riess et al. (1998a) Riess, A. G., et al. 1998a, in preparation
- Riess et al. (1998b) Riess, A. G., et al. 1998b, submitted
- Riess et al. (1997b) Riess, A. G., Davis, M., Baker, J., & Kirshner, R. P. 1997b, ApJ, 488, L1
- Riess, Press, & Kirshner (1995) Riess, A. G., Press, W. H., & Kirshner, R. P. 1995, ApJ, 438, L17
- Riess, Press, & Kirshner (1996a) Riess, A. G., Press, W. H., & Kirshner, R. P. 1996a, ApJ, 473, 88.
- Riess, Press, & Kirshner (1996b) Riess, A. G., Press, W. H., & Kirshner, R. P. 1996b, ApJ, 473, 588
- Sandage & Tammann (1995) Sandage, A., & Tammann, G. 1995, ApJ, 452, 16
- Sandage & Tammann (1993) Sandage, A., & Tammann, G. A. 1993, ApJ, 415, 1
- Savage & Mathis (1979) Savage, B., & Mathis, J. 1979, ARA&A, 17, 73.
- Schmidt (1997) Schmidt, B. P. 1997, private communication
- Schmidt et al. (1995) Schmidt, B. P., et al. 1995, IAU Circ. No. 6160
- Schmidt et al. (1998) Schmidt, B. P., et al. 1998, ApJ, submitted
- van den Bergh (1995) van den Bergh, S. 1995, ApJ, 453, L55
- Vaughan et al. (1995) Vaughan, T. E., Branch, D., Miller, D. L., & Perlmutter, S. 1995, ApJ, 439, 558


| Spectra | Photometry | |||
|---|---|---|---|---|
| SN Ia | Epochs | SN Ia age | Epochs | SN Ia age |
| SN 1994U | 2 | -7.5a, 8.5b | 1 | 2.7a |
| SN 1997bp | 3 | -0.5a, 0.5a, 1.5a | 1 | 3.5a |
| SN 1996V | 1 | 11.7a | 1 | 11.7a |
| SN 1994C | 2 | 9.5a, 10.5c | 1 | 14.8a |
| SN 1995M | 1 | 9.5d | 4 | 10.5a, 14.5a, 15.5a, 25.5a |
| SN 1995ae | 1 | 8.6b | 2 | 10.7a, 11.7a |
| SN 1994B | 2 | -3.6a, 13.4a | 2 | -1.3a, -0.3a |
| SN 1997I∗ | 1 | 0.1a | 2 | 1.0a, 3.0a |
| SN 1995K∗ | 1 | 2.1d | 2 | 4.2d, 8.2d |
| SN 1997ap∗ | 1 | -2.0e | 3 | -2.6e, 11.0e, 15.2e |
| . | ||||
Note. — ∗ These supernovae were treated as “snapshot” supernovae by picking the two highest signal-to-noise ratio photometric epochs from their full light-curves.
| SN Ia | log | JD max | ||||
|---|---|---|---|---|---|---|
| (km/s) | (2400000+) | (mag) | (mag) | (mag) | (mag) | |
| SN 1994U | 3.111 | 9539.0 | 0.03 | 0.70 | 31.72 | 0.10 |
| SN 1997bp | 3.363 | 10546.3 | -0.26 | 0.62 | 32.81 | 0.10 |
| SN 1996V | 3.870 | 10173.0 | 0.26 | 0.00 | 35.35 | 0.17 |
| SN 1994C | 4.189 | 9411.0 | 0.81 | 0.00 | 36.72 | 0.15 |
| SN 1995M | 4.202 | 9822.1 | -0.15 | 0.46 | 37.12 | 0.21 |
| SN 1995ae | 4.308 | 9983.0 | 0.38 | 0.00 | 37.58 | 0.21 |
| SN 1994B | 4.431 | 9375.1 | -0.02 | 0.38 | 38.51 | 0.10 |
| SN 1997I∗ | 4.713 | 10461.4 | -0.39 | 0.00 | 39.95 | 0.24 |
| SN 1995K∗ | 5.157 | 9808.4 | 0.15 | 0.00 | 42.32 | 0.42 |
| SN 1997ap∗ | 5.396 | 10526.7 | 0.00 | 0.00 | 43.67 | 0.35 |
Note. — ∗ These supernovae were simulated as “snapshot” supernovae by picking the two highest signal-to-noise ratio photometric epochs from their full light-curves.
| Correction Method | Luminosity | Skewness∗ | H0/H | ||
|---|---|---|---|---|---|
| (mag) | (mag) | ||||
| Standard Candle | none | none | 0.35 | 0.22 | 0.86 |
| One Color | Si II) and (Ca II) | none | 0.25 | 0.24 | 0.96 |
| “Van den Bergh” | none | colors | 0.19 | 0.65 | 0.95 |
| Snapshot | (Si II) and (Ca II) | colors | 0.21 | 0.20 | 0.99 |
Note. — ∗ Skewness is defined to be
. Phase (days) (mag) (mag) (mag) -7 1.73 -0.32 0.24 -6 1.58 -0.34 0.18 -5 1.54 -0.33 0.17 -4 1.85 -0.40 0.20 -3 1.89 -0.42 0.19 -2 2.30 -0.58 0.22 -1 2.34 -0.58 0.21 0 2.33 -0.55 0.22 1 2.20 -0.51 0.21 2 2.34 -0.54 0.21 3 2.07 -0.45 0.19 4 2.06 -0.46 0.20 5 1.90 -0.47 0.22 6 1.13 -0.28 0.23 7 0.67 -0.15 0.25
Note. — a The equation (Si II) was used to derive the relationship between and (Si II).
. Phase (days) (mag) (mag) (mag) -7 0.31 -0.37 0.36 -6 0.33 -0.39 0.28 -5 0.33 -0.43 0.29 -4 0.21 -0.23 0.27 -3 0.20 -0.21 0.23 -2 0.82 -1.14 0.30 -1 0.87 -1.23 0.32 0 0.65 -0.79 0.37 1 0.69 -0.79 0.37 2 0.72 -0.84 0.36 3 0.44 -0.45 0.30 4 0.46 -0.47 0.30 5 0.54 -0.66 0.28 6 0.35 -0.47 0.19 7 0.40 -0.55 0.21 8 0.48 -0.71 0.23 9 0.44 -0.70 0.17 10 1.08 -1.52 0.32 11 1.42 -1.98 0.26 12 1.23 -1.74 0.35 13 1.34 -1.93 0.39 14 1.12 -1.62 0.40 15 0.94 -1.39 0.31 16 0.92 -1.35 0.31 17 1.03 -1.53 0.25 18 0.96 -1.37 0.22 19 0.59 -0.81 0.24
Note. — a The equation (Ca II) was used to derive the relationship between and (Ca II).
| SN Ia | JD | ||||
|---|---|---|---|---|---|
| (2400000+) | (mag) | (mag) | (mag) | (mag) | |
| SN 1994U | 9541.7 | 13.46(0.03) | 13.07(0.02) | 12.86(0.02) | 13.22(0.04) |
| SN 1997bp | 10549.8 | 14.03(0.03) | 13.79(0.03) | 13.80(0.03) | 14.08(0.04) |
| SN 1996V | 10184.7 | 16.97(0.03) | 16.62(0.03) | 16.69(0.03) | 17.08(0.04) |
| SN 1994C | 9425.8 | 19.95(0.06) | 18.94(0.05) | 18.51(0.02) | 18.15(0.08) |
| SN 1995M | 9832.6 | 18.68(0.04) | 18.28(0.02) | — | — |
| 9833.6 | — | 18.33(0.02) | — | — | |
| 9836.7 | 19.15(0.04) | 18.50 (0.02) | — | — | |
| 9837.6 | 19.20(0.04) | 18.54 (0.02) | — | — | |
| 9843.7 | — | 18.90(0.02) | — | — | |
| 9847.6 | 20.28(0.04) | — | — | — | |
| SN 1995ae | 9993.7 | 19.28(0.05) | 18.92(0.03) | 18.78(0.04) | 19.11(0.06) |
| 9994.7 | 19.34(0.07) | 18.95(0.03) | 18.74(0.04) | 19.48(0.15) | |
| SN 1994B | 9373.8 | 19.62(0.05) | 19.43(0.03) | 19.08(0.04) | 19.68(0.06) |
| 9374.8 | 19.67(0.04) | 19.50(0.04) | 19.01(0.04) | 19.57(0.07) | |
| SN 1997I | 10462.6 | — | 20.55(0.03) | — | — |
| 10464.8 | — | 20.53(0.03) | 20.70(0.03) | — | |
| 10480.7 | — | — | 21.31(0.03) | — |