CO in blue compact and star burst galaxies
Abstract
12CO(J=10) observations of 34 blue compact and star burst galaxies are presented. Although these galaxies are experiencing vigorous star formation at the current epoch, CO has been detected in only five of them. The five detections reported in this paper are all in galaxies with relatively red colours, (B-V)0.4.
The new observations, when combined with previously published data on CO in BCGs, indicate that CO luminosity decreases with absolute luminosity of BCGs. Since the absolute luminosity of a galaxy is correlated with its metallicity, these results confirm that low metallicity BCGs have low abundances of CO gas. We also show that the star formation rate determined from the Hβ luminosity is lower than that determined from the far infrared luminosity.
Key Words.:
galaxies: ISM – radio lines:ISM1 Introduction
Blue Compact Galaxies (BCGs) are the smallest star-forming extragalactic objects and they are experiencing massive bursts of star formation at the current epoch. The dwarf BCGs lack the elaborate gas dynamics and spiral arms which trigger star formation in giant galaxies and the mechanism for star formation in these galaxies is still unidentified. An acceptable description of their nature and their evolution has also not yet emerged. The metal and dust deficiency of BCGs suggests that they are either young galaxies which have recently formed out of protogalactic gas clouds or that they experience intermittent bursts of star formation followed by periods of quiescence (Searle, Sargent & Bagnuolo 1972, Huchra 1977, Thuan et al. 1983, Gondhalekar et al. 1983,1986)
Observations of CO in nearby galaxies (Talbot 1980, Scoville & Young 1983) suggest that the formation of stars depends primarily on the availability of molecular gas. Thus observations of molecular gas in BCGs are essential to both the understanding of star-formation within them as well as their overall evolution. CO observations of BCGs have been reported by Young et al. (1986), Israel & Burton (1986), Tacconi & Young (1987), Arnault et al. (1988), Sage et al. (1992) and Israel, Tacconi & Baas (1995). Various criteria were used to select the samples of galaxies observed in these studies. The consensus seems to be that metal-poor galaxies are deficient in CO. The current programme was initiated to explore the validity of this conclusion. A sample of galaxies, covering a large range in absolute magnitude and 60m luminosity, has been observed in order to determine the CO content in the galaxies experiencing different levels of star bursts and spanning a range of metallicities. We should like to emphasise that we are unable to determine the molecular content of these galaxies from the CO observations as the CO-to-H2 conversion factor is not known for the galaxies in this sample as the metallicity of these galaxies is not known and the conversion factor is a function of metallicity of a galaxy.
The sample of galaxies, the CO observations and the data reduction are described in section 2. In section 3 we investigate the relation between star-formation and CO in these galaxies . The conclusions are given in section 4.
2 Sample, observations and data reduction
For this study a sample of galaxies covering a large range in luminosity and therefore, metallicity, was selected from the list of Salzer, MacAlpine and Boroson (1989). We have selected 13 galaxies classified as dwarf HII hotspot galaxies, DHIIH, by these authors. To this we have added a sample of nine star burst nuclei, SBN, (Salzer, MacAlpine and Boroson, 1989). The galaxies in both samples have Hβ luminosity greater than erg s-1 (H0=75 km s-1 Mpc-1 and q0=0.5 have been used through out this paper) and all are experiencing vigorous star bursts at the current epoch. Additional star burst galaxies, mainly from MacAlpine, Smith & Lewis (1977a,b) and MacAlpine & Lewis (1978) were added to this list. The full list of galaxies observed is given in Table 1. In total, 34 galaxies were observed. The sample covers about 6m in absolute luminosity. This is not a complete sample, it is, however, a large sample and the number of BCGs is large enough to be representative as a class.
The observations of the 12CO(J=10) (115.271
GHz) line were performed
at the Onsala Space Observatory (OSO) 20m mm-wave telescope,
the half-power beamwidth of which is 35 at this
frequency. The observations
were made during three runs between February 1995 and March 1997.
A SIS mixer was used, tuned to the single side-band mode. Typical system
temperatures, corrected for rearward
spillover and atmospheric
attenuation, were between 500 K and 1500 K depending on weather
conditions and galaxy redshifts. The back-end was a multichannel
receiver with a resolution of 1 MHz and a total bandwidth of 512 MHz
(corresponding to a velocity coverage of about 1300 km s-1 at 115 GHz)
Antenna pointing was about 3 rms on each axis and the main-beam
efficiency was =0.5 during all three observing runs. The observed
intensities, T, were “chopper-wheel” calibrated and are related
to the main-beam brightness temperature Tmb by
T= Tmb.

The detections and the upper limits of CO for all galaxies are given in Table 1, where the rms error (Col.7) is calculated for a resolution of 20 km s-1. This resolution seems to give the best signal-to-noise for the detected line widths. The intensity scale is the main beam brightness temperature Tmb. The integrated CO intensity is given in Col. (11). The 1 error in the integrated line intensity, where the line has been detected, is given in Col. (12) and was calculated using Eq.(1) of Elfhag et al. (1996). These errors depend on the inherent rms noise in the profile and the uncertainties in baseline corrections. However, for most of the detected lines the baseline range is small and only the rms noise defines the error. This is, however, not true in cases where only upper limits can be determined, because in such cases the full spectrum defines the baseline range and the curvature of the baseline is included in computing the upper limits.
Of the 34 galaxies observed, CO was detected in five and there may be possible detection in three other cases. These eight spectra are shown in Fig. 1. In the following discussion the possible detections are regarded as upper limits.
Some galaxies in this sample (see Table 1) are AGNs. Only upper limits have been obtained for CO in these galaxies. These limits have been included in the following analysis but they do not affect our conclusions.
| ID | RA(1950) | Dec(1950) | (B-V)cor | Tmb | cz | FWHW | ICO | ||||||||
| mK | mK | km s-1 | km s-1 | K km s-1 | |||||||||||
| 1 | 2 | 3 | 4 | 5 | 6 | 7 | 8 | 9 | 10 | 11 | 12 | ||||
| UM274 | Sb | 0 | 43 | 32 | 1 | 59 | 41 | 76 | 12. | 4065 | 65 | 5.4 | 0.7 | ||
| UM286 | 0 | 49 | 26 | 0 | 45 | 31 | 0.53 | 13. | 0.8 | ||||||
| UM307 | SBd | SBN | 1 | 08 | 56 | 1 | 03 | 24 | 0.41 | 4.8 | 0.3 | ||||
| UM323 | DHIIH | 1 | 24 | 12 | 0 | 54 | 15 | 0.40 | 11. | 0.6 | |||||
| UM334 | DHIIH | 1 | 30 | 05 | 1 | 54 | 15 | 0.33 | 6.2 | 0.4 | |||||
| UM343 | SBb | SBN | 1 | 33 | 25 | 0 | 24 | 29 | 0.78 | 8.6 | 0.5 | ||||
| UM351 | DHIIH | 1 | 35 | 48 | 1 | 38 | 48 | 0.56 | 4.9 | 0.3 | |||||
| UM363 | SO-a | Sy 2 | 1 | 41 | 22 | 2 | 05 | 56 | 1.03 | 13 | 4.3 | 5070 | 125 | 1.7∗ | 0.3 |
| UM374 | DHIIH | 1 | 50 | 20 | 1 | 08 | 52 | 0.60 | 8.1 | 0.5 | |||||
| UM385 | Sy 1 | 1 | 57 | 16 | 0 | 09 | 09 | 6.8 | 0.3 | ||||||
| UM388 | SBN | 1 | 58 | 18 | 1 | 46 | 50 | 0.72 | 4.6 | 0.3 | |||||
| UM393 | SO | Sy 1 | 2 | 03 | 43 | 0 | 31 | 46 | 5.7 | 0.3 | |||||
| UM413 | SBN | 2 | 12 | 21 | 2 | 00 | 47 | 0.75 | 3.4 | 0.2 | |||||
| UM418 | SBb | SBN | 2 | 17 | 07 | 0 | 29 | 09 | 6.8 | 0.4 | |||||
| IIZw40 | Sbc | 5 | 53 | 05 | 3 | 23 | 05 | 0.82 | 23 | 6.6 | 645 | 45 | 1.1∗ | 0.5 | |
| IZw18 | 9 | 30 | 30 | 55 | 27 | 49 | 0.10 | 4.8 | 0.3 | ||||||
| UM439 | DHIIH | 11 | 34 | 02 | 1 | 05 | 38 | 0.28 | 8.3 | 0.5 | |||||
| UM444 | DHIIH | 11 | 37 | 38 | 0 | 08 | 03 | 0.65 | 4.9 | 0.3 | |||||
| UM452 | SO | DHIIH | 11 | 44 | 26 | 0 | 00 | 57 | 0.64 | 13. | 0.7 | ||||
| UM454 | DHIIH | 11 | 45 | 43 | 1 | 21 | 43 | 0.43 | 13. | 0.8 | |||||
| UM456 | DHIIH | 11 | 48 | 01 | 0 | 17 | 23 | 0.35 | 11. | 0.7 | |||||
| UM462 | DHIIH | 11 | 50 | 03 | 2 | 11 | 26 | 0.24 | 7.4 | 0.5 | |||||
| UM471 | DHIIH | 11 | 58 | 56 | 1 | 09 | 28 | 0.22 | 10. | 0.5 | |||||
| UM477 | SBc | SBN | 12 | 05 | 36 | 3 | 09 | 21 | 0.62 | 50 | 8.6 | 1340 | 85 | 4.5 | 0.6 |
| UM483 | DHIIH | 12 | 09 | 41 | 0 | 21 | 00 | 0.02 | 14. | 0.8 | |||||
| UM491 | DHIIH | 12 | 17 | 18 | 2 | 03 | 02 | 0.42 | 14. | 0.8 | |||||
| UM499 | SO-a | SBN | 12 | 23 | 09 | 0 | 50 | 57 | 0.64 | 110 | 10. | 2145 | 55 | 6.2 | 0.5 |
| Mark213 | SBa | 12 | 29 | 01 | 58 | 14 | 20 | 0.48 | 15 | 4.6 | 3160 | 360 | 5.4 | 0.5 | |
| Mark54 | Sc | 12 | 54 | 32 | 32 | 43 | 07 | 0.27 | 4 | 1.8 | 13500 | 430 | 1.5 | 0.2 | |
| UM530 | SBN | 12 | 55 | 35 | 2 | 07 | 54 | 0.51 | 5.8 | 0.3 | |||||
| UM549 | DHIIH | 13 | 11 | 58 | 2 | 49 | 44 | 0.39 | 5.2 | 0.3 | |||||
| UM641 | Sc | SBN | 14 | 07 | 21 | 1 | 00 | 15 | 0.43 | 5.0 | 0.3 | ||||
| UM156 | Sb | Sy 1 | 23 | 16 | 23 | 0 | 01 | 50 | 15 | 6.0 | 9080 | 65 | 1.0∗ | 0.4 | |
| UM191 | Im | 23 | 54 | 26 | 2 | 21 | 44 | 13 | 5.7 | 7675 | 150 | 2.0∗ | 0.4 | ||
| Column 2: | Galaxy type; LEDA catalogue (Paturel et al. 1997) | ||||||||||||||
| Column 3: | Galaxy type; Salzer et al. (1989) | ||||||||||||||
| (B-V)cor | From Salzer et al. (1989), where available, and from the LEDA catalogue otherwise | ||||||||||||||
| Column 11: | An asterix denotes a possible detection only | ||||||||||||||
| ID | mB | MB | z | log(L) | log(LFIR) | CFIR | log(LCO) | log(MHI) | D25 |
| erg s-1 | L☉ | K km s-1 pc2 | M☉ | ||||||
| 1 | 2 | 3 | 4 | 5 | 6 | 7 | 8 | 9 | 10 |
| Mark54 | 15.29 | 21.81 | 0.0447 | 10.69 | 0.289 | 9.70 | 40 | ||
| UM274 | 12.81 | 21.22 | 0.1412 | 41.29 | 12.30 | 0.363 | 9.16 | 11.61 | 75 |
| UM477 | 11.58 | 19.85 | 0.0042 | 42.06 | 9.46 | 0.263 | 8.10 | 9.90 | 256 |
| UM499 | 13.16 | 19.40 | 0.0067 | 41.74 | 9.71 | 0.119 | 8.65 | 8.92 | 128 |
| Mark213 | 13.10 | 20.96 | 0.0104 | 39.86 | 10.05 | 0.242 | 8.95 | 9.31 | 97 |
| TNGC1569 | 10.68 | 20.15 | 0.0005 | 8.51 | 0.039 | 5.25 | 8.04 | ||
| TNGC4214 | 10.13 | 17.32 | 0.0010 | 8.61 | 0.240 | 5.96 | 9.05 | ||
| TNGC5253 | 10.77 | 16.23 | 0.0010 | 41.16 | 8.86 | 0.027 | 5.83 | 8.15 | |
| UM465 | 13.96 | 17.01 | 0.0034 | 41.19 | 8.45 | 0.115 | 6.28 | 7.59 | |
| NGC6822 | 9.32 | 17.55 | 0.0001 | 6.52 | 0.169 | 4.48 | 7.90 | ||
| He210 | 12.46 | 18.78 | 0.0022 | 9.44 | 0.033 | 7.56 | 8.70 | ||
| SIIZw40 | 15.48 | 16.15 | 0.0026 | 40.75 | 8.99 | 0.056 | 6.81 | 8.37 | |
| SHaro2 | 12.97 | 19.07 | 0.0051 | 9.45 | 0.045 | 7.36 | 8.68 | ||
| SHaro3 | 13.21 | 18.19 | 0.0034 | 8.75 | 0.742 | 7.52 | 8.75 | ||
| SMark900 | 13.98 | 17.50 | 0.0038 | 6.30 | 8.93 | ||||
| SMark86 | 12.19 | 16.70 | 0.0015 | 8.31 | 0.298 | 6.18 | 8.28 | ||
| SUM456 | 15.21 | 16.72 | 0.0056 | 41.09 | 8.28 | 0.260 | 7.32 | 8.52 | |
| SUM462 | 14.56 | 16.33 | 0.0034 | 40.52 | 8.42 | 0.030 | 7.51 | 8.15 | |
| SMark297 | 13.44 | 21.19 | 0.0157 | 10.63 | 0.147 | 9.53 | 10.06 | ||
| SUM448 | 14.39 | 20.39 | 0.0182 | 42.04 | 10.49 | 0.114 | 9.33 | 9.67 | |
| column 7 | FIR colour, CFIR=log() | ||||||||
| T | Data from Taylor, Kobulnicky & Skillman (priv. com.) | ||||||||
| S | Data from Sage et al. 1992 | ||||||||
| UM465 | Data from Taylor et al. (1995) | ||||||||
| NGC6822 | Data from Davies (1972) | ||||||||
| He210 | Data from Kobulnicky et al. (1995) | ||||||||
2.1 Comparison with previous observations
Tacconi & Young (1987) and Sage et al. (1992) have previously observed this CO line in II Zw 40. A comparison of the measurements, taking into account the different beam areas, suggests that the present observations are 0.21 dex higher than those of Tacconi & Young (1987) and 0.35 dex higher than those of Sage et al. (1992). However, the centroid velocity of the present observations is 645 km s-1 while Tacconi & Young measure a velocity of 850 km s-1 and Sage et al. a value of 770 km s-1 respectively. Brinks & Klein (1988) have mapped II Zw 40 in HI with the VLA and they measured velocities between 750 and 800 km s-1 . The poor agreement between the velocity derived from our CO observations and the velocities seen in the VLA maps suggests a false detection of CO in the current observations.
Similarly, Taylor, Kobulnicky & Skillman (priv. comm.) have reported CO observations of UM477. The luminosity derived from the current observations is 0.42 dex higher than that observed by Taylor, Kobulnicky & Skillman, but the velocity from the current observations is in good agreement with the velocity of 1318 km s-1 obtained by these authors.
| ID | mB | MB | z | log(L) | log(LFIR) | CFIR | log(LCO) |
| erg s-1 | L☉ | K km s-1 pc2 | |||||
| 1 | 2 | 3 | 4 | 5 | 6 | 7 | 8 |
| UM286 | 15.2 | 16.68 | 0.0037 | 7.20 | |||
| UM323 | 16.1 | 17.22 | 0.0064 | 40.34 | 8.49 | 0.37 | 7.55 |
| UM334 | 17.2 | 16.98 | 0.0163 | 39.98 | 9.51 | 0.12 | 8.19 |
| UM351 | 18.2 | 16.91 | 0.0250 | 40.53 | 9.62 | 8.43 | |
| UM363 | 13.6 | 20.96 | 0.0170 | 41.69 | 9.90 | 0.005 | 8.85 |
| UM374 | 17.6 | 17.32 | 0.0191 | 40.87 | 9.48 | 0.36 | 8.42 |
| UM385 | 15.7 | 23.30 | 0.1629 | 12.43 | 10.06 | ||
| UM393 | 14.4 | 22.22 | 0.0424 | 10.14 | 8.89 | ||
| UM418 | 14.2 | 21.27 | 0.0253 | 10.54 | 8.57 | ||
| IZw18 | 15.6 | 15.18 | 0.0025 | 6.44 | |||
| UM439 | 15.3 | 16.45 | 0.0037 | 39.99 | 8.49 | 0.49 | 7.00 |
| UM444 | 16.7 | 19.00 | 0.0219 | 41.50 | 9.56 | 8.32 | |
| UM452 | 15.5 | 16.45 | 0.0046 | 39.35 | 8.53 | 0.80 | 7.33 |
| UM454 | 16.5 | 17.68 | 0.0126 | 40.03 | 9.17 | 0.45 | 8.26 |
| UM456 | 15.5 | 16.72 | 0.0056 | 41.09 | 8.43 | 0.26 | 7.50 |
| UM462 | 14.6 | 16.33 | 0.0034 | 40.52 | 8.59 | 0.03 | 6.92 |
| UM471 | 18.2 | 17.98 | 0.0351 | 41.07 | 9.97 | 8.95 | |
| UM483 | 15.9 | 17.12 | 0.0075 | 40.54 | 8.41 | 7.81 | |
| UM491 | 15.8 | 16.39 | 0.0063 | 42.09 | 8.51 | 0.42 | 7.66 |
| UM549 | 16.6 | 18.08 | 0.0193 | 41.03 | 9.23 | 8.21 | |
| UM307 | 14.4 | 21.07 | 0.0228 | 42.05 | 10.48 | 0.32 | 8.35 |
| UM343 | 14.1 | 20.78 | 0.0173 | 41.83 | 10.25 | 0.26 | 8.34 |
| UM388 | 17.7 | 21.63 | 0.1243 | 41.78 | 11.36 | 0.62 | 9.83 |
| UM413 | 17.6 | 20.97 | 0.0263 | 40.81 | 11.17 | 0.30 | 8.30 |
| UM530 | 16.8 | 20.93 | 0.0665 | 42.09 | 11.06 | 0.12 | 9.28 |
| UM641 | 15.2 | 20.33 | 0.0240 | 42.28 | 10.00 | 0.26 | 8.40 |
| UM156 | 13.5 | 22.43 | 0.0293 | 42.02 | 10.34 | 0.41 | 9.12 |
| UM191 | 15.3 | 19.87 | 0.2451 | 9.27 | |||
| column 7 | FIR colour, CFIR=log() | ||||||
| column 8 | Upper limit of CO luminosity | ||||||
3 Star formation in blue compact and star burst galaxies
In this section we investigate the correlations between the CO luminosities and the absolute magnitudes, Hβ luminosities, masses of neutral gas, far infrared (FIR) luminosities and the temperatures of dust in the blue compact and star burst galaxies in this sample. For completeness we have included (where possible) both detections and upper limits. The CO luminosity in the observed 35 region of each galaxy was calculated assuming (K km s-1 pc2) where is the radius of the 35 beam on the galaxy in pc. The true CO luminosities may be somewhat higher since the complete galaxy was not included in the 35 beam in every case.
The luminosities of the galaxies which were detected are given in Table 2 and the upper limits are given in Table 3. In Table 2 we have also collated the observations of CO in BCGs made by Sage et al. (1992) and those by Taylor, Kobulnicky & Skillman (priv. com.). In these tables we have included the absolute magnitudes, the FIR luminosities and the HI masses. For consistency the absolute magnitudes (in Tables 2 and 3) and the HI masses (in Table 2), were obtained from the LEDA compilation (Paturel et al. 1997). Similarly the FIR luminosities for all galaxies were obtained from Salzer & MacAlpine (1988) (these are co-added IRAS survey data) where available and from the LEDA compilation otherwise. The FIR colour in Tables 2 and 3 is defined as log where and are the FIR flux densities at 100m and 60m respectively. These fluxes were also obtained from Salzer & MacAlpine (1988) where available and from the IRAS Point Source Catalogue (Lonsdale et al. 1985) otherwise. The uncertainty in the and flux densities is between 5% and 15%; corresponding to a maximum error of 20% in the ratio .
In comparing the CO luminosities with HI masses and the FIR luminosities the differences in the apertures with which these observations were made should be borne in mind. The CO observations were made with a 35 field-of-view and the CO luminosities given in Tables 2 and 3 correspond only to the parts of the galaxies that were actually observed. The FIR observations (from the IRAS satellite) were made with apertures of 1.5 and 3.0 at 60m and 100m respectively, and the FIR luminosities of the complete galaxies will have been observed in all cases. Similarly, the HI observations have been made with a field-of-view larger than 35 in most cases.
The Hβ luminosities given in Table 2 and 3 were obtained from the equivalent widths of the Hβ lines and the B-magnitudes given by Salzer, MacAlpine & Boroson (1989) and Terlevich et al. (1991) respectively. The equivalent width of the Hβ line is obtained from spectroscopic observations made with a narrow slit and it is very likely that the slit was positioned on the brightest HII region in each galaxy in which these could be resolved. In using the equivalent width obtained from a narrow slit observation to obtain the luminosity of the entire galaxy we are assuming that the Hβ surface brightness of the galaxy is similar to that of the region where the slit observations were made. This is unlikely to be true for all galaxies, particularly the non-compact galaxies. The Hβ luminosities were corrected for extinction with the Galactic extinction law and the reddening coefficients given by Salzer, MacAlpine & Boroson (1989) and Terlevich et al. (1991).
3.1 CO–Absolute Magnitude correlation
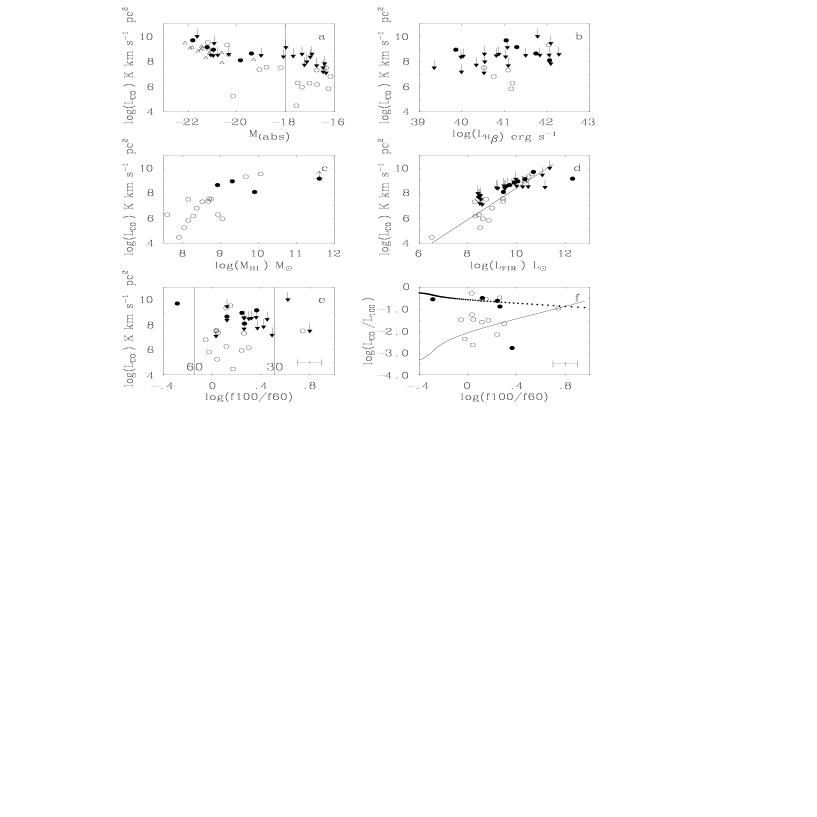
The absolute magnitude of a galaxy is an indicator of its total stellar population, including as it does both the young stars in a starburst and the underlying older stars. Also, through the mass luminosity relation, the absolute magnitude is indicative of the total stellar mass of a galaxy. The correlation between the CO luminosity and the absolute magnitude of the galaxies in these samples is shown in Fig.2a. In this sample of 34 galaxies, 14 galaxies are (equal to or) less luminous than Mabs = 18 (BCGs ) and 20 are more luminous than Mabs = 18 (giants). CO has been detected in only 5 giants i.e. 25% and not in any of the dwarfs. These observations of a large sample of BCGs confirm previous observations that BCGs are deficient in CO gas.
As already mentioned it is possible that the 35 beam of OSO does not detect the total CO content of some galaxies as their optical sizes, judged from their D25 diameters (Table 2), are considerably larger than 35. To check whether the CO luminosities of some of the galaxies in Table 2 may have been significantly under-estimated, we have included the observations of Young et al. (1986) in Fig. 2a. These authors have mapped CO in their sample of galaxies. In Fig. 2a, the data of Young et al. and the data of Sage et al. (1992) and Taylor, Kobulnicky & Skillman (priv. com.) are linearly correlated with and the present data are consistent with this correlation. A straight line fit to all data (both detections and upper limits, but excluding the data for NGC1569 and NGC6822) has the form;
with a Spearman’s rho correlation coefficient of -0.81
(ASURV software of Isobe,
LaValley & Feigelson STARLINK SUN/13.2, MUD/005)
The two discrepant points are for NGC1569 and NGC6822 (Taylor, Kobulnicky
& Skillman priv. com.). The D25 diameters of these two galaxies are
45 and 151 respectively and it is not clear why the CO luminosities of these
galaxies are lower than the luminosities of other galaxies of comparable absolute
magnitude.
This strong correlation between the CO luminosities and the absolute magnitudes of these galaxies suggests that the CO content of a galaxy is either determined by or depends on its total stellar content. It is also possible that the CO – Mabs correlation actually conceals the CO metallicity correlation via the relation log(O/H)+12 = 0.2Mabs+4.86 (Arimoto, Sofue & Tsujimoto (1996), Roberts & Haynes (1994), Wilson (1995)). It is not possible to confirm this possibility as metallicity data for the galaxies in the current sample are not available. The correlation in Fig. 2a. thus suggests that the CO luminosity of a galaxy is a tracer of either the total stellar mass or the metallicity of a galaxy.
The galaxies in this sample with detected CO are relatively red; the mean (B-V) 0.5. This is in disagreement with the observations of Israel, Tacconi & Baas (1995) whose observations of dwarf galaxies suggests that CO is preferentially detected in blue (dwarf) galaxies.
3.2 CO – Hβ correlation
The Hβ luminosity of a galaxy is proportional to the number of high mass stars in the galaxy, allowing for extinction and geometric factors (like the covering factor). The star-formation rate of the high mass stars is given by (Condon 1992)
where is the dereddened Hβ luminosity of a galaxy (in erg s-1) and is the covering factor. These high mass stars will only be a few million years old and will still be associated with the giant molecular clouds from which they formed. The CO – Hβ correlation thus provides a link between the molecular clouds in a galaxy and the population of the high mass stars which form from these clouds.
In Fig. 2b the CO luminosity is shown as a function of the Hβ luminosity. Both the CO detections and upper limits have been plotted along with the data of Sage et al. (1992) and those of Taylor, Kobulnicky & Skillman (priv. com.). The Hβ luminosities in Fig.2b suggest a SFR of M☉ yr-1 to M☉ yr-1. These SFRs have been obtained for a covering factor 1.0, this is unlikely to be the case for all galaxies in this sample.
A straight line fit to all data in Fig.2b. (i.e. both detections and upper limits) has the form;
with a Spearman’s rho correlation coefficient of 0.16 i.e. there is no correlation between the CO and Hβ luminosities. These data suggest that the SFR, as obtained from the Hβ luminosity of these galaxies, is independent of the CO content of these galaxies. It is possible that the assumption that the covering factor =1.0 for all our galaxies is wrong and that it may in fact be a function of the SFR; i.e. as the SFR increases, the wind and the supernovae will disperse the surrounding gas and decrease the covering factor.
3.3 CO-HI correlation
In order to investigate the relation between the CO and atomic gas contents of blue compact and star burst galaxies, the CO luminosity is plotted as a function of the HI mass in Fig. 2c. The LCO/MHI ratio in this sample varies from to . This range in the LCO/MHI ratio is equal to the range seen in galaxy type 1 to 7 (Sage 1993). At low atomic gas mass the luminosity of CO increases with the mass of the atomic gas, but the rate of increase slows down as the atomic gas mass increases. For masses of about 1010 and higher there is no further increase in the luminosity of CO. This ‘observation’ depends to some degree on the data for UM274, although there is evidence for flattening from atomic gas mass of 109 and higher. The D25 diameter of UM274 is 75 and if the CO density over the visible galaxy is assumed to be similar to that seen over the observed 35, then the CO luminosity of this galaxy will increase by about a factor of four (indicated by the arrow in Fig.2c). This will however not remove the flattening seen in Fig. 2c. The HI data for this galaxy were obtained with a field-of-view of 4 (E–W) and 22 (N–S) (Bottinelli, Gougenheim & Paturel 1982). If we assume that the total HI gas is within 4 and the CO is cospatial with HI then (for a uniform CO density) the total CO luminosity of this galaxy will be a factor of about 70 higher than the observed luminosity. This will still not completely remove the flattening in Fig.2c. It is unlikely that the CO luminosities of galaxies with HI mass greater than 109 will be significantly higher than those given in Table 2 for, although the atomic gas can extend to several times the optical diameter, the CO gas is likely to be clumped around star-forming regions rather than be globally distributed like the atomic gas. The change in the CO luminosity with increasing atomic mass could be due to following reasons:
-
•
At high atomic gas mass a large number of molecular gas clouds are formed in the galaxy and some clouds will be optically thick so that the total CO content of these clouds will not be detected. Also, if optically thick clouds shadow optically thin ones in both spatial and velocity space then a fraction of the CO in a galaxy will not be detected. High resolution spatial and velocity maps of these galaxies in molecular and atomic lines are required to explore this further.
-
•
Another possibility for the relation in Fig. 2c may be that the star-formation in UM274 and other high HI mass galaxies in this study is independent of total atomic gas mass. The star-formation may be either a stochastic process or be triggered by events external to the galaxy e.g. by collision(s) with other galaxies or intergalactic clouds. For example, Turner, Beck & Hurt (1997) have suggested that the low CO content of NGC 5253 may be a consequence of accretion of low metallicity intergalactic gas by this galaxy. In the case of UM274, the ‘tails’ in its optical image suggest a possible collision which may have triggered a highly efficient star-formation process and increased its atomic gas mass.
3.4 CO-FIR correlation
The correlation between the CO luminosity and the FIR luminosity in BCGs has been investigated by Rickard & Harvey (1984), Young et al. (1984), Sanders & Mirabel (1985), Young et al. (1986) and others. Young et al. (1986) found that the CO luminosity is linearly correlated with FIR luminosity and that this correlation depends on the dust temperature. The correlation is particularly tight for galaxies in well defined temperature ranges. The correlation between the CO luminosities and FIR luminosities of the current sample is shown in Fig 2d. As this sample is not large enough to divide the galaxies into dust temperature ranges, a power law was fitted to the all detections (open and filled circles) in Fig. 2d. We find a relation of the form
The Spearman’s rho correlation coefficient for this fit is 0.88. This result is consistent with the analysis of Young et al. (1986) and it would be tempting to conclude (as has been done by Young et al. as well as by Tacconi & Young 1987) that the CO luminosities of galaxies increase linearly with their FIR luminosities. However, this would be misleading because the upper limits have not been included in the linear fit. If the upper limits are included the Spearman’s rho correlation coefficient drops to 0.54 implying a weaker correlation. There are large numbers of FIR-bright galaxies which are not CO bright and the FIR luminosity of a galaxy is not a good tracer of the observed CO gas in a galaxy. The lower CO luminosity of some FIR luminous galaxies may be due to the presence of optically thick clouds which cause shadowing. This would be consistent with the CO–HI relation discussed in section 3.3.
Since massive stars are formed in dusty giant molecular clouds, the FIR luminosity is from dust heated by stars more massive than 5 M☉ (Devereux & Young 1990). The star-formation rate is given by (Condon 1992)
The SFR obtained from the FIR luminosity will be more accurate as it will not have been affected by extinction. The SFR in these BCGs, for the FIR luminosities in Fig. 2d, range from M☉ yr-1 to M☉ yr-1 for a dust covering factor .
At low FIR luminosities the SFR is considerably lower than that obtained from Hβ luminosities. However, at these low FIR luminosities the dust mass is about 50 M☉ (for a dust temperature of 45 K see section 3.5) and it is possible that the dust covering factor is not as high as that assumed here (the HI covering factor could still be high).
At high FIR luminosity the SFR derived from the FIR luminosities is almost 30 higher than that computed from the Hβ luminosities, and this may be due to extinction of the latter. At these high FIR luminosities the dust mass increases to M☉ and the dust extinction would be expected to be greater. Also the Hβ luminosity in section 3.2 has been corrected for reddening assuming a Galactic reddening law, but it is possible that in low metallicity galaxies the form of the reddening law is different, e.g. steeper, like that observed for the LMC and SMC (Nandy et al. 1981,1982). The Hβ luminosity will be considerably higher if a correction with a steep reddening law is applied.
3.5 Temperature dependence of CO luminosity
In Fig. 2e the CO luminosity is plotted as a function of the FIR colour. The FIR colour is proportional to the temperature of the dust. No correlation is seen between these two parameters. However, if the dust and the CO gas are assumed to be in thermal equilibrium then this figure suggests that CO exists preferentially in clouds with dust temperature between 30 K and 60 K (assuming dust emissivity of ) However, the distribution of data in Fig. 2e. almost certainly is due to a selection effect – the dust temperature in the selected galaxies happens to be between 30 K and 60 K. It is also possible that the (high temperature) dust detected at 60m and 100m and CO do not coexist.
To explore further this (lack) of correlation between CO luminosity and dust temperature we have examined the dependence of the LCO/L100 ratio on dust temperature. Young et al. (1986) have shown that if the CO gas and dust are assumed to be in thermal equilibrium then
where is the luminosity at 100m. In this relation dust emissivity proportional to is assumed. In Fig. 2f the ratio is plotted as a function of FIR colour and the full line is the relation. A statistical fit of the relation to these data has not been attempted as the assumptions in its derivation and the errors in the observations do not warrant such detail at present. The data in Fig. 2f suggest that for about 50% of the galaxies in this sample the ratio is consistent with the relation, in agreement with the conclusions of Young et al. . However, there are equal number of galaxies in Fig. 4f for which more accurately defines the relation between and the FIR colour. If the molecular gas is in thermal equilibrium with the dust then this suggests a dust emissivity proportional to in a large fraction of galaxies in this sample.
4 Conclusions
We have attempted to observe 12CO in a sample 34 galaxies selected for their high star-formation rate and a large spread in absolute luminosity (or equivalently a large range in metallicity). This sample has 18 BCGs. In this sample CO has been detected in only 5 galaxies and none of these are BCGs. We have combined these observations with published observations of CO to investigate star formation in these galaxies. The following conclusions have been reached:
-
1.
We have shown that CO is difficult to observe, or deficient in BCGs less luminous than . Since absolute magnitude is correlated with metallicity, these observations confirm that CO is deficient in low metallicity galaxies.
-
2.
The star-formation rate obtained from the Hβ luminosity of a galaxy is lower than that obtained from the FIR luminosity. This may be due to the following possibilities (a) that the reddening in low metallicity galaxies is considerably steeper than the Galactic reddening law used in this analysis, or (b) that the covering factor of the neutral hydrogen gas in these galaxies is considerably different from the covering factor of dust in these galaxies.
-
3.
The correlation between the CO luminosity and the FIR luminosity of the BCGs is rather weak i.e. FIR luminosity is not a good tracer of CO in a galaxy.
-
4.
In some galaxies the frequently assumed dust emissivity may not apply and in these galaxies a dust emissivity of may be a more satisfactory explanation.
Acknowledgements.
This paper was produced with facilities provided by the STARLINK Project, funded by PPARC at RAL. We would like to acknowledgements the use of LEDA extragalactic database. We are grateful to the TAC of OSO for allocating observing time. EB acknowledges support from CONACyT via grant number 0460P–E.References
- (1) Arimoto N., Sofue Y., Tsujimoto T., 1996, PASJ, 48,275
- (2) Arnault Ph., Casoli F., Combes F., Kunth D., 1988, A&A, 205,41
- (3) Bottinelli L., Gougenheim L., Paturel G., 1982, A&AS, 47,171
- (4) Brinks E., Klein U., 1988, MNRAS, 231,63P
- (5) Condon J.J., 1992, ARA&A, 30, 575
- (6) Davies R., 1972, IAU Symp., 44, 67
- (7) Devereux N., Young J.S., 1990, ApJ., 359,42
- (8) Elfhag T., Booth R.S., Höglumd B., Johansson L.E.B., Sandqvist Aa., 1996, A&AS, 115,439
- (9) Gondhalekar P.M., Morgan D.H., Dopita M., Phillips A.P., 1984, MNRAS, 208, 57
- (10) Gondhalekar P.M., Morgan D.H., Dopita M., Ellis R.S., 1986, MNRAS, 219, 505
- (11) Huchra J.P., 1977, ApJ, 217,928
- (12) Israel F.P., Burton W.B., 1986, A&A, 168,369
- (13) Israel F.P., Tacconi L.J., Baas F., 1995, A&A, 295,599
- (14) Kobulnicky H.A., Dickey J.M., Sargent A.L., Hogg D.E., Conti P.S., 1995, AJ, 110,116
- (15) Lonsdale C.J., Helou G., Good J.C., Rice W., 1985, Catalogued Galaxies and Quasars Observed in the IRAS Survey (Pasadena: Jet Propulsion Laboratory).
- (16) MacAlpine G.M., Smith S.B., Lewis D.W., 1977a, ApJS, 35,197
- (17) MacAlpine G.M., Smith S.B., Lewis D.W., 1977b, ApJS, 35,203
- (18) MacAlpine G.M., Lewis D.W., 1978, ApJS, 36,587
- (19) Nandy K., McLachlan A., Thompson G.I., Morgan D.H., Willis A.J., Wilson R., Gondhalekar P.M., Houziaux L., 1982, MNRAS, 201, 1P
- (20) Nandy K., Morgan D.H., Willis A.J., Wilson R., Gondhalekar P.M., 1981, MNRAS, 196, 955
- (21) Paturel et al. 1997, A&AS, 124,109
- (22) Roberts M., Haynes M.P., 1994, ARA&A, 32, 115
- (23) Rickard L.J., Harvey P.M., 1984, AJ, 89,1520
- (24) Sage L.J., Salzer J.J., Loose H.-H., Henkel C., 1992, A&A, 265,19
- (25) Sage L.J., 1993, A&A, 272,123
- (26) Salzer J.J., MacAlpine G.M., 1988, AJ, 96,1192
- (27) Salzer J.J., MacAlpine G.M., Boroson T.A., 1989, ApJS, 70,447
- (28) Sanders D.B., Mirabel I.F., 1985, ApJ, 298,L31
- (29) Searle L., Sargent W.L.W., Bagnuolo W., 1972, ApJ, 179,427
- (30) Scoville N.Z., Young J.S., 1983, ApJ, 265,148
- (31) Tacconi L.J., Young J.S., 1987, ApJ, 322,681
- (32) Talbot R.J., 1980, ApJ, 235,821
- (33) Taylor C.L., Brinks E., Grashius R.M., Skillman E.D., 1995, ApJS, 99,427
- (34) Telesco C.M., Harper D.A., 1980, ApJ, 235,392
- (35) Terlevich R., Melnock J., Masegosa J., Moles M., Copetti M.V.F., 1991, A&AS, 91,285
- (36) Thuan T.X., 1983, ApJ, 268,667
- (37) Turner J.L., Beck S.C., Hurt R.L., 1997, ApJ, 474,L11
- (38) Wilson C.D., 1995, ApJ, 448,L97
- (39) Young J.S., Gallagher J.S., Hunter D.A., 1984, ApJ, 276,476
- (40) Young J.S., Schloerb F.P., Kenny J.D., Lord S.D., 1986, ApJ, 304,443