The CAT Imaging Telescope for Very-High-Energy Gamma-Ray Astronomy
Abstract
The CAT (Cherenkov Array at Thémis) imaging telescope, equipped with a very-high-definition camera (546 fast phototubes with spacing surrounded by 54 larger tubes in two guard rings) started operation in Autumn 1996 on the site of the former solar plant Thémis (France). Using the atmospheric Cherenkov technique, it detects and identifies very high energy -rays in the range to a few tens of TeV. The instrument, which has detected three sources (Crab nebula, Markarian 421 and Markarian 501), is described in detail.
keywords:
Gamma-Ray Astronomy, Atmospheric Cherenkov detector1 Introduction
The recent development of Very-High-Energy Gamma-Ray Astronomy is essentially due to Atmospheric Cherenkov Telescopes (ACT). Since 1988, two arrays of Cherenkov detectors, ASGAT [1] and THEMISTOCLE [2] have been operated on the site of the former solar plant “Thémis”, close to Font-Romeu in the French Pyrenees. They consist of several stations sampling the Cherenkov front on the ground and reconstructing the direction of -ray showers through accurate timing measurements. Besides this sampling technique, in which -ray showers from a point-like source are discriminated from the large background due to charged cosmic-rays by means of the angular resolution, an important breakthrough was brought by the imaging technique, pioneered by the Whipple group [3]. In imaging Atmospheric Cherenkov Telescopes, the image of the shower is formed on a multi-pixel camera and the discrimination between -ray-induced and proton or nucleus-induced showers is based both on image shape and directionality. This technique proved to be the most powerful to reject the background and led to the discovery of at least four firmly established very-high-energy sources: the Crab nebula [4], the pulsar PSR 1706-44 [5], and the two relatively nearby Active Galactic Nuclei, Markarian 421 [6] and Markarian 501 [7]. In 1993, it was therefore proposed to complement the “Thémis” arrays by a high-performance imaging telescope, the overall setup being called “CAT” for “Cherenkov Array at Thémis”. The project was approved in 1994 and the new imaging telescope was commissioned in September 1996. Astrophysical observations started in October 1996. The main characteristics of the new instrument are the following:
-
•
The CAT imaging telescope achieves a relatively low energy threshold () despite its moderate reflector area (). The threshold of an ACT being essentially fixed by the night-sky background, it is important to protect phototubes from parasitic light by using Winston cones and to take full advantage of the rapidity of the Cherenkov signal. This is achieved here by combining an almost isochronous optics, fast phototubes with a good resolution at the single photoelectron level, and fast trigger electronics located just behind the photodetectors. By these means, the CAT imaging telescope achieves a threshold similar to that of the Whipple ACT, whose reflector area is .
-
•
The CAT imaging telescope provides a very high image definition (546 pixels with spacing in the central part of the field of view), resulting in improved background rejection and energy resolution. In a companion paper [8], it is shown that accurate analysis of the longitudinal light profile of the shower image allows the direction of each -ray to be determined with a resolution of the order of the pixel size, comparable to that of HEGRA stereoscopic system [9] at the same energies.
-
•
Particular care has been given to various monitoring facilities concerning the mechanical structure and the optics, as well as the phototubes.
-
•
Finally, the “Thémis” arrays (Imaging Telescope, ASGAT and THEMISTOCLE) yield simultaneous measurements of the energies of -ray showers by two complementary techniques: imaging and Cherenkov-front sampling. Such data provide a unique tool for cross-calibration, of particular importance for the determination of source spectra. The THEMISTOCLE array is now operated with an energy threshold of , whereas ASGAT (in the process of being upgraded) will work in the low-energy range ().
The general layout of the experiment is described in Section 2. Section 3 describes the optics and the mechanical structure and Section 4 the focal plane detector. The trigger and readout electronics are explained in Section 5 and the on-line software in Section 6.
2 General setup
The imaging telescope is located at latitude N, longitude E and altitude . It uses the alt-azimuthal mount of a former heliostat located approximately at the center of ASGAT and THEMISTOCLE arrays. Its orientation is controlled by computer in steps of both in elevation and azimuth. Its main mechanical and optical characteristics are shown in Table 1. The instrument is sheltered from bad weather by a building including a hangar mounted on rails which can be rolled away during observing periods (Fig. 1). In the garage position, the telescope axis is horizontal and the center of curvature of the central mirror element is easily accessed from the platform shown in Fig. 1. The setup used for mirror orientation (see section 3.1) is located at this point and is sheltered by the hut at the back of the platform when the hangar is closed. The control room is located under the platform.

| Total reflector area: | |
| Effective reflector area: | |
| Number of mirrors: | |
| Mirror diameter: | |
| Mirror curvature radius: | |
| Focal length: | |
| Total field of view (diameter): | |
| Angular accuracy on mirror orientations: | |
| Allowed range in elevation: | to |
| Allowed range in azimuth: | to |
| Possible rotation speed of the mount: | and |
| Maximum wind speed for acceptable images: | |
| Total weight of the moving part of the telescope (full load): |
3 Optical reflector and mechanical structure
3.1 The reflector
The reflector is based on the Davies-Cotton design [10]. The collecting area consists of spherical mirrors, in diameter, all with approximately the same radius of curvature (the measured values being in the range ), the centers of each elementary reflecting dish being located on a sphere centered on the reflector axis at a distance from the apex.
The mirror thickness () was chosen as a compromise between the weight (which must be accommodated by the mirror support and the heliostat mount) and the optical accuracy. Mirrors were manufactured from borosilicate glass (SIMAX) using a steel pressing form at a temperature of . After stripping from the mold, the “semiproducts” were cooled down in an electric conveyer furnace in order to remove residual stress, thus minimizing further deformations. Cooled semiproducts were then machined using the classic operations used in the optical industry. After quality testing, the reflecting surface was machined on vertical milling machines. The ground mirror semiproducts were further submitted to surface and geometrical checks. After washing and cleaning, the surface was covered by the aluminium film ( thick) in a vacuum tank. Mirrors were front-aluminized, which minimizes heat losses by radiation during the night and therefore condensation. The aluminium surface was then protected by a layer ( thick). The quality of the mirror surface was checked in the following way: 80% of the retro-reflected light from a point source at the center of curvature falls within a circle of radius, which corresponds to an angular dispersion of the direction of the normal to the mirror at any point about its theoretical value of , half of the value required in the design.

Each mirror is supported by a plate which is held by the mechanical structure at three adjustable points; the adjustment systems are located in the free spaces between individual mirrors. Each such system provides a coarse position adjustment and a fine orientation adjustment (Fig. 2).
Mirror orientations are tuned by means of three screws with spherical heads, each of which is free to slide along a V-shaped slot, thus providing the degrees of freedom needed for dilatations and adjustments. When all the mirror elements are correctly oriented, their axes should converge to a common point located on the telescope axis, namely the center of curvature of the central element . The adjustment of the mirror positions is checked in the following way (Fig. 3): mirrors are illuminated by a point-like source virtually located at point ; the light rays should be retro-reflected by a lateral mirror element to the image point , located on the axis of , beyond the center of curvature of . This beam is intercepted by an adjustable diaphragm located at , and received by a video-camera focused on the mirrors themselves; therefore, on the screen of the video-monitor, well-oriented mirrors should appear illuminated with azimuthal symmetry. By progressively reducing the size of the diaphragm, finer adjustments are obtained, eventually yielding an orientation accuracy better than . The optical tuning operation takes about one day and was only needed twice during the first year of operation.


3.2 The mechanical structure
The design of the mechanical structure was mainly constrained by the following requirements:
-
1.
The whole structure should be light enough to be accommodated by the heliostat mount.
-
2.
The mirror support should be rigid enough to keep mirror orientations correct in all telescope positions.
On the other hand, since the camera position is continuously monitored as explained in section 3.3 below, small displacements of the focal detector are tolerated. The whole structure was modelled using finite-element analysis programs, thus optimizing the global shape as well as discrete components to within the requirements. The study was completed and finalized by an interactive modelling program “EUCLID” [11] which allowed the manufacturing to be contracted-out. The structure can be subdivided into three parts: mirror support, camera support and connecting yoke, labeled (1), (2), and (3) respectively in Fig. 5.

3.2.1 The mirror support
The mirror support consists of a reticulated structure of thin steel tubes (Fig. 4). The nodes on the front side are arranged so as to match the adjustment systems of the mirrors. The other nodes and bars are laid out in order to get an isostatic structure in which each bar works either in compression or in traction, thus providing rigidity, lightness, and stability. This structure occupies a volume of and weighs . Particular care was taken to weld the tubes together in such a way that their axes converge as closely as possible to the theoretical positions of the nodes, an essential condition for rigidity. An annealing treatment was then performed in order to relieve stresses induced by welding. The very small change in the dimensions observed after annealing proved the high stability and rigidity of the mirror support. The total load due to mirrors and adjustment systems amounts to . In all telescope positions, this load induces an angular deformation lower than . These characteristics were confirmed from the comparison of real images of stars to images obtained by simulating the optics, including mirror irregularities and residual misalignments.
3.2.2 The camera support
The focal-plane detector (label 4 in Fig. 5), located away from the reflector, consists of the camera with its 600 phototubes immediately followed by the trigger electronics. It is held by a light support (label 2 in Fig. 5), with three arms, thus giving minimal optical shadowing while keeping a sufficient safety coefficient to avoid buckling. The load includes the focal-plane detector itself () and the cables connecting the detector to the readout electronics (). The camera support, coupled to the connecting yoke (label 3 in Fig. 5), is completely independent of the mirror support (Fig. 6); the latter is therefore not submitted to additional stresses. These different parts are indicated with the same labels in Fig. 6. The small deformation of the tubes leads to displacements of the focal detector perpendicular to the telescope axis. In order to correct for this effect, the detector position is continuously monitored by a CCD camera (label CCD1 in Fig. 5) located on the mirror support and yielding the positions of three photodiodes inserted in the honeycomb structure holding the phototubes. The maximal shifting of the focal-plane detector when going from the vertical to the horizontal position of the telescope is , corresponding to in the focal plane.

3.2.3 The connecting yoke
The connecting yoke (label 3 in Fig. 5), directly fixed on the telescope mount, provides the connection between the mirror support and the camera support. It also holds the counterweight in which all the readout electronics and power supplies (label 5 in Fig. 5) are accommodated. In this way, cables coming from the focal-plane detector remain bound to the moving part of the telescope and are not submitted to twisting. The connecting yoke allows any elevation angle between and to be reached. It covers the mount completely at zenith. The balance of the system is adjusted so that the torque in elevation acts always in the same direction, so as to have no play in the elevation gearing.
3.3 Mechanical monitoring by CCD cameras
Three CCD cameras (referred to as CCD1, CCD2, and CCD3 respectively in Fig. 5) fixed on the mirror support, are used to monitor mechanical deformations and to measure the pointing correction, i.e. the small shift between the theoretical direction of the source aimed at and that of the telescope axis. Camera CCD1 monitors the position of the focal-plane detector with respect to the reflector reference frame by means of three photodiodes in the focal plane. Camera CCD2, located close to the reflector center and co-aligned with its axis, and camera CCD3, taking the place of an edge mirror element, both monitor the star field surrounding the source. Comparison of the images in cameras CCD2 and CCD3 allows verification that the deformation of the mirror support remains within the limits expected from the finite-element modelling. The transformation which maps the star field viewed by camera CCD2 onto that viewed by the focal-plane detector is obtained in dedicated periods of data-taking in which a white screen is placed in the focal plane and the telescope is continuously aimed at a bright star-field. The image formed on the screen is viewed by camera CCD1, together with the three photodiodes which monitor the position of the focal-plane detector. These measurements allow the position of the optic axis in the focal plane to be parameterized as a function of azimuth and elevation, using a model which takes into account the gravitational bending of the camera support and the slight misalignments of the azimuth and elevation rotation axes.

Using this model together with data of cameras CCD1 and CCD2 in normal data-taking periods, the source can be localized in the field of view of the main camera with an accuracy of , i.e. better than of the pixel size, as shown in Fig. 7. This has been confirmed by using two independent methods. In the first, the telescope was maintained at different fixed orientations and the tracks of bright stars through the phototubes were used to determine the true telescope position. In the second method, the star field was directly identified from the readout of phototubes during normal data taking; this is achievable with pixels provided that the field of view includes at least 4 stars with magnitude lower than 7; in this case the direct mapping of the camera reference frame onto the sky is obtained for short time-intervals (). All three methods give consistent results in the determination of the source position in the field of view within the accuracy quoted above.
4 The focal-plane detector
The imaging camera, located in the focal plane 6 meters away from the mirrors, provides a field of view of diameter covered by small phototubes ( diameter), extended to by two guard rings of larger tubes, as shown in Fig. 8. All 600 phototubes are equipped with aluminized Winston cones.

4.1 Photomultipliers
The inner phototubes are Hamamatsu R3878, which have the following characteristics:
-
•
a very small diameter of to achieve the goal of a high granularity for the matrix;
-
•
a very fast rise time () and narrow width () to match the speed of the Cherenkov pulse;
-
•
good photoelectron resolution (see Fig. 9) for an accurate photon count;
-
•
low dark-noise rate ( at a 0.3-photoelectron threshold with a phototube gain of );
-
•
UV glass to match the wavelength range of the Cherenkov light taking account of atmospheric absorption.
A laboratory calibration was performed [12] which yielded the gain as a function of high voltage, the single photoelectron peak’s mean value and standard deviation being obtained for each phototube by a Gaussian fit. On a large sample, the average value of was found to be with an RMS of 0.04 (independent of the high voltage), with a peak/valley ratio of at a gain of . Assuming a relation between the phototube gain and the high voltage of the form , the value of was measured for each phototube, allowing a determination of the high voltage for the desired operating gain of . The average values were found to be and and the corresponding RMS’s and . Because the trigger zone of the camera requires a small transit time spread, the phototubes were grouped by transit time for each sector, since a variation entails a shift. The conversion factors (ADC counts)/(photoelectron) are currently measured every month using a pulsed LED at very low light level; the single photoelectron spectrum is thus observed at a gain of , allowing the peak to be well separated from the pedestal (Fig. 9) and providing a low enough fitting threshold ( photoeletrons). In order to evaluate the influence of the night-sky background on the trigger rate, phototubes were illuminated through optical fibres with white light. The counting rate variation as a function of the comparator threshold with clearly shows two different zones with a break interpreted as due to after-pulses (Fig. 10). Taking this into account, it is found that an individual threshold around 3 photoelectrons leads to a reduction of in the sky noise rate.

The larger guard phototubes are Hamamatsu R6076 with a diameter of , a fast rise time () and a photoelectron resolution comparable to that of the small phototubes.

4.2 Winston collecting cones
The Winston cones [13] are an essential element of the camera optics [14]. The dead-space between the photocathodes of the phototubes is of the order of 65% for the fine-pixel region. It can be substantially reduced to approximately 10% using reflective “light funnels” to gather the photons falling between the phototubes. The second major role of the cones is to block out much of the albedo light coming from beyond the mirror, back-reflecting it away from the photocathode.

The Winston cones are milled from plastic, with three coats of varnish applied to the interior to smooth the surface, on which are deposited a reflective aluminium coat with a quartz overcoating. The entry diameter of the cone is , and the exit diameter of the cone is , with an interior form such that photons arriving at angles greater than should be rejected while those at lesser angles should arrive on the photocathode either directly or after a single reflection. Since the exit of the diameter of the cone is smaller than the photocathode diameter (), only the central part of the photocathode is used, thus reducing the transit time dispersion and increasing the collection efficiency. Measurements of the response of these Winston cones as a function of the light incident angle are shown in Fig. 11, from which it can be seen that the light from the albedo region is greatly reduced, while about twice as many photons coming from the mirror are collected than with a bare phototube. The reflectivity of the cone integrated with a diffuser reproducing the shape of the mirror and seen under the same solid angle was measured at different wavelengths. Averaging over the angle of incidence and over the wavelength range of interest, the collection efficiency of the cones was found to be .
Equivalent Winston cones with an entry diameter of and an exit diameter of equip the guard phototubes.
5 Electronics
5.1 General architecture
In order to minimize the use of long cables, the electronics was designed in two parts:
-
•
a very compact part, including the trigger logic, located just behind the phototubes;
-
•
a second part located in the counterweight of the telescope (label 5 in Fig. 5), including the high voltage, the readout electronics and the on-line computer.
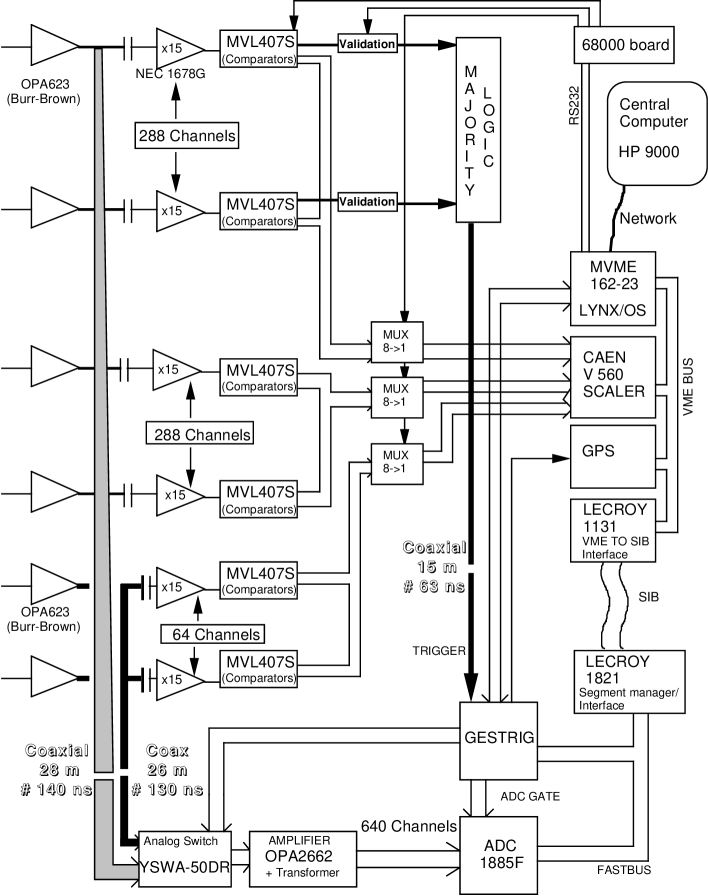
Therefore, the whole electronics is mounted on the moving part of the telescope, thus avoiding the torsion of cables. Digitized data are transmitted to the control room by means of an optical fibre. The time of each event is measured to an accuracy of by a clock based on the Global Positioning System (GPS). Fig. 12 shows the overall structure of the signal processing.
5.2 The focal detector electronics
The phototube pulse is first shaped by an OPA623 amplifier which brings its width to so as to take into account fluctuations in the photon arrival times () and to minimize the effect of the mirror asynchronism (). After this front-end amplifier, the signal is split into two electronics paths: the digital treatment to trigger the camera and the analogue treatment (described in 5.3) to measure the charge at the anode of each phototube.
In order to have a good containment of shower images in the field of view, the trigger zone was reduced to the inner 288 phototubes. The trigger logic was designed to minimize random coincidences due to the night-sky background, which has been measured to give photoelectrons per second in the phototubes. Given the known efficiency of the detector, this is compatible with the generally quoted value of [15]. A simple majority coincidence logic involving the 288 phototubes would have led to several tens of Hz of random triggers. The trigger zone was therefore subdivided into 9 angular sectors of 48 phototubes, thus reducing the combinatorial factor. This also minimizes the effect of possible increases of the counting rates on several phototubes (e.g., if a star is momentarily located in a pixel) and reduces the rate of triggering hadronic showers. In order to avoid any loss of efficiency at the sector boundaries, 16 phototubes from each sector overlap with the adjacent sector (Fig. 13). The threshold level for the phototubes and the number of tubes in coincidence in each sector are adjustable under computer control. During the first year of operation, the phototube threshold has been fixed at the level of 3 photoelectrons, leading to a typical counting rate , and has been set to 4. With such conditions, the random coincidence rate is reduced to values well below , whereas cosmic-ray showers and muons contribute to about at moderate zenith angles.
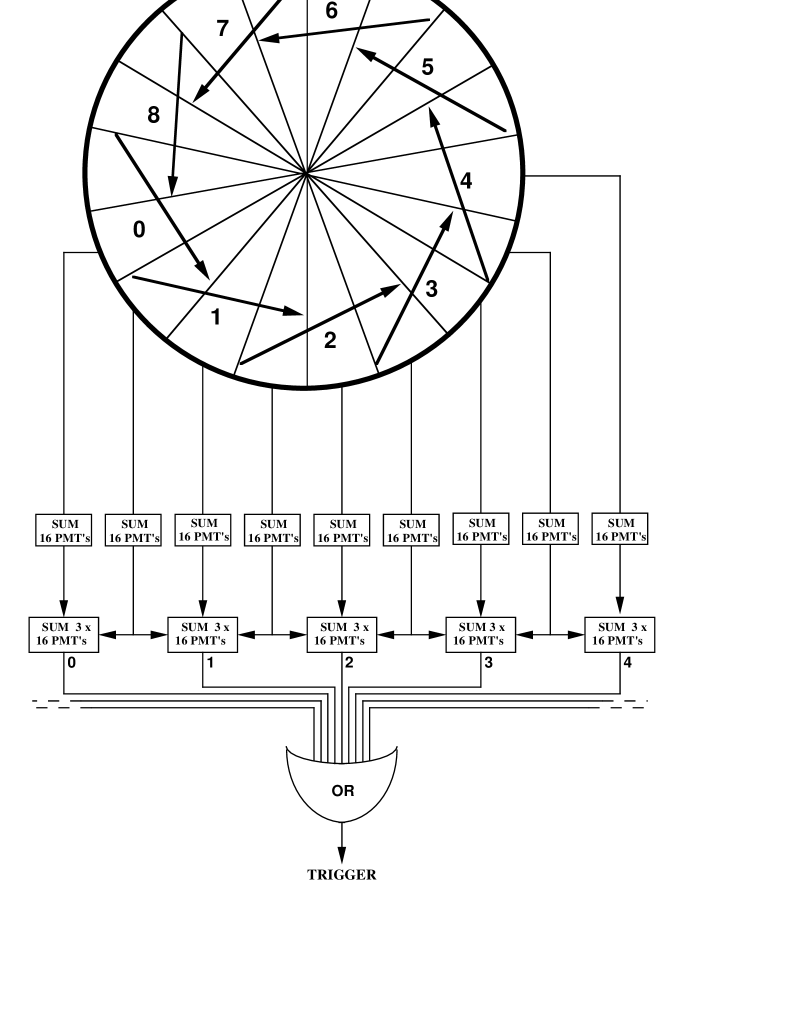
To minimize the coincidence time-window as much as possible, comparators instead of discriminators are used, thus taking the best advantage of the signal rapidity. The signal is first amplified by 15 with a wide-band NEC1678 amplifier to allow a very low threshold of the order of 1 photoelectron (at a gain of ). A sum is performed over 16 comparators’ outputs which is fed to the second stage where an analogue sum over the 3 outputs corresponding to the preceding partial sum is performed (Fig. 13). This way, 9 sums over 3 sub-sectors are obtained. The majority logic condition (at least pixels among 48 above the threshold) is carried out independently for the 9 sums by a discriminator. The trigger is enabled by an OR logic function over all sectors.
Each comparator output is also sent to an 8-channel multiplexer connected to scalers. The counts are integrated for each phototube over 1 second, with a cycle duration of 8 seconds. This allows the singles count rate to be recorded for each phototube in order to:
-
•
monitor the long-term and short-term variations of the night-sky background;
-
•
detect the presence of a star in the field of view of a phototube to automatically decrease its high voltage;
-
•
detect channels with anomalous counting rates due to electronic noise, in order to remove them from the trigger logic and from the physical analysis.
The compact electronics is cooled using 17 computer-controllable fans inset in the camera box. The temperatures at 8 different locations within the box are continuously monitored by the computer and recorded in the data.
5.3 Charge measurement
The analogue signals as well as the trigger signal are carried to the ADC’s located in the counterweight through long cables (Fig. 12). In order to minimize the night-sky background contribution, the charge is integrated over a gate as narrow as possible compatible with the width of the signal. Therefore, fast analogue gates are used to replace the ADC gate of the LeCroy 1885F modules which has a minimum width of . With the background rate due to the sky noise quoted above, only 0.1 photoelectrons are expected within the gate. The electronic noise is dominant over the night-sky background with an RMS of 0.4 photoelectron in each pixel. Gates are opened simultaneously for all phototubes with each camera trigger. The phototubes are so fast that practically all the charge is contained in such a gate.
After being filtered by the gate, the analogue signal is sent to an OPA2662 wide-band amplifier (Gain4). The differential output enters a 15-bit LeCroy 1885 Fastbus ADC (96 channels) with 2 different conversion scales of per count for pulses up to and of per count above . In this way, the very wide dynamical range necessary to cover a gamma-ray energy range from a few hundreds of GeV to a few tens of TeV is achieved. The conversion time for the ADC’s is , but the dead-time induced by the full readout chain for the 600 phototubes is .
A larger gate is also generated by computer-controlled triggers every 10 real events. This larger integration time allows a precise determination of the night-sky background by fitting an adapted function to the ADC counts histogram. The average rate of background photoelectrons during each 30-minute running period is used to correct the pedestal determination obtained on real data. This correction is necessary since pulses’ overshoots due to the effect of capacitive links induce a shift of several ADC counts.
5.4 High Voltage control
High voltages are controlled and monitored by means of CAEN SY527 high-voltage boards (24 channels, model A933K). Each phototube can be addressed via a CAENET bus. Individual voltages can be modulated in a range of , which is sufficient to lower the high voltage of a tube illuminated by a bright star or showing a pathological behaviour.
6 Data acquisition and monitoring software
The data-acquisition system for the CAT imager must control a number of subsystems, all programmed in C:
-
•
Imaging camera, including phototube high voltage control, ADC and GPS readout, scalers readout, trigger logic (section 5), implemented on a Motorola 68020 processor.
-
•
Telescope tracking control (section 2), implemented on a PC.
-
•
CCD monitoring of telescope position (section 3.3), implemented on a PC.
The three subsystems are connected over the network to a central machine (HP 9000). In order to control this ensemble, the “General Application Server” (GAS) was developed. This model, described in [16], is a flexible architecture for experiment control, which is implemented using standard TCP/IP services and POSIX-compliant code. In this way, portability, maintainability, and re-usability goals are met.
In this model, each subsystem is controlled by a Control client and monitored by one or more Data clients (Fig. 14). These clients are connected together via a GAS Server which launches and communicates with the subsystem’s Remote Control Task. The GAS servers, Control clients, Remote tasks, and Data clients can run anywhere on the net. As each is an independent process communicating with the others by TCP/IP, they are more easily modifiable and debugging is simplified.
The acquisition is orchestrated by a “Master Run Controller”, which loads a separate GAS Control client for each subsystem (the Control client being specific to that subsystem), and synchronizes commands to open and close data files for the subsystems. As the Control clients run as sub-programs of the Master, common information (e.g., source position, high-voltage status) is communicated via global variables.
Each GAS Control client launches an instance of the GAS server (by the Remote Shell TCP/IP service), and commands it to launch the Remote Control Task for its subsystem on the appropriate machine (also by remote shell). The use of the standard POSIX remote shell allows communication with the process launched by POSIX’s standard stdin, stdout, and stderr I/O channels. Typically, the Remote Control task is run on a machine near the subsystem hardware. The configuration of the subsystem is stored in the GAS Server by the Control client and passed to any relevant Data client which connects to it. The Control client sends commands to the Remote Control Task via the GAS Server, which simply passes on the commands and returns acknowledgements and alarms from the Remote task to the Control client. The data from the Remote task are sent to the GAS Server, which stores them on disk if requested by the Control client. The data files from each subsystem are combined off-line and translated into F-Pack format [17].
Specific Data clients are used for monitoring of data quality, detector state, et cetera. For example, for the Imaging camera subsystem, Data clients monitor the actual high voltage values, scalers rates, temperatures in the camera box, and provide also a sample of the Cherenkov images. These Data clients can be launched either automatically by the Master Run Controller at start-up or manually by the operator at any time during data-acquisition. A data client searches through the running GAS servers to find the one which is connected to the desired subsystem. When found, the Data client receives a copy of the configuration buffer from the GAS Server and can then request a specific type of data sample (high voltages, scalers, etc.). The Data clients communicate with the Server using standard TCP/IP sockets.
The most complex subsystem to control is the Imaging camera. The Remote control tasks for the Imaging camera run a Motorola 68020 processor running under Lynx-OS mounted in the counterweight of the telescope, close to the electronics. These Remote Control tasks are implemented using grammar-interpreters which execute the control statements coming from stdin and which output data to stdout and acknowledgements to stderr. Thus, the control statements are expressed in a readable and easy-to-understand language. This approach facilitates their stand-alone execution and debugging: the Control task can be launched locally, redirecting outputs to files or filters, and the control statements typed to the input to analyze hardware response and/or data outputs.
The readout tasks are POSIX-compliant threads. To enable readout, the Remote Control task launches these threads, which output data when triggered. The access to the output channel is a shared resource, so a mutual exclusion is implemented using standard mutex functions.
For the CAT Imaging telescope, the Master Run Controller, Control clients, and Data clients have been implemented in LabVIEW, a graphical programming language which allows user interface to be easily developed. The GAS server itself is a small C program (1000 lines) and a C-shell script. In this script the Remote Control task is launched using the standard remote shell command, and its outputs are piped to the GAS Server input. The use of this highly-modular architecture allowed the data-acquisition to be developed rapidly and should permit the other experiments on the site to be integrated.
7 Conclusion
With the trigger conditions explained in section 5.2, random coincidences due to the night-sky background have a negligible contribution and the trigger rate, essentially due to hadronic showers and single muons, is at moderate zenith angles (). The rate due to single muons—obtained when the sky is overcast—amounts to . At this threshold, the rather moderate background-event rate is due to a primary rejection by the trigger hardware.
From the observations of the Crab nebula between November 1996 and March 1997, a preliminary estimate of the energy threshold () has been given [18]. It may be possible to lower the threshold further as the data acquisition system should be able to cope with increased trigger rates. During the first year of operation, three sources have been detected: the Crab nebula [18], Markarian 501 [19] and Markarian 421.
References
- [1] Goret, P., et al, Astron. Astrophys.,270(1993)401.
- [2] Baillon, P., et al, Astroparticle Physics,1(1993)341.
- [3] Cawley, M.F., et al, Exper. Astron. 1(1990)173.
- [4] Vacanti, G., et al, Ap.J. 377(1991)467.
- [5] Kifune, T., et al, Ap.J. 438(1995)L91.
- [6] Punch, M., et al, Nature 358(1992)477.
- [7] Quinn, J., et al, Ap.J. 456(1996)L83.
- [8] Le Bohec, S., et al, Nucl. Inst. and Meth., accompanying paper (1998).
- [9] Daum, A., et al, Astroparticle Phys.,8(1997)1.
- [10] Davies, J.M., and Cotton, E.S., J. Solar Energy, Sci. Eng.,1(1957)16.
- [11] EUCLID, product of MATRA-DATAVISION.
- [12] Barrau, A., Nucl. Inst. and Meth. in Phys. Res. A387(1997)69.
- [13] Winston, R., Welford, W.T., in “High Collection for Nonimaging Optics”, Academic Press (1989).
- [14] Punch, M., in Towards a Major Atmospheric Cerenkov Detector III, pp. 215-220, T. Kifune ed., Universal Academy Press Inc., Tokyo(1994).
- [15] Jelley, J.V., Cherenkov Radiation (Pergamon, 1958).
- [16] Delchini, H., et al, Proc. of International Conference on Computing in High Energy Physics, Berlin, April 1997, p. 124, Elsevier ed.
- [17] Blobel, V., Proc. of International Conference on Computing in High Energy Physics, Annecy, September 1992, p. 755, C.Verkerk and W.Wojcik eds.
- [18] Goret, P., et al, Proc. of XXVth International Cosmic Ray Conference, Durban, South Africa, July 1997, Vol. 3, p. 173, M.S. Potgieter, B.C. Raubenheimer and D.J. van der Walt eds.
- [19] Punch, M., et al, Proc. of XXVth International Cosmic Ray Conference, Durban, South Africa, July 1997, Vol. 3, p. 253, M.S. Potgieter, B.C. Raubenheimer and D.J. van der Walt eds..