Observations of TeV gamma ray flares from Markarian 501
with the Telescope Array Prototype
Abstract
We will report the observations of TeV gamma ray flares from Markarian 501 using Telescope Array Prototype. The observation were carried out continuously from the end of March to the end of July in 1997. The energy spectrum, and the time variation of the gamma ray intensities are shown. The intensity has been changed by the order of magnitude in this period and the possible quasi periodic oscillation of 12.7days were discovered.
1 Introduction
Markarian 501 (Mkn501) is an extragalactic BL-Lac type object at z=0.034. It is observed in radio, optical and X-ray bands, and can be characterized in flat spectrum radio, highly optically polarized and optically violently variable. BL-Lac type objects are considered to be a kind of AGN, which have a jet oriented to our line of the sight. Recently, Mkn501 (Quinn et al. (1996); Bradbury et al. (1997)), Mkn421 (Punch et al. (1992); Petry et al., (1996); Aiso et al., 1997a ), and 1ES 2344+514 (Catanese et al., 1997a ) have been identified as TeV gamma ray sources, and they are all BL-Lac objects. Gamma rays from Mkn501 around 100MeV to 10GeV was not observed by the CGRO EGRET detector(Shrader and Gehrels (1995)), however, emission in the TeV energy region were discovered by the Whipple telescope (Quinn et al. (1996)) and confirmed by the HEGRA telescopes (Bradbury et al. (1997)). Detailed study of gamma rays from AGN will give us information about the environment surrounding the huge black hole located at the center of the AGN, and the high energy phenomena and particle acceleration in the jet. The time scale of the intensity variations of the TeV gamma rays may explain the particle acceleration site is close to the black holes. TeV gamma rays from such extragalactic object interacts with the infrared background photons, and a cutoff of the energy spectrum is expected around 7-15TeV(Stecker and DeJager (1997)). There is an ambiguity in the prediction of the cutoff energy due to the uncertainty of the number density of infrared photons. In the discovery stage, the intensity in the TeV energy range was very small, corresponding to 8% of the Crab nebula flux, however, from Mar 1997 it increased dramatically and variated from 0.3 to 4 Crab flux. It is found that the variation of the intensities are larger in the TeV range than X-ray and other ranges(Catanese et al., 1997b ). These flares are observed by Whipple , HEGRA, CAT, TACTIC and the Telescope Array Prototype (TAP) (Quinn et al. (1996); Bradbury et al. (1997); Barrau et al., (1997); Bhat (1997); Aiso et al., 1997b ). The flares were continuously observed until the end of July 1997. Here we will report the details of the Mkn501 observations by TAP.
2 Experiment
The Telescope Array Prototype detector Aiso et al., 1997c , a seven telescope array is under construction at Utah, Dugway. Its geographical position is N, W at an altitude of 1600m above sea level. The prototype detector works in dual modes: the Cherenkov and the air fluorescence mode. Construction started in the summer of 1996, and currently three telescopes with the respective separation of 120m are in operation. The seven telescopes will be arranged in a hexagonal grid with a separation of 70m to maximize the detection efficiency of TeV gamma rays. Each telescope is the alt-azimuth mount with a 6m2 main dish. The main dish consists of 19 hexagonal shape segmented mirrors coated with anodized aluminum. The reflectivity of mirrors are about 90% at wave length of 400nm. At the focal plane, a high resolution imaging camera of 256ch photomultipliers is installed to measure detailed images of Cherenkov light from gamma rays and cosmic rays. The Cherenkov light images are used to distinguish the gamma rays from the huge number of background cosmic rays. The typical cosmic-ray rate is about 1000/min and the gamma-ray rate from the Crab nebula is about 0.5/min (Aiso et al., 1997b ) with three telescopes. Therefore rejection of cosmic ray background events using the shape parameter of the Cherenkov light is essential to obtain a reasonable S/N ratio in this experiment, and we use the techniques originally developed by the Whipple group (Hillas (1985)). The absolute pointing accuracy of the telescopes is typically 1 arcmin which is frequently calibrated by imaging bright stars.
The signals from the 256ch camera are amplified just behind the camera in order to minimize electric noise and to obtain better timing resolution, and are then fed to ADC and TDC modules mounted at the telescope base to measure the amplitude and the timing after passing through 10m of twisted pair cables. The triggering requirement to record the event is four folds out of 256 tubes. The threshold of the discriminators are set at 5 photoelectron level. The single counting rates in each tube are set to 3-5kHz in each channel. The threshold energy for detectable gamma rays is 600 GeV for vertical showers. The Mkn501 was observed with the raster scan tracking mode. In this mode, the telescope tracking center scans the sqaure region of in right ascension and declination coordinate centered on the target. There are several advantages in this method compared with the conventional on-source / off-source tracking mode. The on-source and off-source sky region can be observed simultaneously. The systematics of the imaging devices can be reduced significantly. By observing the bright star images, the calibration of the telescope absolute direction can be done with the accuracy of . Our telescopes will be described in more detail elsewhere.
This observation of Mkn501 was carried out from the end of March to the end of July, 1997. We observed a total number of 47 nights for a total observation time of 105.4 hrs. We have observed 3,400,000 events in the F.O.V. of around Mkn501, which are mainly cosmic-ray protons and Helium nuclei. In the analysis, we have limited the zenith angle to the range of to in order to reduce the systematic errors in the energy and the aperture estimates. This leaves 2,160,000 events and 64.0 hrs of live time, with an average event rate of 9.4Hz with three telescopes. Among these events, we selected gamma ray candidates using the shape parameters of Cherenkov images and their directionality. We can determine the arrival direction of gamma rays and the cosmic rays with an accuracy of (the elliptical errors) in each event. Therefore, 97% of the background events around the target, say within , can be rejected. The cosmic rays show larger images than gamma rays, and they are rejected with 95% efficiency through the image selection. Therefore, typically 99.95 % of the background events around the target are rejected with the image and the arrival direction using the present analysis method. 35 % of the gamma rays remain through this process. Therefore, even if the original is bad as , we can obtain of order .
3 Analysis
At first, the clean Cherenkov images are obtained by removing the background photons with the timing information. The signal timings of each photomultipliers are recorded with an accuracy of 1nsec. The Cherenkov light signals from gamma rays and cosmic rays are concentrated within a 10 nsec interval, however noise including the photons from star light and the air glow are randomly distributed in time. Therefore we require a timing alignment with a software gate set at 40 nsec. Then we require the clustering of hit tubes, geometry. After these selections, the chance coincidence events due to the random coincidence are completely rejected and the pure Cherenkov events induced by gamma rays and cosmic rays remain.
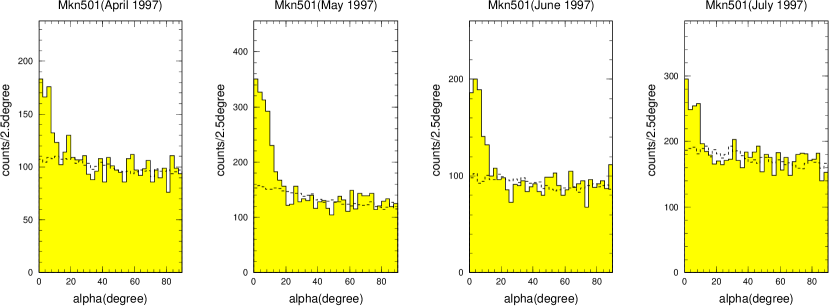
Then, the image parameters are calculated: signal size SIZE, the centroide position of images (x,y), WIDTH, LENGTH and CONC. The events with images located near the camera boundary are cut by requiring the condition , because the images near the camera boundary are distorted due to the boundary. The gamma rays show the compact images compared with the hadronic showers, so we then selected the events which has a smaller WIDTH and LENGTH region similar to what is predicted by a Monte Carlo simulation. We select events with the following conditions, , and , where and correspond to 30% and 50% of the points obtained by integrating the width distribution from off-source events (Hadron events). The typical values of and are and , respectively, and they naturally contain the zenith angle dependencies and the weather conditions, and we could obtain the constant fraction of data as gamma ray candidates. The SIZE of 400 corresponds to the the average value of SIZE. The second terms (0.020 and 0.023) represent the SIZE dependence of the images as predicted by the Monte Carlo simulation. The parameter corresponds to the light concentration, as gamma ray showers have a higher light concentration than hadronic showers. After these selections, 8-10% of events remain. Finally, we select for gamma ray showers using the directional information obtained by the asymmetry of shower images. We select for events which develop from neighbouring of the target source to outer direction. Finally, 97% of the hadronic showers are rejected and 30-40% of gamma rays are selected. After these cuts we obtained the excess of from the direction of Mkn501. The monthly excesses in the alpha distribution are shown in Figure 1.
3.1 Energy Spectrum
The absolute gain calibration is carried out by the measurement of a single photoelectron. We found that a single photoelectron corresponds to 4 ADC counts. The relative gain of each channel of 256ch is adjusted to within 5% accuracy using the LED pulsar. We confirmed that the distribution observed is consistent with the simulated showers assuming the cosmic ray energy spectra in each composition. The uncertainty of the absolute gain or the and the energy relation is estimated as to be 20%. With a Monte Carlo simulation, we can determine the effective area for gamma rays and hadrons, and . We also obtain experimentally the number of the excess events , and number of background events . In order to minimize the systematic errors, we took the ratio . The denominator has a weak dependence on SIZE with our imaging selection of approximately . The energy and the relations for gamma rays and hadrons are determined by our Monte Carlo simulation to be TeV and TeV, respectively. Then we can obtain the gamma ray energy spectrum from . The derived energy spectrum is shown in the Figure 2. . The differential energy spectrum can be well fit with the power law spectrum of index -2.5 up to 5 TeV. The spectrum becomes steeper above 5TeV which may suggest a cutoff of the energy spectrum. However, it is possible that statistical fluctuations may make this effect. We need more statistics to obtain conclusive results. The saturation of the photomultipliers, the amplifiers, and the ADC is considered to occur at higher energy, above 30 TeV. We could minimize this saturation effect by the above ratio method.
3.2 Time Variation
The observation of the Mkn501 was carried out for 47 nights from the end of March to the end of July. The gamma ray event rate is plotted as a function of MJD in Figure 3. For reference, the gamma ray rate from the Crab Nebula measured by our detectors is shown by a horizontal line. The event rate was highly variable day by day, and the maximum event rate was about 4 Crab and the minimum rate was Crab. The time scale of the intensity change was about a few days. We searched for a short time variation of the intensity but we could not find clear evidence of any short time variation in our data set.
We can see high states and low states clearly in our data set. This feature (the time scale and the intensity change) in April and in July appear to be similar, showing “U” shapes, and the interval of the two high states are 14 days and 12 days. May and June data each show only one high state “” shapes. In order to examine the periodicity in the data set, the data shifted by 25.5 days are superposed in the bottom pannel of Figure 3. We can see good coincidence of the high states. This test suggests a day periodicity.
The periodicity of the gamma ray intensities was examined by the Rayleigh test. We calculated the powers (amplitude when fitting sinusoidal function) in each test period from 5 days to 45 days. In order to evaluate the significance in each test period, we have generated data set artificially by shuffling the relation of (, MJD), where is 47 flux points in Figure 3. (These data set also has the same gaps in the observation time.) They are analyzed in the same way as the real data set. By comparing the amplitude of the real data set with the amplitude distribution of the generated data sets, we can estimate the probability of the appearance of observed amplitude in each test period. With this method we could remove the spurious effect (the gaps in the observations making the false periodicities), and succeed to obtain the chance probability. Figure 4 shows the obtained chance probability as a function of the test period. We can see prominent peak at 12.7 days with the chance probability of less than . This period corresponds to a half of the period obtained in the simple test mentioned above.
4 Discussion
We obtained the differential energy spectrum of the gamma rays from Mkn501. It shows a possible cutoff feature above 5-7 TeV. This cutoff is predicted to be caused by the interaction with the infrared photons or the the limit of the electron acceleration in the jet. The cutoff energy of the gamma rays due to the infrared photon interaction from the distance of the Mkn501, z=0.034 is estimated 7 TeV to 15 TeV by Stecker and DeJager (1997).
In the time variation of the gamma ray intensities, we found a periodicity, which may be a quasi periodic oscillation. The observed periodicity corresponds to 12.7 days or 25.5 days. The relationship of this periodicity with high energy phenomena around the massive black holes could be influenced by factors including the precession of the jet, and the rotation of the black hole(s). R. Protheroe (Protheroe et al., (1997)) suggested the interaction of the shock wave and the helical structure of the jet may cause this observed type of periodicity.
References
- Quinn et al. (1996) Quinn, J. et al. 1996, ApJ, 456, L83
- Bradbury et al. (1997) Bradbury, S.M. et al. 1997, A&A, 320, L5
- Punch et al. (1992) Punch, M. et al. 1992, Nature, 358, 477
- Petry et al., (1996) Petry, D. et al, 1996, A&A, 311, L13
- (5) Catanese, M. et al., 1997, astro-ph/9712325
- Shrader and Gehrels (1995) Shrader, C.R. and Gehrels, N., 1995, PASP, 107, 1
- (7) Aiso, S. et al. 1997a, Proc. 25th I.C.R.C.(Durban), 3, 261.
- Stecker and DeJager (1997) Stecker, F.W. and DeJager O.C., 1997, astro-ph/9710145
- (9) Catanese, M. et al., 1997, ApJ. 487, L143-L146
- Barrau et al., (1997) Barrau, A. et al., 1997, astro-ph/9710259
- Bhat (1997) Bhat, C.L. 1997, Private communication.
- (12) Aiso, S. et al. 1997b, Proc. 25th I.C.R.C. (Durban), 3, 177.
- (13) Aiso, S. et al. 1997c, Proc. 25th I.C.R.C. (Durban), 5, 373.
- Hillas (1985) Hillas, A.M. 1985, Proc. 19th I.C.R.C.(La Jolla), 3, 445.
- Protheroe et al., (1997) Protheroe, R. J. et al., 1997, astro-ph/9710118