Figure 1: The QSO J2233–606 flux calibrated spectrum
smoothed over 2 Å. Overplotted is the spectrum of the noise per
pixel. The emission lines correspond to the SiIV doublet (
Å), CIV doublet ( Å) and AlII+CIII] lines (
Å). Ticks indicate absorption lines identified in the
spectrum. The features around 6850 Å and 7600 Å are due to
atmospheric absorptions of water vapor.
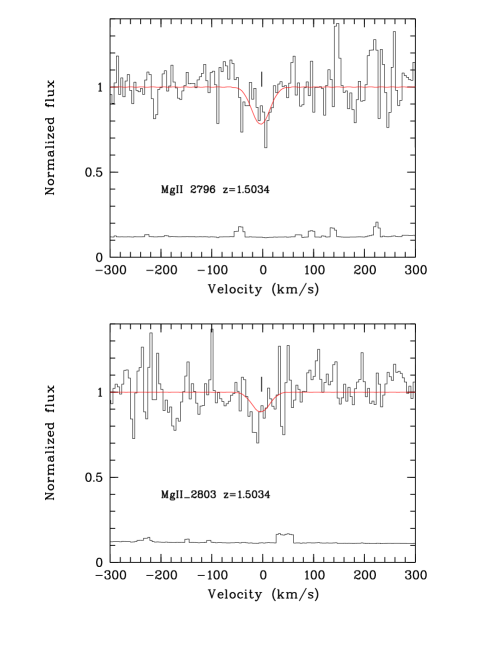
Figure 2: The MgII absorption of the metal system at
. The thin line is the result of the fit. Also shown is the
noise per pixel.
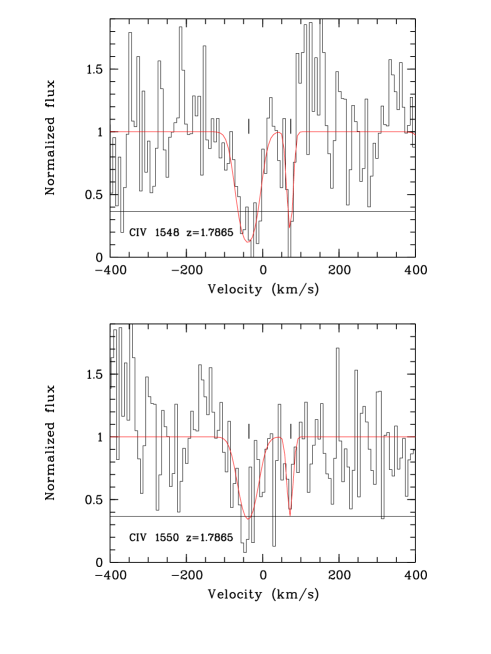
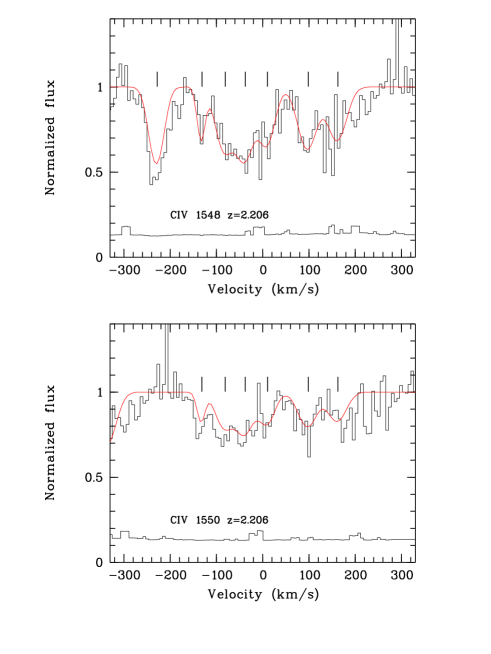
Figure 3: As in Fig. 2, but for the CIV
absorption of the metal system at .
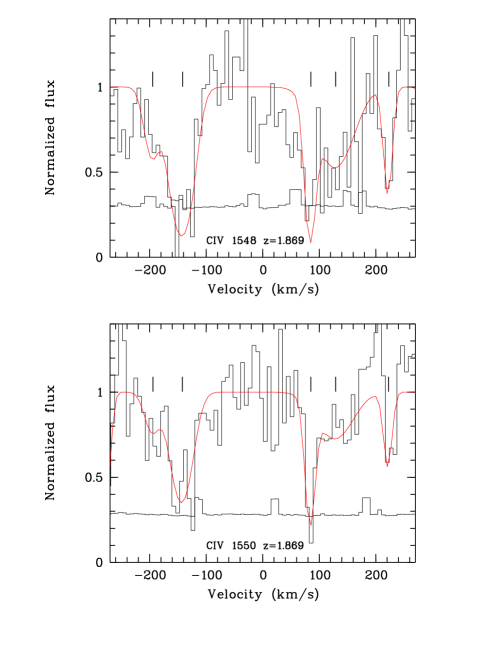
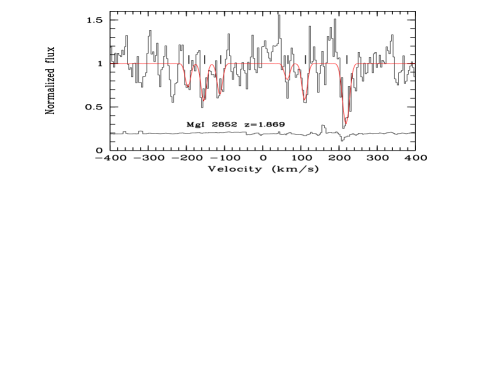
Figure 4: As in Fig. 2, but for the CIV and the
MgI absorption lines of the metal system at .
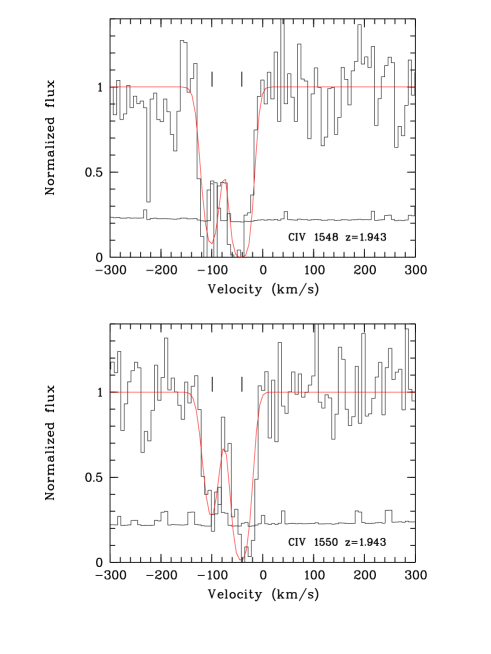
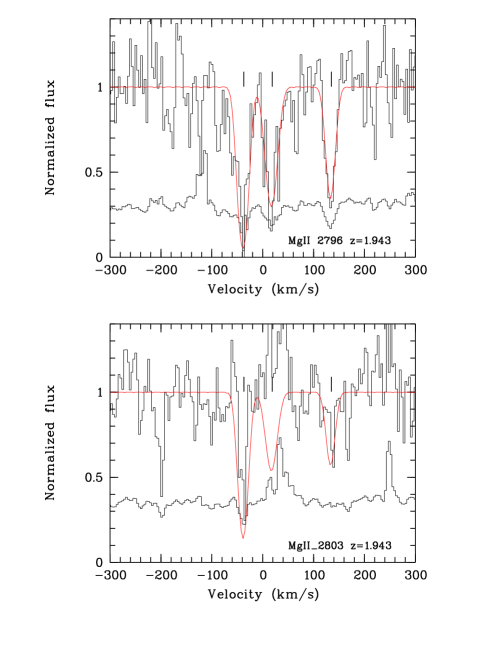
Figure 5: As in Fig. 2, but for the CIV and MgII
doublets of the metal system at .
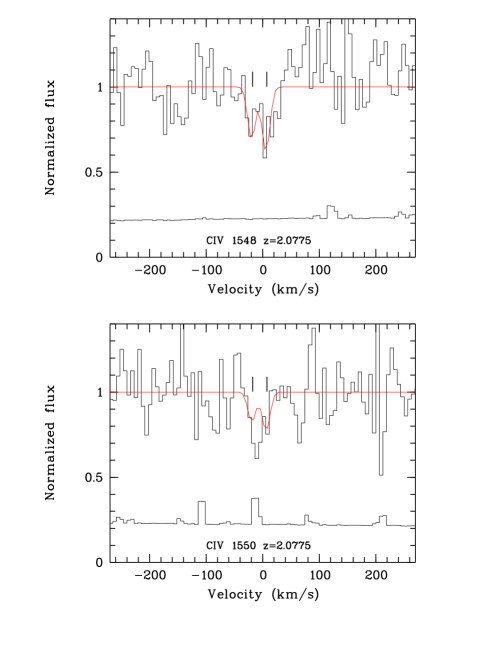
Figure 6: As in Fig. 2, but for
the CIV doublet of the metal system at .
Figure 7: The QSO CIV emission peak. Also shown is the
spectrum of the noise per pixel.
Figure 8: Column density ratios in associated
systems collected from the literature (Table 8).
The straight lines divide the area of non–detection in case of
observational limits for CIV, SiIV and NV of ,
and respectively.
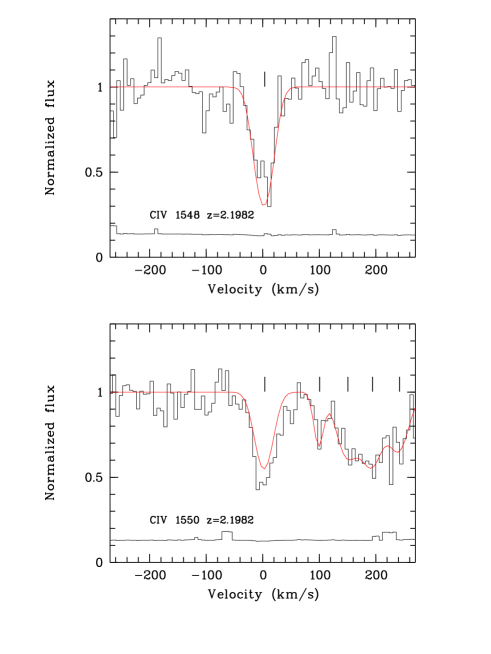
Figure 9: As in Fig. 2, but for the CIV complex
of the metal system at .
Figure 10: As in Fig. 2, but for the CIV complex
of the metal system at .
Figure 11: Physical and comoving distances as a function
of redshift corresponding to angular separations of 5.1 arcmin
(left vertical axis) and 2.7 arcmin (right vertical axis). The first
is the distance of J2233–606 from the HDFS center, the
second is the angular size of the HDFS. The shaded area indicates the
redshift range of the identified CIV systems in the QSO spectrum.