HST spatially-resolved spectra of the accretion disc and gas stream of the nova-like variable UX Ursae Majoris ††thanks: Based on observations with the NASA/ESA Hubble Space Telescope, obtained at the Space Telescope Science Institute, which is operated by the Association of Universities for Research in Astronomy, Inc., under NASA contract NAS 5-2655
Abstract
Time-resolved eclipse spectroscopy of the nova-like variable UX UMa obtained with the HST/FOS on 1994 August and November is analyzed with eclipse mapping techniques to produce spatially resolved spectra of its accretion disc and gas stream as a function of distance from disc centre.
The inner accretion disc is characterized by a blue continuum filled with absorption bands and lines which cross over to emission with increasing disc radius, similar to that reported by Rutten et al (1994) at optical wavelengths. The comparison of spatially resolved spectra at different azimuths reveals a significant asymmetry in the disc emission at UV wavelengths, with the disc side closest to the secondary star showing pronounced absorption by an ‘iron curtain’ and a Balmer jump in absorption. These results suggest the existence of an absorbing ring of cold gas whose density and/or vertical scale increase with disc radius. The spectrum of the infalling gas stream is noticeably different from the disc spectrum at the same radius suggesting that gas overflows through the impact point at disc rim and continues along the stream trajectory, producing distinct emission down to .
The spectrum of the uneclipsed light shows prominent emission lines of Ly, N V , Si IV , C IV , He II , and Mg II , and a UV continuum rising towards longer wavelengths. The Balmer jump appears clearly in emission indicating that the uneclipsed light has an important contribution from optically thin gas. The lines and optically thin continuum emission are most probably emitted in a vertically extended disc chromosphere + wind.
The radial temperature profiles of the continuum maps are well described by a steady-state disc model in the inner and intermediate disc regions (). There is evidence of an increase in the mass accretion rate from August to November (from Ṁ), in accordance with the observed increase in brightness. Since the UX UMa disc seems to be in a high mass accretion, high-viscosity regime in both epochs, this result suggests that the mass transfer rate of UX UMa varies substantially ( per cent) on time scales of a few months.
It is suggested that the reason for the discrepancies between the prediction of the standard disc model and observations is not an inadequate treatment of radiative transfer in the disc atmosphere, but rather the presence of additional important sources of light in the system besides the accretion disc (e.g., optically thin continuum emission from the disc wind and possible absorption by circumstellar cool gas).
keywords:
binaries: close – novae, cataclysmic variables – eclipses – stars: individual: (UX UMa)1 Introduction
Accretion discs are an important phenomenon in astrophysics, invoked to solve a wide range of astrophysical problems ranging from planetary formation to quasar energetics (Frank, King & Raine 1992). Although considerable effort in both observation and theory has been invested over the past decade, the structure and underlying physics of accretion discs remains poorly understood. Major unsolved problems include the nature of the viscosity mechanism – responsible for the spiraling inward of the disc material – (the angular momentum problem), the fate of the kinetic energy expended at the inner edge of the accretion disc (the boundary layer problem), the vertical structure of the disc (the Balmer decrement problem), and the outflow of matter in connection with a disc wind (possibly a solution to, or at least an element of, the boundary layer problem). Progresses in solving these issues has been hampered because most of the previous observational constraints provided only the spectrum of the total light from the disc. A better understanding of the physics of accretion discs requires spatially-resolved studies.
Cataclysmic Variables (CVs) are mass-exchanging binary systems containing a white dwarf and a late-type star (Warner 1995). If the white dwarf is not strongly magnetized ( G) an accretion disc is formed. Accretion discs in non-magnetic CVs cover a range of accretion rates and viscosity states. For example, dwarf novae undergo large outbursts ( mag, typical duration of 5-10 days) which reflects changes in the structure of the discs – from a cool, optically thin, low viscosity state to a hot, optically thick, high viscosity state – and which are usually parameterized as a large change in the mass accretion rate ( Ṁ. See, e.g. Pringle, Verbunt & Wade 1986). On the other hand, nova-like variables seem to be permanently in a high viscosity state, presumably as a result of the fact that the accretion rate is always high. Because the nature of the other constituents in these systems – the white dwarf and the normal star – are reasonably well understood, and because orbital variations often provide considerable insight into the system geometry, non-magnetic CVs are the ideal laboratories for understanding accretion discs. Eclipsing systems are particularly useful since the occultation of the accretion disc by the late-type star provides information about the disc’s spatial structure through the eclipse shape.
The eclipse mapping method (Horne 1985, 1993; Rutten, van Paradijs & Tinbergen 1992; Baptista & Steiner 1993) assembles the information contained in the eclipse shape into a map of the disc surface brightness distribution. When applied to time-resolved spectroscopy through eclipses this technique delivers the spectrum of the disc at any position on its surface. Information on the radial dependence of the temperature and vertical temperature gradients (for optically thick regions), or temperature, surface density and optical depth (where the disc is optically thin) can be obtained by comparing such spectra with the predictions of models of the vertical disc structure. The spatial structure of the emission-line regions over the disc can be similarly mapped from data of high spectral resolution. Furthermore, by studying the time-variations in the structure of accretion discs of dwarf novae undergoing outbursts it may be possible to uncover the nature of the (so far unknown) viscosity mechanism which drives accretion discs.
UX UMa is a well known, bright () eclipsing nova-like variable with an orbital period of 4.72 hr. Eclipse mapping in broad-bands (Horne 1983; Rutten et al. 1992) shows that its accretion disc is optically thick and is close to a steady state at a mass accretion rate of . The broad-band mapping was extended to spectrally-resolved mapping in the optical range by Rutten et al. (1993, 1994). Their results show that the continuum becomes fainter and redder with disc radius – reflecting a radial temperature gradient – and reveal that the Balmer lines are seen in absorption in the inner disc but in emission in the outer disc. Baptista et al. (1995) performed a similar study using HST data in narrow spectral windows about the C IV 1550 and He II 1640 line regions. This study showed that the UV continuum reasonably follows the law for steady mass accretion, confirming the results from the optical analysis. The C IV and He II line profiles are dominated by emission from the disc wind. Spatially-resolved spectra reveal that these lines appear as narrow absorption features at disc centre and change with increasing radius to broad emission in the outer disc regions besides showing large uneclipsed components. This behaviour is similar to that found for the Balmer lines and suggests that these optical lines may also have a wind component.
In this paper, we report on the ultraviolet (UV) and optical mapping of the accretion disc and gas stream of UX UMa, based on observations made with the Faint Object Spectrograph (FOS) on the Hubble Space Telescope (HST). The reader is referred to Knigge et al. (1998a) for an initial description of these observations, with emphasis on the spectral properties of the integrated spectra of the accretion disc, the bright spot and the uneclipsed light. Sect. 2 describes the data and its reduction. The extraction of narrow-band light curves and their analysis with eclipse mapping techniques are described in Sect. 3. Sect. 4 presents and discusses spatially resolved spectra of the accretion disc and the gas stream region as a function of distance from disc centre, the spectrum of the uneclipsed light, and the radial temperature distribution in the ultraviolet. The possible influence of the assumed eclipse geometry on the results is addressed in Sect. 5. Sect. 6 discusses the implications of the results in the context of disc atmosphere models. The results are summarized in Sect. 7.
2 Observations
Time-resolved low-resolution spectroscopy centred on eclipses of UX UMa was obtained with HST/FOS in the ‘rapid readout’ mode on 1994 August (G160L, Å, spectral resolution of Å pixel-1) and 1994 November (PRISM, Å, spectral resolution varying from 1 Å pixel-1 near the short wavelength end to more than 200 Å pixel-1 at the long wavelength end), at a time resolution of 5.3 s, in a total of 4 data sets and 3122 spectra. The nominal sampling of the FOS spectra was increased by a factor 2 by magnetically deflecting the light beam along the dispersion direction by 1/2 of the diode width in order to make the array of diodes sample a different set of wavelengths, and by repeating the process until the spectra has shifted by an integer number of diodes (a procedure called ‘sub-stepping’). The total exposure per pixel in each spectrum is 2.59 s. The G160L observations were taken with the square aperture to reduce the contribution of the geocoronal Ly emission, while the PRISM observations were obtained with a larger square aperture. The observations are summarized in Table 1.
| Run | Date | UT | Phase | Eclipse | No. of | Instrument | Scaling | |
|---|---|---|---|---|---|---|---|---|
| Start | End | range | cycle | spectra | factor | |||
| 1 | 1994 Aug 3 | 02:52:33 | 03:54:32 | 28793 | 691 | FOS/G160L | 1.00 | |
| 2 | 1994 Aug 3 | 07:43:06 | 08:45:05 | 28794 | 691 | FOS/G160L | 1.05 | |
| 3 | 1994 Nov 24 | 04:33:46 | 05:51:49 | 29368 | 870 | FOS/PRISM | 1.00 | |
| 4 | 1994 Nov 24 | 18:55:04 | 20:13:07 | 29371 | 870 | FOS/PRISM | 0.96 | |
The observations were reduced using procedures similar to the standard STSDAS pipeline, and included flat-field and geomagnetically induced motion (‘GIMP’) corrections, background and scattered light subtraction, wavelength and absolute flux calibrations. Further details of the reduction procedures are given in Knigge et al. (1998a).
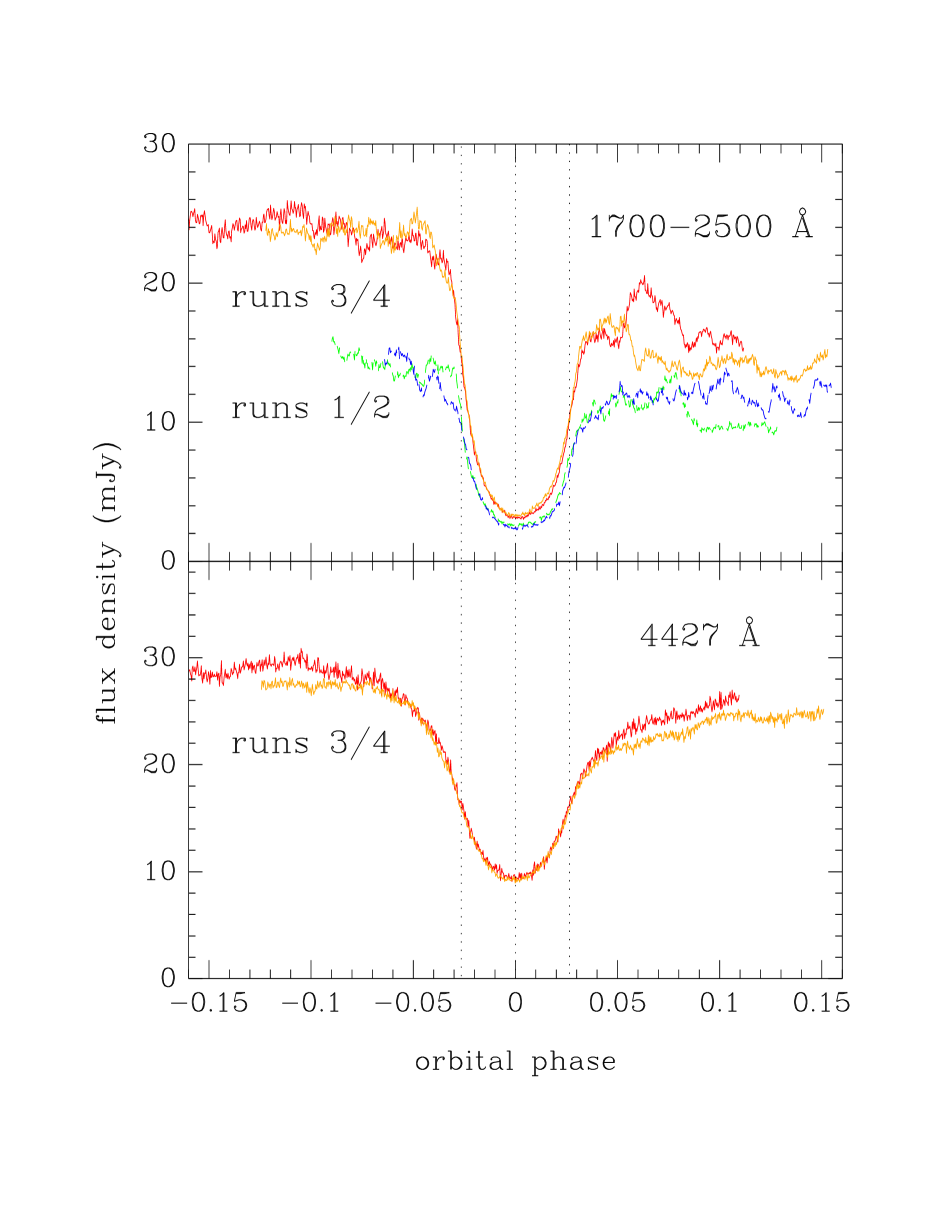
The top panel in Fig. 1 shows light curves of the four HST runs in the overlapping wavelength region (1700-2300 Å) while the lower panel shows the corresponding light curves for runs 3 and 4 in a narrow band in the optical. UX UMa was brighter on November than on August, by up to 70 per cent prior to eclipse. The November UV light curves show a pronounced decrease in flux level from before to after eclipse – interpreted by Knigge et al. (1998a) as due to anisotropic emission from the bright spot – which is not conspicuous in the optical range. The UV continuum light curves show significant flickering activity outside of eclipse, relatively much stronger than observed in the optical range. The UV eclipses are deep and asymmetric, showing an egress shoulder, however no clear evidence of a compact bright spot is seen. Quasi-periodic oscillations of period 25-30 s are easily seen in the November light curves. The analysis of these oscillations is the subject of a separate paper (Knigge et al. 1998b).
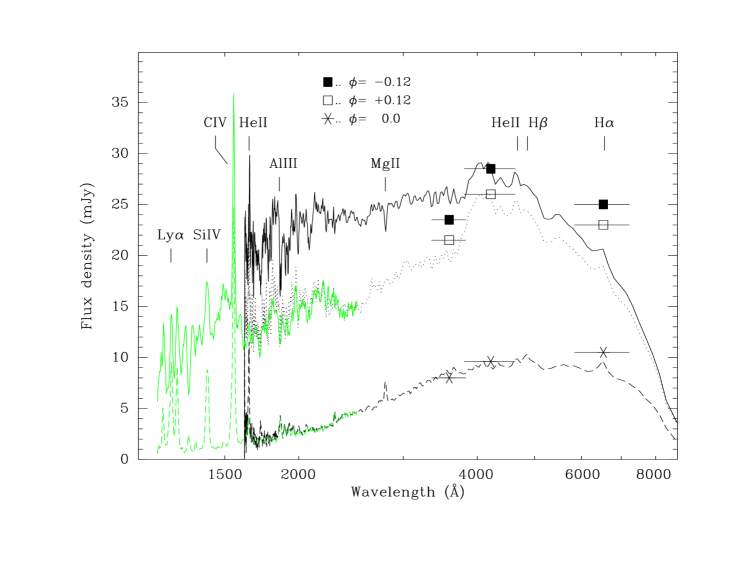
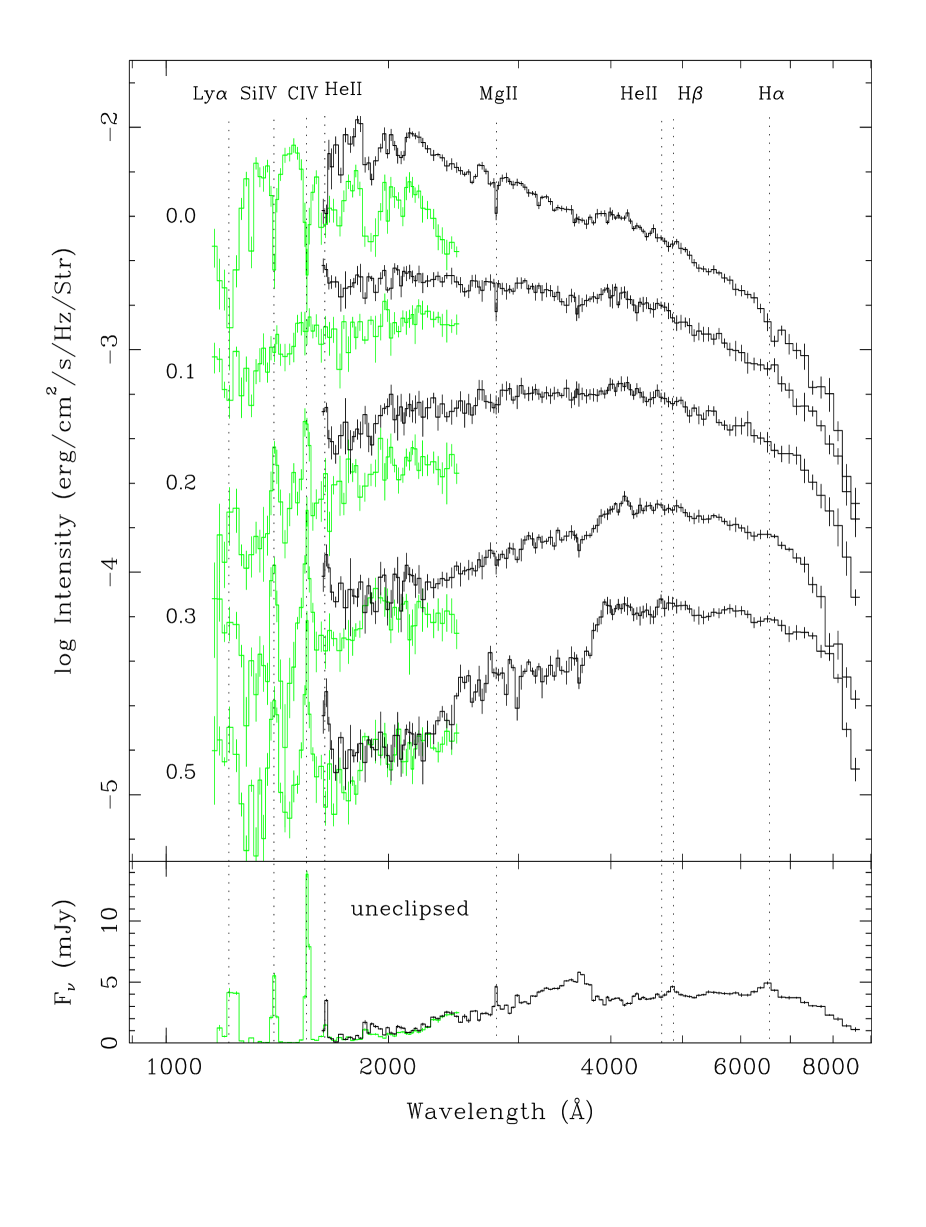
Figure 2 displays average spectra for the August (light gray) and November (black) data at selected phases. Average spectra prior to eclipse are shown as solid lines whereas average mid-eclipse spectra are shown as dashed lines. For the November data, an average spectra after eclipse is also shown as a dotted line.
The sharp decrease in flux at the red end of the November spectra is a distortion caused by an unsolved calibration problem affecting the PRISM data, most probably due to the combination, at these wavelengths, of a large and highly non linear dispersion with a sharp decrease in diode sensitivity. UBR photometry prior to eclipse, after eclipse and at mid-eclipse phases derived from the light curves of Horne (1983) are plotted in Fig. 2 for comparison. The fluxes of the PRISM spectra are consistent with the photometric measurements at U and B and are underestimated by per cent at R, the distortion increasing for longer wavelengths.
The comparison of the spectra prior to eclipse of the August and the November data underscores the observed differences in the brightness of UX UMa at these epochs. The November spectrum shows a substantially higher continuum level at the overlapping wavelength region, and the absorption features are more pronounced than in the August data. The He II line – hardly seen in the August spectrum – appears strongly in emission. Although the spectrum prior to eclipse of August is a reasonable match to the spectrum after eclipse of November, the He II line is considerably stronger in the later.
The UV out-of-eclipse spectrum shows prominent emission lines (C III , Ly, N V , Si IV , C IV ) as well as many absorption features and possibly broad absorption bands, particularly near 1900 Å and 2400 Å. At mid-eclipse the continuum flux is reduced by a factor , while the emission lines are much less deeply eclipsed and some of the lines that are seen in absorption in the out-of-eclipse spectra appear in emission (e.g., He II ).
The reader is referred to Knigge et al (1998a) for a detailed analysis of the integrated spectra of UX UMa.
3 Data analysis
3.1 Light curve construction
The calibrated spectra were divided into 59 (G160L) and 127 (PRISM) passbands of 15-30 Å wide in the ultraviolet continuum and km s-1 for the stronger UV emission lines. In the optical ( Å) each passband corresponds to a single pixel and therefore its width increases with wavelength from about 50 Å at 3600 Å to 230 Å at the longer wavelength end. For each passband a light curve was constructed by computing the average flux on the corresponding wavelength range and phase folding the resulting data according to the ephemeris of Baptista et al. (1995). A phase correction of cycles was further applied to the data to make the centre of the white dwarf eclipse coincident with phase zero. For those passbands including emission lines the light curves comprise the total flux at the corresponding bin with no subtraction of a possible continuum contribution.
Small differences in brightness between the runs of each epoch (at the level of per cent) were removed by scaling the light curves to a common absolute flux level outside eclipse with a wavelength independent factor, listed in Table 1. The light curves in Fig. 1 were scaled by these factors before plotting.
Average light curves were constructed for each passband by combining the individual light curves, dividing the data into phase bins of 0.002 cycles and computing the median for each bin. The median of the absolute deviations with respect to the median was taken as the corresponding uncertainty. Run 4 shows a pronounced flare centred on phase cycles at UV wavelengths (Fig. 1). The uncertainties around this phase were artificially increased to reduce the relative influence of the flare on the shape of the average light curves.
Out-of-eclipse brightness changes are not accounted for by the eclipse mapping method, which assumes that all variations in the eclipse light curve are due to the changing occultation of the emitting region by the secondary star. Orbital variations in the average profiles were therefore removed by fitting a spline function to the phases outside eclipse, dividing the light curve by the fitted spline, and scaling the result to the spline function value at phase zero. This procedure removes orbital variations outside eclipse with only minor effects on the eclipse shape itself.
3.2 Eclipse mapping
The eclipse mapping method was used to solve for a map of the disc brightness distribution and for the flux of an additional uneclipsed component in each passband. For the details of the method the reader is referred to Horne (1985, 1993), Baptista & Steiner (1993), Rutten et al. (1994) and Baptista, Steiner and Horne (1996).
For our eclipse map, we adopted a pixel grid centred on the primary star with side , where is the distance from the disc centre to the inner Lagrangian point. This choice provides maps with a nominal spatial resolution of . The eclipse geometry is specified by the mass ratio and the inclination . We adopted the parameters of Baptista et al. (1995), and . The specific intensities in the eclipse map were computed assuming R and a distance of 345 pc (Baptista et al. 1995).
4 Results
4.1 Disk structure
In this section we compare eclipse maps at selected passbands in order to study the structure of the accretion disc at different wavelengths as well as to assess changes in disc structure related to the significant increase in brightness level from the August to November observations.
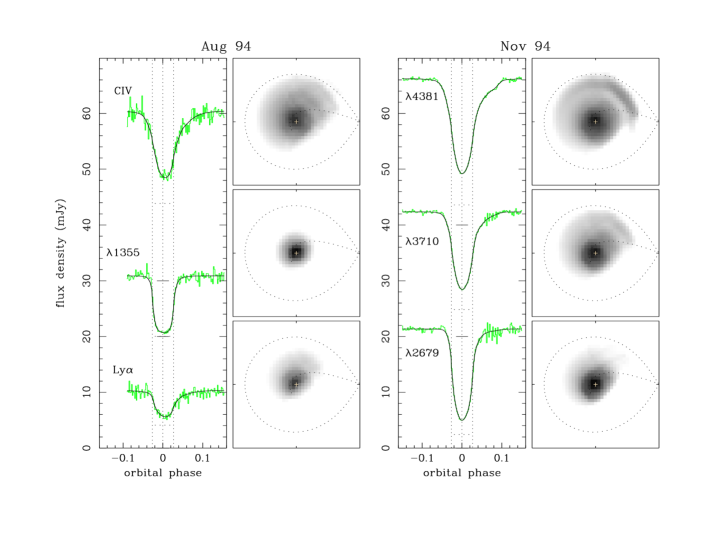
Figure 3 shows light curves and eclipse maps at selected passbands for the August and November data. The panel on the left compares the disc structure in Ly and the line centre of C IV with that of the adjacent continuum region at . We remark that the Ly and the C IV light curves include the total flux at the corresponding wavelength range, i.e., we have not subtracted an interpolated continuum. The differences are obvious. The eclipse in the continuum light curve is deep and symmetric about mid-eclipse, producing a symmetric brightness distribution sharply concentrated towards disc centre with no sign of a bright spot or enhancements in brightness along the gas stream trajectory. The accretion disc is small and fills only per cent of the primary lobe. The light curves of the emission lines show a shallow eclipse with a clear asymmetry in their egress side. This shape maps into a brightness distribution which is considerably flatter and more extended than that of the continuum and which displays a pronounced asymmetry in the trailing lune of the disc. These results reveal that the bright spot and gas stream region contributes a non-negligible fraction of the flux of these emission lines, in accordance with a suggestion made by Baptista et al. (1995).
The right panel of Fig. 3 compares light curves and eclipse maps of the November data at three continuum passbands. The light curves show asymmetric egress shoulders which are more pronounced and end at later phases for longer wavelengths. The corresponding eclipse maps show asymmetric structures in the trailing lune of the disc whose light centre is located at larger disc radii for longer wavelengths. This suggests that enhanced emission is produced along the gas stream trajectory downstream the bright spot position at disc edge, and that the light centre of this enhanced emission moves inward in radius for shorter wavelengths. We will further explore this possibility in section 4.5.
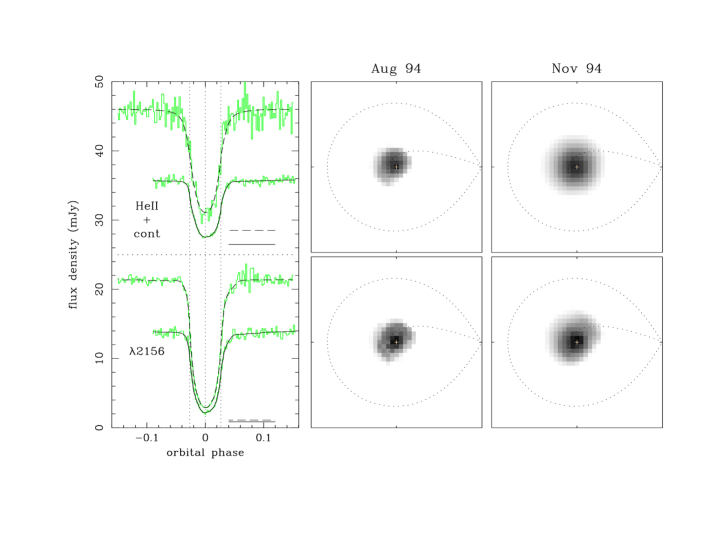
Figure 4 compares light curves and eclipse maps of the August and November data at the same two passbands, and is illustrative of the changes in disc structure caused by the increase in brightness level at the later epoch. As above, the He II light curve includes the total flux at the corresponding wavelength range, with no subtraction of an interpolated continuum contribution. The August maps of both the He II and the continuum at show a small disc with a weak asymmetry in its trailing lune at a position consistent with the location of the bright spot at the intersection of the gas stream trajectory with the disc edge. These maps are also asymmetric in the sense that the emission from the disc side farthest away from the inner Lagrangian point (hereafter referred as ‘the back side’ of the disc) is more pronounced than that of the side closest to the L1 point (hereafter referred as ‘the front side’ of the disc). The similarities of the brightness distribution at both passbands suggest that the emission at He II is dominated by contribution from the underlying continuum and, therefore, that little or no net He II line emission exists at this epoch. In November, the brightness distribution of the map at has increased in radius and the bright spot is clearly seen at a larger radial distance than in August. The brightness distribution at He II has evolved toward a symmetric and extended distribution significantly larger in radius than observed in August, with no evidence of a bright spot. The November He II distribution is probably dominated by light from the disc chromosphere + wind, whose emission seems very sensitive to the brightness level of the system, i.e., to the mass accretion rate (see section 4.3). This supports a previous suggestion made in this sense by Baptista et al. (1995).
4.2 Spatially-resolved disc spectra
Each of the eclipse maps yields spatially-resolved information about the emitting region on a specific wavelength range. By combining all narrow-band eclipse maps we are able to isolate the spectrum of the eclipsed region at any desired position (e.g., Rutten et al. 1993).
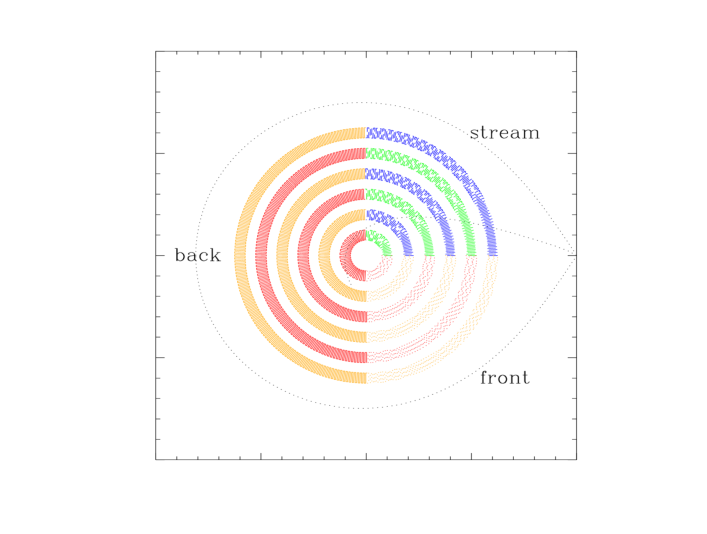
Motivated by the observed asymmetries in the disc emission discussed in Sect. 4.1 we separated the disc into three major azimuthal regions: the back side, the front side, and the region containing the gas stream trajectory. For each of these regions, we divided the maps into a set of 6 concentric annuli centred on the white dwarf of width and with radius increasing in steps of . The regions used to extract disc spectra are shown in Fig. 5. To evaluate the emission from the very centre of the disc, we also extracted spectra for a circle of width centred on the white dwarf, which includes the central pixel and its four closest neighbor pixels.
Each spectrum is obtained by averaging the intensity of all pixels inside the corresponding annulus. The statistical uncertainties affecting the average intensities were estimated with a Monte Carlo procedure (e.g., Rutten et al. 1992; Baptista et al. 1995). For a given narrow-band light curve a set of 10 artificial light curves is generated, in which the data points are independently and randomly varied according to a Gaussian distribution with standard deviation equal to the uncertainty at that point. These light curves are fitted with the eclipse mapping algorithm to produce a set of randomized eclipse maps. Average intensity values for each of the annular regions are then computed for all the randomized maps. The standard deviation of the average intensities of the randomized maps is taken as the corresponding uncertainty for each annulus. The procedure is repeated for all the narrow-band light curves.
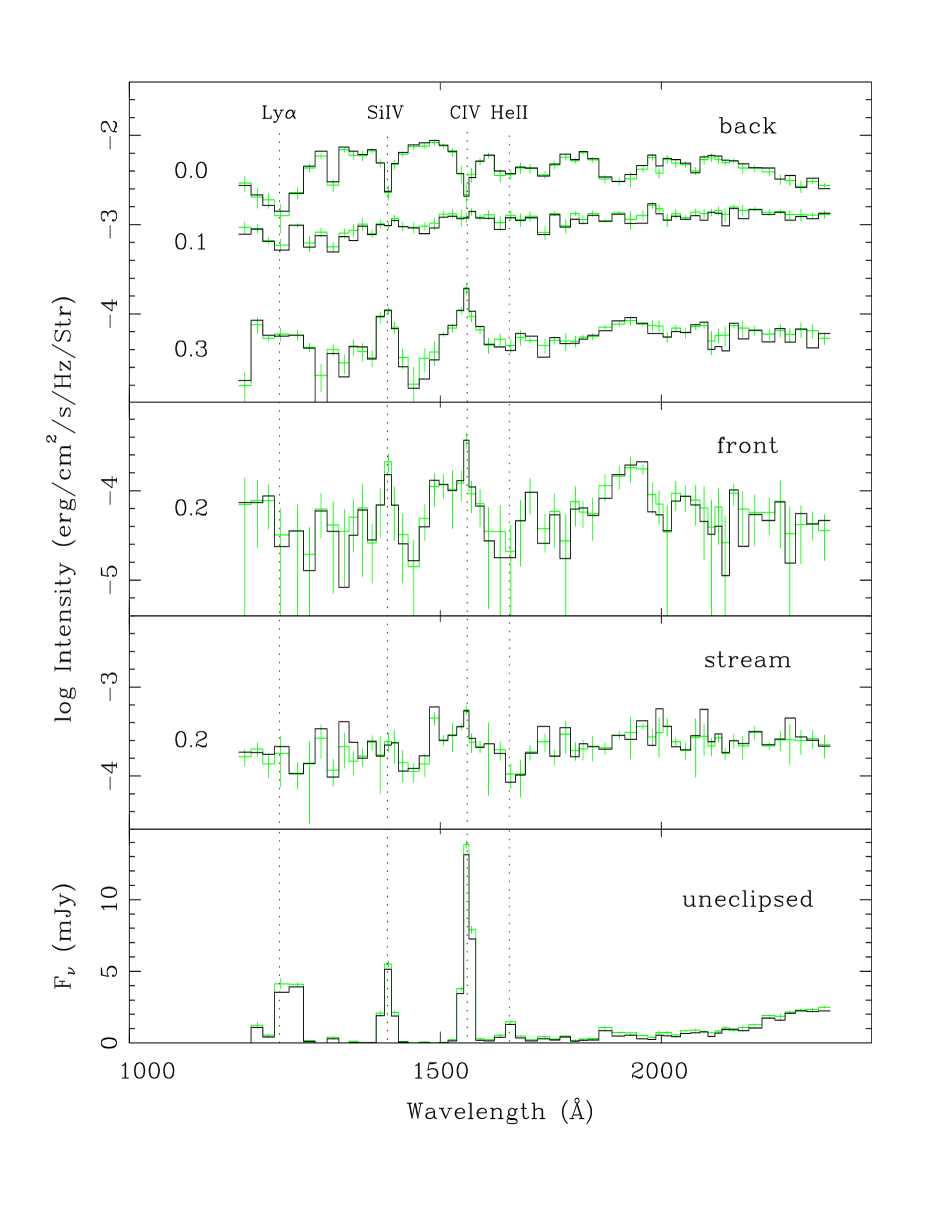
Spatially resolved spectra of the back side region for August and November are shown in Fig. 6. The lower panel shows the spectrum of the uneclipsed component. This will be discussed in detail in Sect. 4.6. The inner disc in the UV is characterized by a blue continuum filled with absorption lines and bands which cross over to emission with increasing disc radius, in accordance with the findings of Rutten et al. (1994) in the optical and Baptista et al. (1995) in the ultraviolet. The change in the slope of the continuum with increasing disc radius reflects the temperature gradient in the accretion disc, with the effective temperature decreasing outwards. The comparison of the 1994 Aug and Nov eclipse maps shows a significant ( per cent) increase in brightness at the later epoch, which is more pronounced at the inner disc region.
At disc centre, the Ly, Si IV and C IV lines show narrow absorption cores superposed on broad absorption wings. The He II line – which is barely seen in the August spectra – becomes conspicuous in the November spectra with a behaviour similar to the other strong UV lines. The Balmer jump appears weakly in absorption in the inner and intermediate disc and is seen strongly in absorption at large disc radii. Together with the deep absorption lines seen at the inner disc, this suggest that the accretion disc of UX UMa is everywhere optically thick.
4.3 Radial temperature profiles and changes in mass accretion rate
The simplest way of testing theoretical disc models is to convert the intensities in the eclipse maps to blackbody brightness temperatures, which can then be compared to the radial run of the effective temperature predicted by steady state, optically thick disc models. However, one should bear in mind that the brightness temperature is not a well defined physical quantity to be compared to the predictions of the standard disc theory, since the latter formulates the radial profile of the effective temperature, which measures the total energy dissipated in the disc per unit surface area. A relation between the effective temperature and a monochromatic brightness temperature is non-trivial, and can only be properly obtained by constructing self-consistent models of the vertical structure of the disc. Therefore, our analysis here is meant as preliminary, and should be complemented by detailed disc spectrum modeling in a future paper.
Radial brightness temperature profiles for August and November are plotted in a logarithmic scale in Fig. 7, for a passband centred at Å. Each temperature shown is the blackbody brightness temperature that reproduces the observed surface brightness at the corresponding pixel assuming a distance of 345 pc to UX UMa (Baptista et al. 1995). Steady-state disc models for mass accretion rates of and are plotted for comparison, respectively, as solid and dashed lines. These models assume M and (Baptista et al. 1995). The distribution and comparison curves for November were vertically displaced by 0.3 dex for a better visualization. Filled symbols depict the distribution of the back side of the disc, while open symbols corresponds to the distribution of the front side of the disc. The temperatures estimated from the front side are systematically lower than those of the back side, reflecting the fact that the back side has systematically higher fluxes than the front side. This may be due to absorption by cool gas at the disc rim or above the disc plane, the effect affecting preferably the emission from the front side of the disc. We will return to this point in Sect. 4.4. For the purpose of this section, we will only compare the radial temperature distributions of the back side of the disc.
Brightness temperatures range from K in the outer disc () to K near the white dwarf at disc centre () in the August map, and from K to K in the November map, in reasonable accordance with the previous results of Rutten et al. (1994) and Baptista et al. (1995). The radial temperature profiles of the continuum maps are in good agreement with the law expected for steady mass accretion in the inner and intermediate disc regions (). Comparison of continuum maps at different passbands show that in this region the radial temperature profiles are consistent within the uncertainties and can be well described by the same disc model. This underscores the conclusion that the inner and intermediate accretion disc in UX UMa consists of opaque thermal radiators and, therefore, that the brightness temperatures of the eclipse maps may be a good first approximation to the effective temperatures of the disc surface in this region. The brightness temperature profiles become flatter in the outer disc regions () yielding temperatures which are higher than predicted by the steady state disc model and which increase for shorter wavelengths 111Brightness temperatures at the blue and red end of the G160L and PRISM data for differ, respectively, by 15 and 25 per cent., showing that blackbody emission is not a good approximation to the spectra in the outer disc region. This effect is possibly connected with the absorption by cool gas in the outer disc, as will be discussed in section 4.4.
Mass accretion rates were estimated by computing the best fit steady state disc model in the range . The quoted uncertainty includes the uncertainty in the intensities of the individual pixels as computed with the Monte Carlo procedure (Sect. 4.2) and the dispersion of the data points about the best fit model for a set of continuum maps covering the spectral region for which the G160L and PRISM data overlaps ( Å). There is evidence of an increase in the mass accretion rate from August to November (from Ṁ, at the 95 per cent confidence level), in accordance with the observed increase in brightness. Since the UX UMa disc seems to be in a high mass accretion, high-viscosity regime in both epochs, this result suggests that the mass transfer rate of UX UMa varies by a substantial amount ( per cent) on time scales of a few months.
4.4 Front-back asymmetries in disc emission
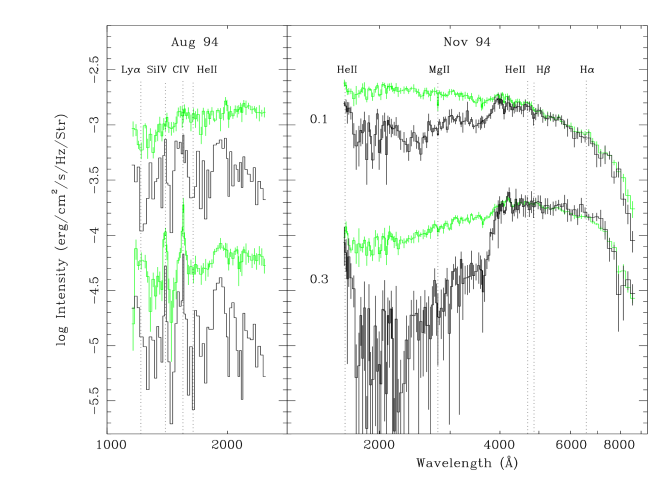
The comparison of the front and back side spectra at the same radius reveals a significant asymmetry in the disc emission at UV wavelengths, with the front side of the disc exhibiting a Balmer jump in absorption and pronounced UV absorption bands – probably due to a large number of blended lines of Fe II and other species – present both in the August and the November observations (Fig. 8). This effect is reminiscent of that observed previously in OY Car, where the white dwarf emission seems veiled by an ‘iron curtain’, and was attributed to absorption by cool circumstellar material, possibly in the outer disc (Horne et al. 1994). We remark that no asymmetry is observed at optical wavelengths, in accordance with the results of Rutten et al. (1994).
The spatially resolved spectra are helpful to constrain the location of the absorbing gas in UX UMa. The absorption features become more pronounced for increasing radius on the front side of the disc (Fig. 8), but can also be noted in the back side spectrum at large radii (Fig 6). They also affect the spectrum of the gas stream region (Fig 10), although to a lesser extent than in spectra of the front side region at similar radius. These results suggest the existence of an absorbing ring of cooler gas ( K) whose density and/or vertical scale increase with disc radius.
Other interpretations deserve comment. An alternative explanation of the observed asymmetry is to consider it the result of enhanced front side limb-darkening effects on a flared disc (e.g., Wade 1996; Robinson, Wade & Wood 1998, in preparation). If the disc has a non negligible opening angle, the emission from its front side would experience a stronger limb darkening effect due to its relatively higher viewing angle and would appear fainter regardless of wavelength. However, the facts that (1) no front-back asymmetry is observed in the optical and (2) the absorption by the iron curtain also affects the emission of the back side of the disc, argue against this interpretation. For this latter reason, possible self-obscuration of the front side by a vertically extended disc rim (as suggested by Smak, in Baptista 1997) is also not a satisfactory explanation.
Extensive modeling of the spatially resolved spectra is required in order to properly test these ideas and to provide further insight into the physical conditions of the UX UMa accretion disc and the possible absorbing ring. This is outside of the scope of the present paper and will be the subject of future work.
Knigge et al. (1998a) interpreted the noticeable decrease in flux level of the UV lightcurves from before to after eclipse as due to anisotropic emission from the bright spot. Here we give an alternative interpretation of this effect in terms of phase-dependent absorption by cool material which is stronger along the line of sight at egress phases. In this regard, the ratio of the pre- to post-eclipse spectrum yields a good diagnostic of how much absorption occurs at each wavelength. Fig. 9 supports this interpretation by showing that the ratio of the average post-eclipse () to pre-eclipse () spectra displays the same spectral features characteristic of absorption by the iron curtain seen in the spatially resolved spectra of Figs. 6 and 8, as well as in Horne et al. (1994). This interpretation is in line with the above remark that the absorption by the iron curtain in the disc side closest to the secondary star is more pronounced in the leading quadrant (seen along the line of sight to the inner disc at post-eclipse phases) than in the trailing quadrant (which contains the bright spot and gas stream and is seen along the line of sight to the inner disc at pre-eclipse phases). Stream impact on the outer edge of the disc (e.g., Hirose, Osaki & Mineshige 1991; Meglicki, Wickramasinghe & Bicknell 1993) or tidal effects of the secondary star (e.g., Spruit et al. 1987; Savonije et al. 1994) can lead to considerable thickening of the disc rim and could possibly account for the observed effect. Alternatively, the absorption may be produced by the material being blown away in the disc wind. In this case, it may be possible that collision of the gas stream with the wind ‘washes’ the absorbing gas out of the line of sight to the accretion disc at orbital phases just before eclipse. This would result (1) in a relatively smaller absorption effect in the trailing quadrant and (2) in phase-dependent absorption, which would be stronger after eclipse than before.
4.5 The gas stream
Figure 10 compares the spectra of the gas stream region with those of the front side of the disc for a set of annuli. For the annulus at 0.1 , the spectrum of the back side of the disc is also shown as a dashed gray line. It is seen that the emission produced in the region containing the gas stream trajectory is different from the emission of both the front and the back side of the disc. The gas stream gives a non-negligible contribution to the C IV emission, particularly at low (Doppler) velocities, which confirms a previous suggestion by Baptista et al. (1995).
To gain further insight into the emission properties of this azimuthal region, we computed the difference between the spectrum of the stream and that of the front side of the disc as a function of disc radius. This is shown in Figure 11. The spectrum of the gas stream is noticeably different from the disc spectrum at the same radius for a range of radii. The spectrum of the difference becomes progressively bluer with decreasing disc radius. This suggest that gas overflows through the impact point at disc rim and continues along the stream trajectory, producing distinct emission down to . This effect was not seen in the previous optical mapping experiment (Rutten et al. 1994) because the distinct gas stream emission reveals itself mainly in the ultraviolet region.
4.6 The spectrum of the uneclipsed light
The spectrum of the uneclipsed light (Fig 6) shows prominent emission lines of Ly, N V , Si IV , C IV , He II , and Mg II superposed on a ultraviolet continuum which rises from 0.5 to 5.0 mJy between 1600 and 3600 Å and shows a roughly constant level of mJy in the optical region. The Balmer jump appears clearly in emission indicating that the uneclipsed light has an important contribution from optically thin gas. H and H are also seen in emission. These latter lines may be stronger than they appear since their flux is diluted into the adjacent continuum due to the large passbands of our data in the optical range.
The fractional contribution of the uneclipsed component to the UV continuum emission increases towards longer wavelengths, reaching per cent of the total light at 3600 Å. The uneclipsed light at Ly, N V, C IV and Si IV is even more significant, reaching about 40% of the total light. A substantial fraction of the light at these lines does not arise from the orbital plane and is not occulted during eclipse. The contribution of the uneclipsed light to the total light at He II is smaller, at the level of 15%. These results are in accordance with the findings of Baptista et al. (1995) and support the scenario in which these lines originate in a vertically extended disc chromosphere + wind, with the He II emission being more concentrated towards the orbital plane. Optically thin emission from this extended region is probably responsible for the Balmer jump (and lines) in emission observed in the uneclipsed spectrum. Support in favor of this argument comes from the recent detailed modeling of the C IV wind line of eclipsing nova-likes by Schlosman, Vitello & Mauche (1996) and Knigge & Drew (1997). Their results suggest the existence of a relatively dense ( cm-3) and vertically extended chromosphere between the disk surface and the fast-moving parts of the wind, which could produce significant amounts of optically thin emission.
An intriguing feature of the spectrum at mid-eclipse (Fig. 2) is that it shows almost no evidence of a Balmer jump. This can be explained as the result of optically thin emission from the uneclipsed disc chromosphere + wind filling in the Balmer jump produced by the optically thick outer disc which remains visible at these phases.
The comparison of the uneclipsed spectrum of the G160L and PRISM data reveals that, despite the substantial change in brightness from the August to the November observations, the uneclipsed continuum light remained at roughly the same flux level in the overlapping region Å. Thus, the uneclipsed, optically thin continuum emission seems quite insensitive to changes in mass accretion rate. On the other hand, the He II emission has increased by a factor , in accordance with the relative change in brightness observed at the inner disc. This may be an indication that the He II emission is connected with the energy release at the inner disc regions. Baptista et al. (1995) remarked that the strength of the UV emission lines seems correlated with the brightness level in UX UMa. Assuming that these UV lines are produced in a disc wind, they suggested that the amount of matter ejected in the wind (and thus the strength of the emitted lines) is quite sensitive to small fluctuations in the mass transfer rate (see also Livio 1996). The observed correlation between the mass accretion rate and the He II emission is in line with their findings and supports their suggestion.
5 The influence of the assumed geometry on the results
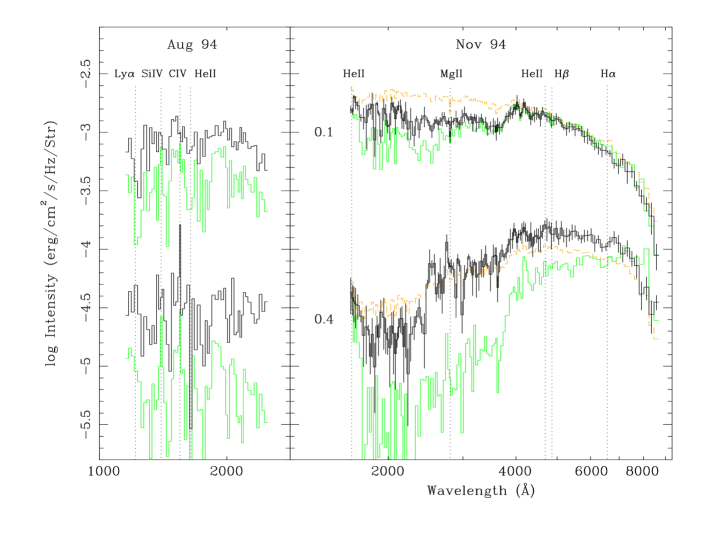
To gauge the sensitivity of the results to the adopted binary parameters, we produced eclipse maps using the geometry and , which corresponds to the lower limit at the 3– level of the nominal solution of Baptista et al. (1995), and computed spatially-resolved spectra for the same regions and set of annuli as before. Figure 12 compares the disc and the uneclipsed component spectra at selected radii for reconstructions obtained assuming a mass ratio of with those obtained with . There are no systematic differences with wavelength or disc radius and the observed differences are of the order of the uncertainties at the 1– level. We therefore conclude that the results obtained in the previous sections are reliable and do not depend on possible (systematic) uncertainties affecting the mass ratio of UX UMa.
6 Discussion
Knigge et al. (1998a) show that disc models constructed as ensembles of stellar atmospheres provide poor descriptions of the observed integrated spectrum of UX UMa. The disc model spectra are too blue at ultraviolet wavelengths and overpredict the magnitude of the Balmer jump. These problems are not new. The difficulties in fitting integrated spectra of nova-likes and dwarf nova in outburst with disc model spectra have a long history (e.g., Wade 1984, 1988; La Dous 1989; Long et al. 1991, 1994; Knigge et al. 1997). In discussing possible explanations for these problems, Knigge et al. (1998a) postulated the presence of a significant amount of optically thin material in the system in order to reconcile the disc models with the observed spectrum.
Our spatially resolved study confirms their suggestion by revealing that the integrated spectrum of UX UMa has indeed a substantial contribution from optically thin emission, most probably associated to the uneclipsed parts of the disc chromosphere + wind. A calculation by Knigge et al. (1998a) indicated that the addition of an optically thin component with K, , and vertical extension cm would be enough to bring the combined disc model plus optically thin emission into good agreement with the observed PRISM spectrum. The predicted fluxes of their optically thin component raises from mJy at 2000 Å to mJy at 3600 Å, being at the level of mJy at 4500 Å – in good accordance with the fluxes of the uneclipsed component in Fig. 6. For this case, their inferred mass accretion rate is or , in excellent agreement with our result.
Thus, the reason for the discrepancies between the prediction of the standard disc model and observations is not an inadequate treatment of radiative transfer in the disc atmosphere (or standard models of vertical structure), but rather the presence of additional important sources of light in the system besides the accretion disc (e.g., optically thin continuum emission from the disc wind and possible absorption by circumstellar cool gas). Following the same line of reasoning, if disc winds are a common characteristic of all non-magnetic, high state cataclysmic variables, one might expect their disc chromospheres to contribute a non-negligible amount of optically thin emission to the total light of the system. Under this hypothesis, the discrepancy between disc models and the integrated spectrum observed in other non-magnetic, high state systems may be removed by the inclusion of a proper optically thin component to their total light.
These results underscore the importance of spatially resolved studies in disentangling the different components of the integrated spectra of cataclysmic variables. In this particular case, it helped to clarify the situation regarding the apparent discrepancy between disc atmospheres models and the observed spectra.
7 Conclusions
We used time-resolved spectroscopy obtained with the HST/FOS to study the structure and the spectra of the accretion disc and gas stream of the nova-like UX UMa in the UV and optical ranges. The main results of this analysis can be summarized as follows:
-
•
The inner accretion disc of UX UMa is characterized by a blue continuum filled with absorption bands and lines, which cross over to emission with increasing disc radius. The Balmer jump appears clearly in absorption at intermediate and large disc radii. Together with the deep absorption lines seen at the inner disc, this suggests that the accretion disc is everywhere optically thick.
-
•
The comparison of the front and back side spectra at the same radius reveals a significant asymmetry in the disc emission at UV wavelengths which is not seen in the optical. The disc side closest to the secondary star shows Balmer jump in absorption and pronounced absorption by the iron curtain. These results suggest the existence of an absorbing ring of cold gas whose density and/or vertical scale increase with disc radius. The substantial reduction in flux level from before to after eclipse observed in the ultraviolet lightcurves may be the result of phase dependent absorption by the thick, cool ring.
-
•
Spatially resolved spectra of the azimuthal region containing the gas stream suggest that gas overflows through the impact point at disc rim and continues along the stream trajectory, producing distinct emission down to . The distinct stream emission is only seen at UV wavelengths for .
-
•
The spectrum of the uneclipsed light shows prominent emission lines of Ly, N V , Si IV , C IV , He II , and Mg II , and a UV continuum rising towards longer wavelengths. The Balmer jump appears clearly in emission indicating that the uneclipsed light has an important contribution from optically thin gas. The lines and the optically thin continuum emission are most probably emitted in a vertically extended disc chromosphere + wind.
-
•
The uneclipsed He II emission varies in accordance with the increase in brightness from August to November while the UV optically thin continuum emission seems insensitive to changes in the mass accretion rate.
-
•
The radial temperature profiles of the continuum maps are reasonably well described by a steady-state disc model in the inner and intermediate disc regions. There is evidence of an increase in the mass accretion rate from August to November (from Ṁ), in accordance with the observed increase in brightness. Since the UX UMa disc seems to be in a high mass accretion, high-viscosity regime in both epochs, this result suggests that the mass transfer rate of UX UMa varies by a substantial amount ( per cent) on time scales of a few months.
-
•
The reason for the discrepancies between the prediction of the standard disc model and observations is not an inadequate treatment of radiative transfer in the disc atmosphere, but rather the presence of additional important sources of light in the system besides the accretion disc (e.g., optically thin continuum emission from the disc wind and possible absorption by circumstellar cool gas).
Future work includes fitting disc atmosphere models to the spatially resolved spectra to derive the distribution of the physical parameters of the accretion disc – its temperature, surface density, Mach number, optical depth, and vertical temperature gradient. We expect this analysis to provide useful constraints on current disc atmosphere models and that this will give new insights into the understanding of accretion discs.
Acknowledgments
The spatially resolved spectra of UX UMa are available in electronic ascii format upon request to bap@fsc.ufsc.br. This work was partially supported by NASA grant GO-5488 from the STScI (which is operated by AURA under NASA contract NAS 5-26555) and by CNPq/Brazil research grant no. 300 354/96-7. In addition, RAW acknowledges financial support from NASA through grant NAG5-3459 and from STScI through grant GO-3683.03, both to the Pennsylvania State University. We would also like to thank Chris Mauche for his contribution to this project.
References
- [1] Baptista R., 1997, in Proceedings of IAU Colloquium 163: Accretion Phenomena and Related Outflows, eds. D. T. Wickramasinghe, G. V. Bicknell and L. Ferrario, ASP Conference Series 121, p. 453
- [2] Baptista R., Horne K., Hilditch R., Mason K. O., Drew J. E., 1995, ApJ, 448, 395
- [3] Baptista R., Steiner J. E., 1993, A&A, 277, 331
- [4] Baptista R., Steiner J. E., Horne K., 1996, MNRAS, 282, 99
- [5] Frank J., King A. R., Raine D. J., 1992, Accretion Power in Astrophysics - 2nd edition, Cambridge University Press, Cambridge, UK
- [6] Hirose M., Osaki Y., Mineshige S., 1991, PASJ, 43, 809
- [7] Horne K., 1983, PhD Thesis, CalTech
- [8] Horne K., 1985, MNRAS, 213, 129
- [9] Horne K., 1993, in Accretion Disks in Compact Stellar Systems, ed. J. C. Wheeler, World Scientific Publ. Co., p. 117
- [10] Horne K., Marsh T.R., Cheng F.-H., Hubeny I., Lanz T. 1994, ApJ, 426, 294
- [11] Knigge C., Drew J. E., 1997, ApJ, in press
- [12] Knigge C., Long K. S., Blair W. P., Wade R. A., 1997, ApJ, 476, 291
- [13] Knigge C., Long K. S., Wade R. A., Baptista R., Horne K., Hubeny I., Rutten R. G. M., 1998a, ApJ, in press
- [14] Knigge C., Drake N., Long K. S., Wade R. A., Horne K., Baptista R., 1998b, ApJ, in press
- [15] La Dous C., 1989, A&A, 211, 131
- [16] Livio M., 1996, in Proceedings of IAU Colloquium 163: Accretion Phenomena and Related Outflows, eds. D. T. Wickramasinghe, G. V. Bicknell and L. Ferrario, ASP Conference Series 121, p. 845
- [17] Long K. S., et al., 1991, ApJ, 381, L25
- [18] Long K. S., Wade R. A., Blair W. P., Davidsen A. F., Hubeny I., 1994, ApJ, 426, 704
- [19] Meglicki Z., Wickramasinghe D., Bicknell G. V., 1993, MNRAS, 264, 691
- [20] Pringle J. E., Verbunt F., Wade R. A., 1986, MNRAS, 221, 169
- [21] Rutten R. G. M., van Paradijs J., Tinbergen J., 1992, A&A, 260, 213
- [22] Rutten R. G. M., Dhillon V. S., Horne K., Kuulkers E., van Paradijs J., 1993, Nature, 362, 518
- [23] Rutten R. G. M., Dhillon V. S., Horne K., Kuulkers E,. 1994, A&A, 283, 441
- [24] Savonije G. J., Papaloizou J. C. B., Lin D. N. C., 1994, MNRAS, 268, 13
- [25] Schlosman I., Vitello, P. A. J., Mauche C. W., 1996, ApJ, 461, 377
- [26] Spruit H. C., Matsuda T., Inohue M., Sawada K., 1987, MNRAS, 229, 517
- [27] Wade R. A., 1984, MNRAS, 208, 381
- [28] Wade R. A., 1996, in Cataclysmic Variables and Related Objects, eds. A. Evans and J. E. Wood, Kluwer, Dordrecht, p. 119
- [29] Wade R. A., 1988, ApJ, 335, 394
- [30] Warner B., 1995, Cataclysmic Variable Stars, Cambridge University Press, Cambridge, UK