The Evolved Red Stellar Contents of the Sculptor Group Galaxies NGC55, NGC300, and NGC7793
Abstract
Deep and images are used to probe the evolved stellar contents in the central regions of the Sculptor group galaxies NGC55, NGC300, and NGC7793. The brightest stars are massive red supergiants (RSGs) with . The peak RSG brightness is constant to within mag in , suggesting that NGC55, NGC300, and NGC7793 are at comparable distances. Comparisons with bright RSGs in the Magellanic Clouds indicate that the difference in distance modulus with respect to the LMC is . A rich population of asymptotic giant branch (AGB) stars, which isochrones indicate have ages between 0.1 and 10 Gyr, dominates the color-magnitude diagram (CMD) of each galaxy. The detection of significant numbers of AGB stars with ages near 10 Gyr indicates that the disks of these galaxies contain an underlying old population. The CMDs and luminosity functions reveal significant galaxy-to-galaxy variations in stellar content. Star-forming activity in the central arcmin of NGC300 has been suppressed for the past Gyr with respect to disk fields at larger radii. Nevertheless, comparisons between fields within each galaxy indicate that star-forming activity during intermediate epochs was coherent on spatial scales of a kpc or more. A large cluster of stars, which isochrones suggest has an age near 100 Myr, is seen in one of the NGC55 fields. The luminosity function of the brightest stars in this cluster is flat, as expected if a linear luminosity-core mass relation is present.
1 INTRODUCTION
Recent studies of the structural characteristics of spiral galaxies suggest that the disk and spheroid do not evolve in isolation, but interact throughout the lifetime of a galaxy (e.g. Andredakis, Peletier, & Balcells 1995). The observational signatures of these interactions are readily apparent in late-type spiral galaxies. For example, Courteau, de Jong, & Broeils (1996) find a scale-free Hubble sequence among late-type spirals, a result which could be explained if the central light concentrations 111 The presence of a traditional bulge in late-type spirals galaxies has been challenged by Bothun (1992) and Regan & Vogt (1994), who concluded that the ‘bulge’ in M33 is actually the central extension of the halo. However, Minniti, Olszewski, & Rieke (1993) and Mighell & Rich (1995) resolved the innermost regions of M33 into stars, and detected a significant intermediate age population. Minniti et al. (1993) argue that, on the basis of stellar content alone, M33 contains a central component that is distinct from the halo. Given this debate, in the current paper the term ‘central light concentration’ is used to refer to what has traditionally been called the ‘bulge’ in late-type spirals. formed after disks. WFPC1 images discussed by Phillips et al. (1996) reveal that the central light concentrations of late-type spirals are structurally distinct from the bulges of early-type spirals, suggesting differences in evolutionary histories.
Surveys of the bright stellar content in nearby galaxies provide a direct means of studying the evolution of their central regions. Photometric studies of first ascent and asymptotic giant branch (AGB) populations are of particular interest, as these stars probe evolution during early and intermediate epochs, when the basic properties of the disk and spheroid were being imprinted. While efforts to resolve the central light concentrations of these systems into stars require near-diffraction limited image quality to overcome crowding, the inner disks of many nearby systems can easily be resolved into stars from the ground. Although the Local Group contains the closest, most obvious objects for stellar content surveys, the number of targets is limited to three morphologically diverse spiral galaxies: the Milky-Way, M31, and M33. This limited sample makes it necessary to study more distant systems and, as the nearest collection of galaxies outside the Local Group, the Sculptor Group offers a number of lucrative targets that can be resolved from the ground.
In the current paper, deep , and images are used to investigate the photometric properties of cool stars in the inner disks of the Sculptor galaxies NGC55, NGC300, and NGC7793. The morphological types and integrated brightnesses of these galaxies, as assigned by Sandage & Tammann (1987), are summarized in Table 1. Throughout this study it is assumed that these galaxies are equidistant with , as derived for NGC300 by van den Bergh (1992) from a number of different standard candles. The Galactic reddening towards these galaxies is negligible (Burstein & Heiles 1984).
There are a number of advantages to conducting photometric surveys of luminous, cool evolved stars at wavelengths longward of m. Not only is the contrast between bright cool stars and fainter unresolved objects in the disk enhanced at infrared wavelengths, but it is also possible to overcome the effects of line blanketing, which can affect the spectral energy distributions of moderately metal-rich giants at optical wavelengths (e.g. Bica, Barbuy, & Ortolani 1991), and complicate efforts to derive bolometric corrections. In addition, near-infrared two-color diagrams can also be used to identify foreground stars, contamination from which may be significant at faint visible magnitudes.
NGC55 and NGC300 have been the targets of earlier photometric investigations. Deep broad- and narrow-band surveys of NGC55 (Pritchet et al. 1987) and NGC300 (Richer, Pritchet, & Crabtree 1985; Zijlstra, Minniti, & Brewer 1996) have revealed that the outer disks of these galaxies contain rich AGB populations. A comparison of the AGB luminosity functions suggests that the star-forming histories of NGC55 and NGC300 during intermediate epochs were similar, but not identical (Pritchet et al. 1987). Freedman (1984) and Pierre & Azzopardi (1988) used and photometry to survey the bright young stellar content of NGC300, while Kiszhurno-Kozrey (1988) used CCD observations to construct CMDs of two fields in NGC55. There is no published photometric study of the stellar content of NGC7793, although Catanzarite et al. (1995) report the discovery of Cepheids in this galaxy. The only published infrared survey of these galaxies was carried out by Humphreys & Graham (1986), who obtained aperture measurements of red supergiant (RSG) candidates in NGC300. Spectroscopy revealed that almost half of the candidate objects were cool Galactic main sequence stars.
The paper is structured as follows. The observations, reduction techniques, and methods used to measure stellar brightnesses are discussed in §2. The luminosity functions (LFs), two-color diagrams (TCDs), and color-magnitude diagrams (CMDs) derived from these data are presented and compared in §3. In §4 the data are used to search for radial population gradients in NGC300 and NGC7793. A summary of the results follows in §5.
2 OBSERVATIONS, REDUCTIONS, AND PHOTOMETRIC MEASUREMENTS
The data were recorded at the Cassegrain focus of the CTIO 1.5 metre telescope during the nights of UT July 19 – 23 1996 using CIRIM – the facility near-infrared camera. Each pixel on the Hg:Cd:Te array subtended 0.6 arcsec on a side, so that the total imaged field was arcmin. A complete observing sequence consisted of three co-added 60 sec integrations per filter recorded at four dither positions, defining a arcsec square on the sky. This sequence was repeated up to five times for each field to improve the signal-to-noise ratio. While the central regions of the galaxies were the primary targets for this program, fields at intermediate radii were also observed in NGC55 and NGC300. Additional details of the observations, including the locations of field centers, are listed in Table 2.
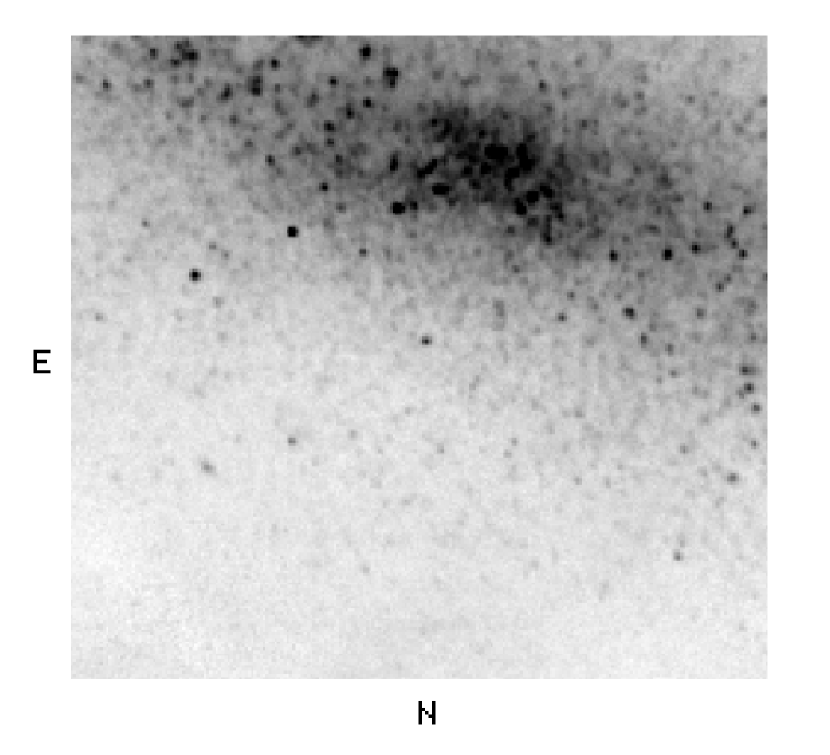
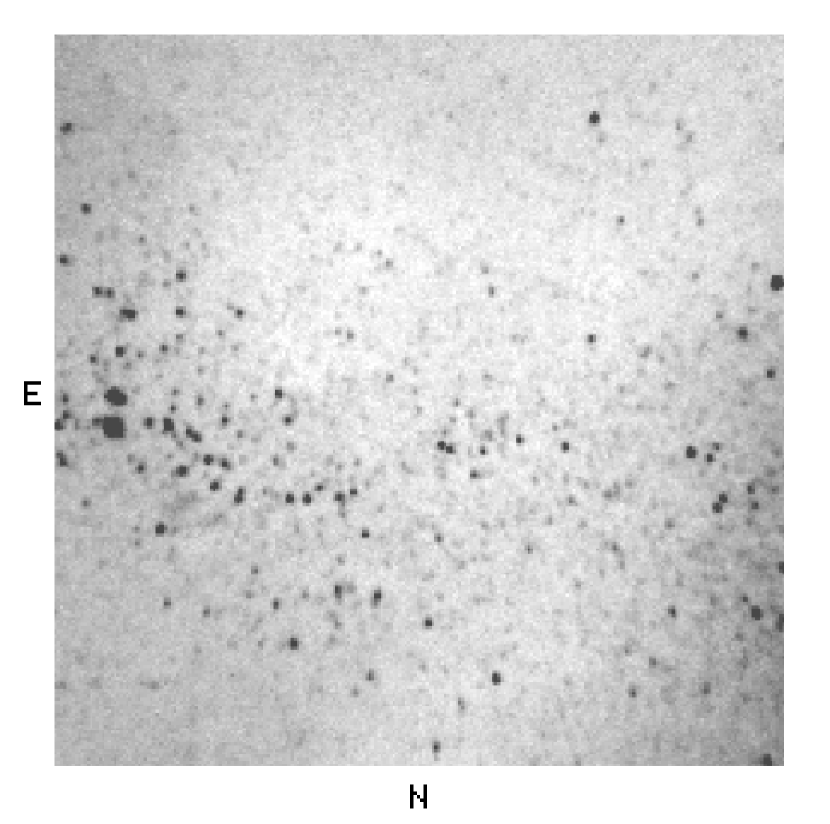
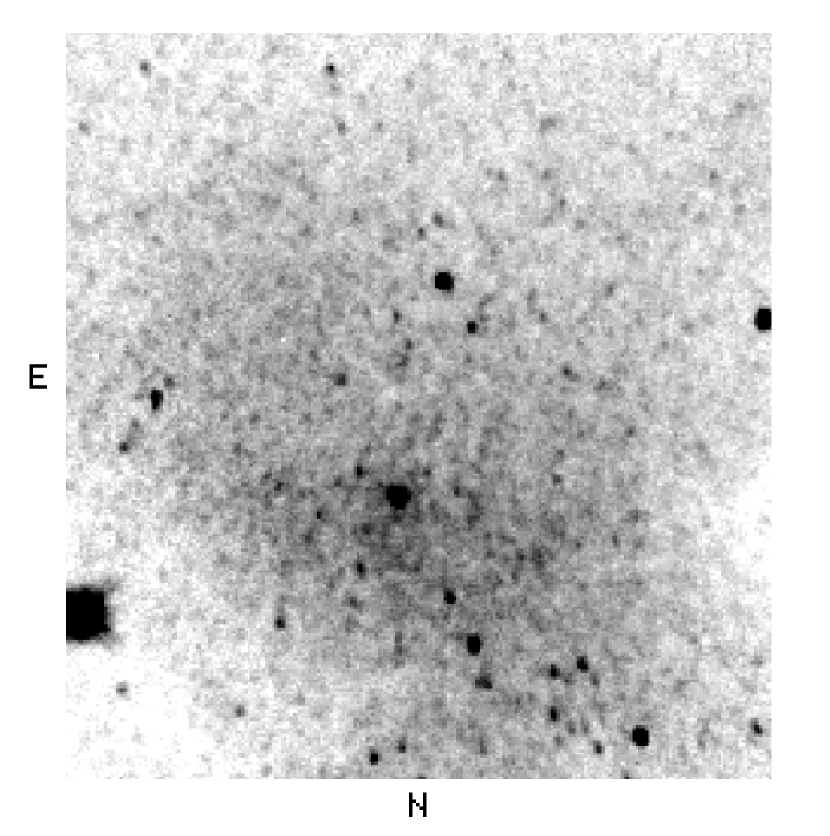
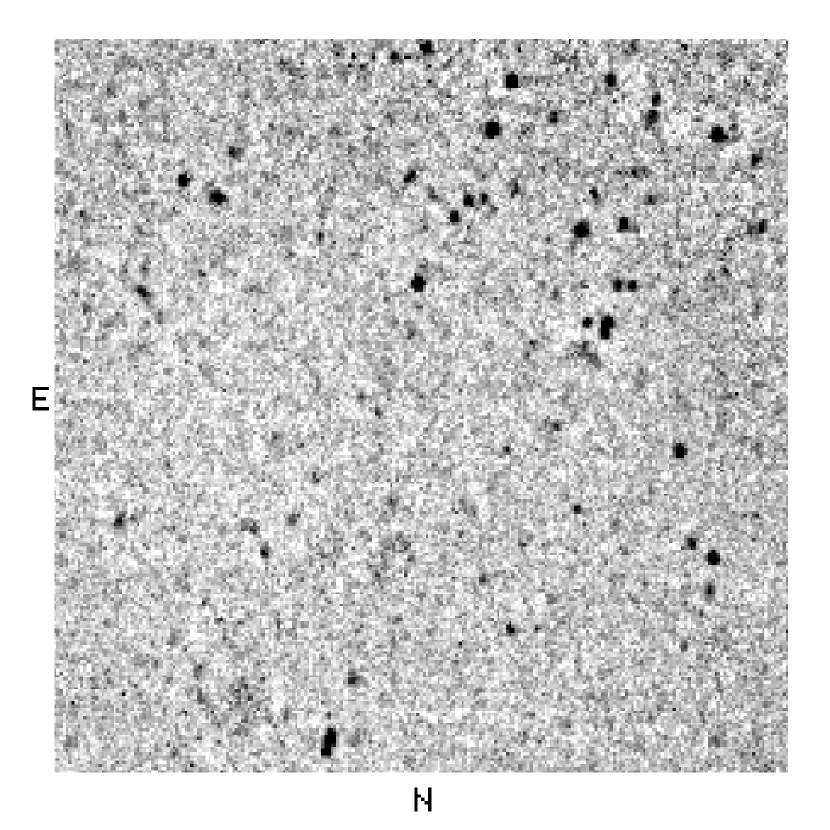
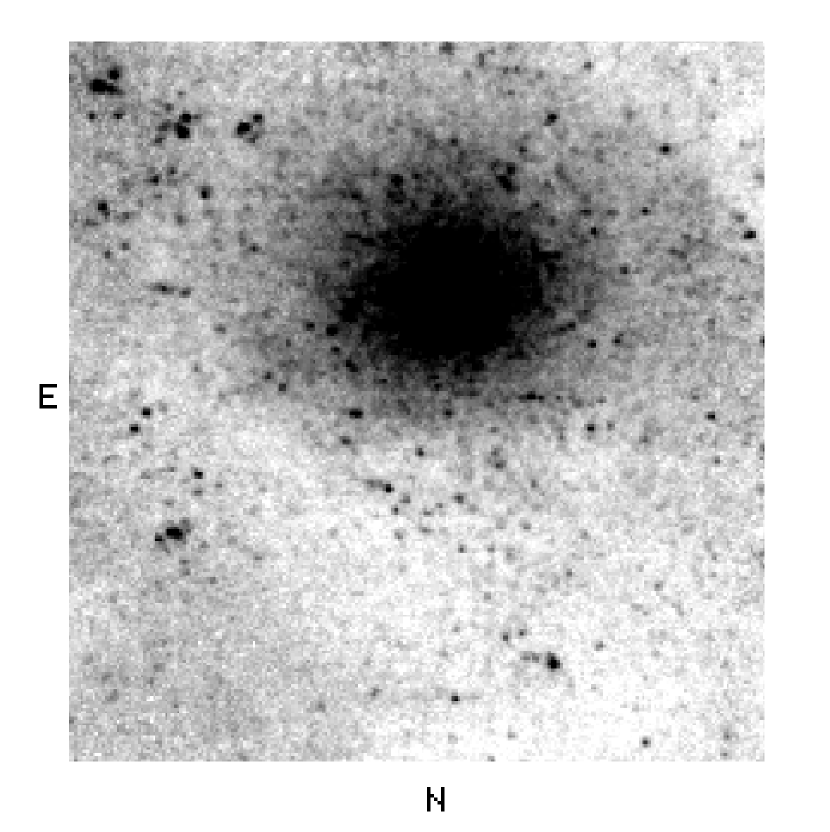
The initial stages of the data reduction consisted of: (1) dark subtraction, (2) division by dome flats, and (3) subtraction of the DC sky levels, which were computed on a frame-by-frame basis using the DAOPHOT (Stetson 1987) sky routine. Additional calibration frames showing thermal artifacts in and were constructed from the sky-subtracted data by stacking the images in these filters and then computing the median signal at each pixel location. The result was subtracted from each of the sky-subtracted and images. The processed images for each field were then aligned and the median at each pixel location computed. The final median-combined images, trimmed to the area common to the four dither positions, are shown in Figures 1 – 5.
Stellar brightnesses were measured with the PSF-fitting routine ALLSTAR (Stetson & Harris 1988), which is part of the DAOPHOT photometry package. Aperture corrections were derived from PSF stars after neighboring objects were subtracted from the images. Unresolved stars in each galaxy introduce non-uniformities in the background, which complicate efforts to obtain reliable photometry. The iterative technique described by Davidge, Le Fèvre, & Clark (1991) was used to model and remove this component.
The photometric calibration was defined with 25 observations of standard stars from the lists compiled by Elias et al. (1982) and Casali & Hawarden (1992). Given that extinction coefficients in the infrared are small and require a large number of standard star observations covering a range of airmasses, it was decided to fix these coefficients at the values derived by Guarnieri, Dixon, & Longmore (1991) for Mauna Kea. The method of least squares was then used to fit linear transformation equations of the form:
M =
where M and are the standard and instrumental magnitudes, and is the instrumental color, to the extinction-corrected measurements.
3 THE PHOTOMETRIC PROPERTIES OF RESOLVED STARS
3.1 Luminosity Functions and Data Completeness
The and LFs for all five fields are compared in Figure 6. The decrease in counts at the faint end indicates that incompleteness becomes significant when , , and . Sample completeness depends on crowding, which can change significantly over small angular scales in the central regions of galaxies; consequently, these completeness limits should be considered to be representative only.
When examined on a field-by-field basis, the and LFs show very good agreement. Moreover, with the possible exception of NGC55 Field 2, the logarithmic LFs follow linear trends at the bright end, so they can be characterised by a power-law exponent. Power-law exponents were derived by performing least squares fits at the bright end of each LF, and the results derived from the LFs in the interval are listed in Table 3. The exponents vary significantly from galaxy-to-galaxy, indicating differences in stellar content. Furthermore, the power-law exponents derived for the two fields in NGC55 and NGC300 agree within the estimated uncertainties, suggesting that the bright red stellar content within these galaxies does not change markedly with radius.
3.2 The CMDs and TCDs
The CMDs of the five fields are shown in Figure 7. The CMDs contain a mixture of RSGs, AGB stars, and foreground objects, and in this section an effort is made to identify each of these components.
Each galaxy contains a population of stars with and , and these objects are likely bright RSGs. Evidence to support this interpretation comes from the infrared aperture measurements of the optically brightest red stars in NGC300 obtained by Humphreys & Graham (1986). It is apparent from Figure 7 that the objects in their sample of spectroscopically confirmed RSGs have brightnesses and colors that are in excellent agreement with the brightest stars in the various Sculptor fields. The peak brightness of the RSG clump in each galaxy occurs near , indicating that NGC55, NGC300, and NGC7793 have roughly comparable distances. NGC300 Field 1 is of interest as there are no stars with , indicating that recent star formation has not occured in this field.
When both RSGs and AGB stars are present, and infrared observations of similar stars in Local Group galaxies can be used to define the photometric characteristics of these objects. The CMDs of RSGs and long period variable (LPV) AGB stars in the LMC and SMC, taken from the photometric compilations of Elias, Frogel, & Humphreys (1985) and Wood, Bessell, & Fox (1983), are shown in Figure 8. The brightest RSGs in the Magellanic Clouds have M, while the Magellanic Cloud LPV sequence peaks near . There is also a clear color separation between RSGs and AGB LPVs near .
Also shown in Figure 8 is the composite CMD of all 5 Sculptor fields, assuming a common distance modulus of . There are many similarities between the Sculptor and Magellanic Cloud CMDs. For example, the brightest stars in Sculptor and the Magellanic Clouds have comparable MK and , indicating that the RSGs with in the Sculptor fields are likely near the peak RSG brightness. In fact, this agreement supports a difference in distance modulus between the LMC and the three Sculptor galaxies. Furthermore, the redward extent of the AGB sequence in Sculptor grows towards fainter brightnesses, and a similar trend is seen in the Magellanic Cloud data. Finally, the Sculptor CMD shows a discontinuity near M, which corresponds to the AGB-tip brightness in the Magellanic Clouds. The comparison in Figure 8 thus indicates that the stellar contents of the Sculptor galaxies and the Magellanic Clouds are similar.
The TCD provides a powerful means of assessing foreground contamination, and can also be used to isolate RSG and AGB stars. The TCDs for the various fields are shown in Figure 9. The sequences defined by Galactic dwarfs with spectral-types G – M (Bessell & Brett 1988), LMC and SMC M supergiants (Elias, Frogel, & Humphreys 1985), and LMC LPVs (Wood et al. 1983; Wood, Bessell, & Paltoglou 1985) are also plotted on Figure 9. The RSGs studied by Humphreys & Graham (1986) fall along the LMC/SMC supergiant sequence on the TCD.
Foreground dwarfs have , and it is apparent that the majority of objects detected in the Sculptor fields have near-infrared spectral energy distributions (SEDs) that are very different from solar neighborhood dwarfs. This is significant since Humphreys & Graham (1986) found that four of the nine bright RSG candidates identified from optical data were actually foreground dwarfs; the comparisons in Figure 9 suggests that foreground contamination is much less significant in bright star samples selected at infrared wavelengths.
The TCDs confirm that all five fields contain a significant population of objects with colors appropriate for RSGs. However, there is also a population of stars in each field with colors that are too large to be RSGs, and the locus of these objects parallels the LMC LPV sequence.
Bertelli et al. (1994) modelled the evolution of stars from the main sequence to the AGB-tip for a broad range of masses and chemical compositions. Solar metallicity AGB sequences with log(t) = 8.0, 9.0, and 10.0, constructed by connecting the RGB and AGB-tip data summarized in Table 11 of Bertelli et al. (1994), are compared with the observed CMDs in Figures 7 and 8. colors were computed from the published values using the relation for solar neighborhood giants given by Frogel & Whitford (1987).
The comparisons between the isochrones and Magellanic Cloud data in Figure 8 are of particular interest, as the stars are spectroscopically confirmed members of the Magellanic Clouds, so that foreground contamination is not an issue, while the photometric measurements have little noise. The blue envelope and peak brightness of LPVs in the Magellanic Cloud are both matched by the log(t) = 8.0 sequence. However, the agreement between the models and the SMC observations is much poorer when M, as there is a large number of stars redder than the log(t) = 10.0 sequence. Nevertheless, while there is difficulty matching the colors of the reddest objects, all but two of the stars with have MK below the predicted log(t) = 10 AGB-tip brightness. Comparisons with models from Bertelli et al. (1994) having other metallicities give similar results.
The isochrones indicate that the disks of NGC55, NGC300, and NGC7793 contain stars that span a range of ages, as would be expected if the star formation rate has been roughly constant during intermediate epochs (Kennicutt, Tamblyn, & Congdon 1994). NGC300 is unique, as the majority of stars in this field have ages in excess of 1 Gyr.
The oldest stars are of interest for probing the age and early evolution of the disk. Sommer-Larson (1996) modelled the star-forming and chemical enrichment histories of disks, and concluded that the disks of early and late-type spiral galaxies have different ages, in the sense that late-type systems are younger. Although relatively faint, AGB-tip stars with log(t) = 10 still fall above the 100% completeness level in most fields, and a significant population of AGB stars with ages approaching 10 Gyr are present in all Sculptor fields.
The NGC55 Field 2 CMD contains a well-defined sequence with and . The stars that fall along this sequence are located near the eastern edge of Figure 2, and appear to belong to a richly populated, moderately young star cluster. The 100 Myr AGB isochrone runs parallel to, and to the red of, this sequence on Figure 7, and peaks mag in fainter than the observations, suggesting that the cluster may be slightly younger than 0.1 Gyr.
The LF of the brightest stars in this relatively young, richly populated cluster is of interest for probing the advanced stages of stellar evolution. Early efforts to model evolution on the AGB by Paczynski (1970) revealed a linear relation between surface luminosity and core mass, which in turn implies a flat LF (Renzini 1977). Subsequent studies of AGB evolution employing improved input physics have confirmed the linear nature of the luminosity – core mass relation for stars near the AGB-tip (e.g. Figure 7 of Boothroyd & Sackmann 1988).
The sequence in NGC55 Field 2 is scattered about a single color, so the stars should have, at least to first order, similar bolometric corrections; hence, the LF should be morphologically similar to the bolometric LF. The LF of stars in NGC55 Field 2 with and is shown in the top panel of Figure 10; the portion of the CMD showing the AGB sequence and the color selection boundaries is shown in the lower panel. The solid line in the upper panel is the mean value of derived from all 9 LF points, and it is apparent that the individual datapoints can be matched by a constant. Consequently, the LF is consistent with a linear relation between luminosity and core mass, as predicted by stellar evolution theory.
3.3 The Bolometric LF
The bolometric LF provides an additional means of comparing the star-forming histories of galaxies. Bolometric LFs derived from infrared data are of particular interest for studies of very cool stars as the optical photometric properties of these objects are affected by line blanketing, which complicates efforts to compute accurate bolometric corrections.
-band bolometric corrections, BCK, were computed for stars in the CMDs using the relation between BCK and for field giants given in Figure 1b of Frogel & Whitford (1987). The plotted relation terminates at , and was extended to redder colors by paralleling the bulge giant relation and applying a 0.1 magnitude offset, based on the difference between the two relations at bluer colors. It should be noted that the bolometric corrections computed in this manner apply only to giants, so there is some uncertainty in the luminosities derived for supergiants.
The bolometric LFs are compared in Figure 11, and galaxy-to-galaxy differences in stellar content are clearly evident. For example, the NGC300 LFs have a discontinuity at M, which is not seen in NGC55 and NGC7793, while the deficiency of luminous stars in NGC300 Field 1, noted in the previous section, is also apparent. Kolmogoroff-Smirnoff tests confirm that the NGC55 and NGC300 LFs differ in excess of the 95% confidence level when M, which is the appromximate completeness limit of these data. The NGC55 and NGC7793 LFs are not significantly different.
The LMC and SMC data plotted in Figure 8 indicate that color information can be used to isolate AGB LPVs in each galaxy. The bolometric LFs of stars with are plotted as dashed lines in Figure 11 and, with the exception of NGC55 Field 1, there is excellent agreement between the LFs of the various fields when M. This similarity, which was verified with Kolmogoroff-Smirnoff tests, suggests that the star-forming histories of the three galaxies have been similar when averaged over moderately long time scales. Richer et al. (1984) and Pritchet et al. (1987) used and data to derive AGB LFs for NGC300 and NGC55 and, with the exception of a difference in the number of objects with M, also found them to be very similar.
4 RADIAL POPULATION GRADIENTS IN NGC300 AND NGC7793
Galaxy formation models suggest that metallicity gradients form early-on in disks (Steinmetz & Muller 1994, 1995), and studies of HII regions indicate that these trends are sustained during subsequent episodes of star formation (e.g. Zaritsky, Kennicutt, & Huchra 1994 and references therein). It is not clear what effect galaxy morphology has on disk population gradients, although radial variations in the ratio of bulge-to-disk stars (Arimoto & Jablonka 1991) will introduce apparent gradients in stellar content. Nevertheless, studies of HII regions in galaxies spanning a range of brightnesses and morphologies suggests that local properties, such as surface brightness, rather than global properties, such as morphology, dominate disk evolution (Ryder 1995). Such a dependence may explain why, for a given Hubble type, the size and direction of disk color gradients show considerable scatter (e.g. Terndrup et al. 1994).
NGC300 and NGC7793 have orientations that are well suited for investigating the radial behaviour of disk stellar content; however, this is not the case for the edge-on system NGC55, so this galaxy is not considered in this Section. Population gradients may occur over relatively small spatial intervals close to the centers of galaxies and, in an effort to determine if population gradients are evident among the brightest red stars in NGC300 and NGC7793, the stellar contents in two annuli, centered on the inner spheroid of each galaxy, were compared. The annuli considered in NGC300 span the radial intervals (Ring 1) and (Ring 2) arcsec, while in NGC7793 the corresponding intervals are (Ring 1) and (Ring 2) arcsec. These intervals were selected so that each annulus contained comparable numbers of stars.
The CMDs for Rings 1 and 2 in each galaxy are compared in Figure 12, while the corresponding LFs are compared in the top two rows of Figure 13. The Ring 2 measurements in the right hand panel of Figure 13 have been shifted along the vertical axis to compensate for differences in surface brightness, based on the surface brightness profiles measured by Carignan (1985). These surface-brightness corrected data will serve as the basis for the comparisons discussed below.
It is evident from Figure 12 that the stars in NGC300 Ring 2 may be slightly redder on average than those in NGC300 Ring 1. In fact, when (ie. the approximate 100% completeness level) in Ring 1, compared with in Ring 2. These values differ at roughly the level, so the color difference is only marginally significant. For comparison, the mean colors for Ring 1 and 2 in NGC7793 are in excellent agreement.
The Ring 1 and 2 LFs in both galaxies do not differ significantly when . Although significant differences appear to occur when , these are likely due to the radial variation in the completeness level. When considered together, the CMDs and LFs in Figures 12 and 13 suggest that the bright stellar contents of NGC300 and NGC7793 do not change markedly with radius within an arcmin of the galaxy centers.
NGC300 Fields 1 and 2 are separated by 3 arcmin, and the LFs of these areas are compared in the lower panel of Figure 13. As noted previously, Field 2 contains an excess population of bright stars with respect to Field 1, although the two LFs are in good agreement when . It appears that there has been considerable spatial coherence in the star-forming properties of NGC300 over scales of a few arcmin, which corresponds to kpc, during intermediate epochs. However, during the past Gyr star formation in the inner regions of NGC300 has been suppressed with respect to the outer disk.
5 SUMMARY
Moderately deep near-infrared images have been used to probe the red stellar contents of the Sculptor group galaxies NGC55, NGC300, and NGC7793. The diagram constructed from these data demonstrates that surveys of the most evolved objects conducted in the infrared are less prone to foreground star contamination than their visible counterparts. All 3 galaxies contain a population of bright RSGs with , indicating that NGC55, NGC300, and NGC7793 have comparable distances. Comparisons with RSGs in the Magellanic Clouds suggest that the difference in distance modulus between these galaxies and the LMC is . All 5 fields contain rich intermediate-age populations spanning a range of ages from 1.0 to at least 10 Gyr. Therefore, the disks of these galaxies all contain an old stellar substrate. When averaged over timescales in excess of 1 Gyr or more, the star-forming histories of fields within a given galaxy show spatial coherence over kpc scales. However, this has not been the case during more recent epochs. For example, the central arcmin of NGC300 contains only a modest population of stars with ages less than 1 Gyr, indicating that recent star formation has been suppressed with respect to disk fields at larger radii. Moreover, despite having similar morphological characteristics, the star-forming histories of NGC55, NGC300, and NGC7793 during recent epochs show differences that are clearly apparent when comparing CMDs and LFs, although these differences become less pronounced when considering intermediate-age populations. NGC55 Field 2 contains a richly population cluster with an age Gyr. The LF of this cluster is flat, and hence is consistent with a linear relation between core mass and luminosity.
TABLE 1
GALAXY PROPERTIES
| NGC | Type | MB |
|---|---|---|
| 55 | Sc | –20.1 |
| 300 | ScII | –18.6 |
| 7793 | Sd(s)IV | –18.8 |
TABLE 2
DETAILS OF OBSERVATIONS
| NGC | Field | RA | Dec | Exposure Time | FWHM |
|---|---|---|---|---|---|
| # | (1950) | (1950) | (sec) | (arcsec) | |
| 55 | 1 | 00:12:24.1 | –39:28:03 | 3600 | 1.8 , 1.5 |
| 2 | 00:30:49.1 | –39:29:57 | 1440 | 1.5 | |
| 300 | 1 | 00:52:30.8 | –37:57:26 | 1440 | 1.8 |
| 2 | 00:52:30.5 | –37:54:26 | 720 | 1.5 | |
| 7793 | 1 | 23:57:49.2 | –32:35:26 | 4080 | 1.5 , 1.8 |
TABLE 3
POWER-LAW EXPONENTS FOR LFs
| NGC | Field | |
|---|---|---|
| # | ||
| 55 | 1 | |
| 2 | ||
| 300 | 1 | |
| 2 | ||
| 7793 | 1 |
REFERENCES
Andredakis, Y. C., Peletier, R. F., & Balcells, M. 1995, MNRAS, 275, 874
Arimoto, N., & Jablonka, P. 1991, A&A, 249, 374
Bertelli, G., Bressan, A., Chiosi, C., Fagotto, F., & Nasi, E. 1994, A&AS, 106, 275
Bessell, M. S., & Brett, J. M. 1988, PASP, 100, 1134
Bica, E., Barbuy, B., & Ortolani, S. 1991, ApJ, 382, L15
Bothun, G. D. 1992, AJ, 103, 104
Boothroyd, A. I., & Sackmann, I.-J. 1988, ApJ, 328, 641
Burstein, D., & Heiles, C. 1984, ApJS, 54, 33
Carignan, C. 1985, ApJS, 58, 107
Casali, M., & Hawarden, T. 1992, JCMT-UKIRT Newsletter, 4, 33
Catanzarite, J. H., Horowitz, I. K., Freedman, W. L., & Madore, B. F. 1995, BAAS, 27, 1294
Courteau, S., de Jong, R. S., & Broeils, A. H. 1996, ApJ, 457, L73
Davidge, T. J., Le Fèvre, O., & Clark, C. C. 1991, ApJ, 370, 559
Elias, J. H., Frogel, J. A., & Humphreys, R. M. 1985, ApJS, 57, 91
Elias, J. H., Frogel, J. A., Matthews, K., & Neugebauer, G. 1982, AJ, 87, 1029
Freedman, W. L. 1984, ApJ, 299, 74
Frogel, J. A., & Whitford, A. E. 1987, ApJ, 320, 199
Guarnieri, M. D., Dixon, R. I., & Longmore, A. J. 1991, PASP, 103, 675
Humphreys, R. M., & Graham, J. A. 1986, AJ, 91, 522
Kennicutt, R. C. Jr., Tamblyn, P., & Congdon, C. W. 1994, ApJ, 435, 22
Kiszkurno-Koziej, E. 1988, A&A, 196, 26
Lacey, C. G., & Fall, S. M. 1985, ApJ, 290, 154
Mighell, K. J., & Rich, R. M. 1995, AJ, 110, 1649
Minniti, D., Olszewski, E. W., & Rieke, M. 1993, ApJ, 410, L79
Paczynski, B. 1970, Acta Astron., 20, 47
Pierre, M., & Azzopardi, M. 1988, A&A, 189, 27
Phillips, A. C., Illingworth, G. D., MacKenty, J. W., & Franx, M. 1996, AJ, 111, 1566
Pritchet, C. J., Richer, H. B., Schade, D., Crabtree, D., & Yee, H. K. C., 1987, ApJ, 323, 79
Regan, M. W., & Vogel, S. N. 1994, ApJ, 434, 536
Renzini, A. 1977, in Advanced Stages in Stellar Evolution, ed. P. Bouvier, & A. Maeder, (Geneva Observatory: Geneva), pp. 149
Richer, H. B., Pritchet, C. J., & Crabtree, D. R. 1985, ApJ, 298, 240
Rieke, G. H., & Lebofsky, M. J. 1985, ApJ, 288, 618
Ryder, S. D. 1995, ApJ, 444, 610
Sandage, A., & Tammann, G. A. 1987, A Revised Shapley-Ames Catalog of Bright Galaxies, Carnegie, Washington.
Sommer-Larson, J. 1996, ApJ, 457, 118
Steinmetz, M., & Muller, E. 1994, A & A, 281, L97
Steinmetz, M., & Muller, E. 1995, MNRAS, 276, 549
Stetson, P. B. 1987, PASP, 99, 191
Stetson, P. B., & Harris, W. E. 1988, AJ, 96, 909
Terndrup, D. M., Davies, R. L., Frogel, J. A., DePoy, D. L., & Wells, L. A. 1994, ApJ, 432, 518
van den Bergh, S. 1992, PASP, 104, 861
Wood, P. R., Bessell, M. S., & Fox, M. W. 1983, ApJ, 272, 99
Wood, P. R., Bessell, M. S., & Paltoglou, G. 1985, ApJ, 290, 477
Zaritsky, D., Kennicutt Jr., R. C., & Huchra, J. P. 1994, ApJ, 420, 87
Zijlstra, A. A., Minniti, D., Brewer, J. 1996, Messenger, 85, 23