(noort@physics.usyd.edu.au, lanz@fys.ruu.nl) 22institutetext: SRON Laboratory for Space Research, Sorbonnelaan 2, NL-3584 CA Utrecht, The Netherlands (hennyl@sron.ruu.nl) 33institutetext: Harvard-Smithsonian Center for Astrophysics, 60 Garden Street, Cambridge MA 02138, USA (kurucz@cfa.harvard.edu) 44institutetext: Institut d’Astrophysique de Paris, CNRS, 98 bis Boulevard Arago, F-75014 Paris, France (ferlet, hebrard, vidalmadjar@iap.fr)
Fe II emission lines in the UV spectrum of Sirius-A and Vega††thanks: Based on observations with the NASA/ESA Hubble Space Telescope obtained at the Space Telescope Science Institute, which is operated by AURA, Inc., under NASA contract NAS 5-26555.
Abstract
We present high-quality HST/GHRS spectra in the Hydrogen L spectral region of Vega and Sirius-A. Thanks to the signal-to-noise ratio achieved in these observations and to the similarity of the two spectra, we found clear evidence of emission features in the low flux region, 1190-1222 Å. These emission lines can be attributed unambiguously to Fe ii and Cr ii transitions. In this spectral range, silicon lines are observed in absorption.
We built a series of non-LTE model atmospheres with different, prescribed temperature stratification in the upper atmosphere and treating Fe ii with various degrees of sophistication in non-LTE. Emission lines are produced by the combined effect of the Schuster mechanism and radiative interlocking, and can be explained without the presence of a chromosphere. Silicon absorption lines and the L profile set constraints on the presence of a chromosphere, excluding a strong temperature rise in layers deeper than .
Key Words.:
Stars: atmospheres – Stars: chromospheres – Stars: Sirius, Vega – Line: formation1 Introduction
On the main sequence, A-type stars are at a juncture point between hot and cool stars. While hot, massive stars undergo strong mass loss in fast winds ( M⊙/yr), cool stars show chromospheric activity connected to their subsurface convective layers. Both phenomena apparently disappear or become much weaker at spectral type A. Many studies have thus been devoted to the outer layers of A-type stars to search for indications of a wind or of stellar activity. Several attempts to detect signatures of weak winds in main-sequence A stars have been unsuccessful (e.g. Lanz & Catala lanz92 (1992)). Recently, however, a quite weak, blue-shifted absorption was detected in the Mg ii resonance lines of Sirius, and interpreted as a wind signature (Bertin et al. 1995b ). A mass loss rate of M⊙/yr was derived, consistent with the idea that A-type star winds are radiatively-driven like the winds of hotter stars. On the cool side, a limit to chromospheric activity has been set at A7 (Böhm-Vitense & Dettmann bohmvitense80 (1980), Marilli et al. marilli97 (1997), Simon & Landsman simon97 (1997)). The most common diagnostics of chromospheres and winds are emission features. Therefore, we are not expecting emission lines in A stars, except cases where such lines arise from the circumstellar environment.
High-quality ultraviolet spectra have become available with the Goddard High Resolution Spectrograph (GHRS) aboard the Hubble Space Telescope (HST). Even the core of strong resonance lines, including H i L, can be observed with a reasonably good signal-to-noise ratio. This makes it possible to investigate in greater detail the line profile of strong resonance lines. They are the best tool to probe the outer layers of stars, being indeed formed very high in the atmosphere. In this respect, L is most interesting because it spans the largest range of depth of formation, from the far wing to the line core. This large variation in opacity also affects the formation of lines of other elements, especially close to L core. Such lines see a much lower local pseudo-continuum than lines outside L, and will be formed much higher in the atmosphere than weak lines in other regions.
| Target | Spectral Range | Date of Observation | GHRS Grating | Aperture | Exposure time |
|---|---|---|---|---|---|
| Sirius-A | 1188 Å – 1218 Å | 1996 Nov 20 | G140M | SSA | 1632.0 s |
| Sirius-A | 1278 Å – 1307 Å | 1996 Nov 20 | G140M | SSA | 217.6 s |
| Sirius-A | 1308 Å – 1337 Å | 1996 Nov 20 | G140M | SSA | 217.6 s |
| Vega | 1185 Å – 1222 Å | 1996 Dec 23 | G160M | SSA | 435.2 s |
| Vega | 1274 Å – 1311 Å | 1996 Dec 23 | G160M | SSA | 108.8 s |
| Vega | 1303 Å – 1341 Å | 1996 Dec 23 | G160M | SSA | 108.8 s |
In Sect. 2 and 3, we will describe our GHRS observations around L of two bright A stars, Vega and Sirius-A. We will in particular point out the presence of Fe ii and Cr ii emission lines between 1190 and 1222 Å. Bertin et al. (1995a ) noticed the presence of emission features around L in a Cycle 1 GHRS spectrum of Sirius-A, originally recorded to derive the D/H abundance ratio in the local interstellar medium. This prompted us to repeat and extend these observations to investigate their origin. An explanation of these emission features is given in the second half of the paper. In Sect. 4, we describe our new non-LTE model atmospheres. We explore and set limits on a chromosphere (Sect. 5), and investigate non-LTE effects in Fe ii line formation (Sect. 6).
2 Observations and data reduction
2.1 HST observations
The far ultraviolet observations of the very bright stars Sirius and Vega were made in the framework of our Cycle 6 Guest Observer proposals ID6800 and ID6828 with the Goddard High Resolution Spectrograph aboard HST. A first attempt was performed in September 1996 but failed because the stars were not correctly located within the GHRS entrance slit. The observations were repeated in November and December 1996 with a different pointing strategy which was then fully successful. We have obtained high-quality spectra of both stars at high and medium spectral resolution. Only medium resolution spectra are discussed in this paper. Table 1 lists the individual observations.

In the first order, the G140M and G160M gratings provide a resolving power of 20 000 and 16 000 respectively at 1200 Å, i.e. a spectral resolution of about 15 km/s and 19 km/s in this spectral range. The resolution is slightly better in the other spectral ranges. In order to keep the best possible resolution, we have used only the Small Science Aperture (SSA) which corresponds to 0.25” on the sky and illuminates one diode. Further details on the instrumentation can be found in Heap et al. (ghrs (1995)).
We used the FP-SPLIT mode which splits the total exposure time into successive cycles of four sub-exposures, each corresponding to a slightly different projection of the spectrum on the photocathode. We also used the “quarter stepping” mode which provides a sample of four pixels per resolution element. This allows to simultaneously oversample the spectrum (the SSA does not fulfill the Nyquist sampling criterion) and to correct for the granularity of the photocathode. The granularity is identical for the four sub-exposures, and can therefore be estimated from a comparison of these sub-exposures which have different photon statistical noise.
2.2 Data reduction
The data were reduced with the IRAF software, using the STSDAS package. We used the standard method for correcting for the granularity, which is available in the IDL package (corre_hrs procedure). We found that this procedure allows us to achieve signal-to-noise ratios consistent with the high data count rates. Without rebinning our spectra (i.e. they show four pixels per resolution element), the S/N ratio of the final summed spectrum is larger than 100:1 in the long wavelength range and of the order of 50:1 and 15:1 in the L range, for Sirius and Vega respectively. At the bottom of L near the narrow interstellar absorption core (see Fig. 1), the S/N ratio is about 14:1 and 7:1 respectively. The geocoronal L emission has been removed, as described in Bertin et al. (1995a ).
In radial velocity, the absolute calibration accuracy is the standard one, as provided by the GHRS pipeline, i.e. 3.0 km/s. After the standard reduction, we shifted Vega and Sirius spectra by 0.05 and 0.02 Å respectively, based on the identification of the N i, Si ii and Si iii absorption lines. This shift is in good agreement with the radial velocities listed in the Simbad database, operated at CDS.
3 Qualitative description of the spectra
In this section, we compare qualitatively the spectrum of Vega and Sirius. We compare them also to LTE theoretical spectra which have been computed with the synthetic spectrum program SYNSPEC (Hubeny et al. 1994b ), using Kurucz (kurucz91 (1991)) LTE line-blanketed model atmospheres. We have adopted the following stellar parameters: K, , and a metallicity one third solar for Vega; K, , and a metallicity three times solar for Sirius-A. These parameters differ slightly from values adopted by other authors (Castelli & Kurucz castelli94 (1994), Hill & Landstreet ghill93 (1993)) which are primarily based on the study of the visible spectrum, but they provide a good fit to the observations in the 1270–1340 Å region. We do not expect however that these LTE spectra match the observations in the L region well (see Hubeny hubeny81 (1981)), but they should prove useful for the purpose of line identification. We will now describe in turn the two observed spectral regions.
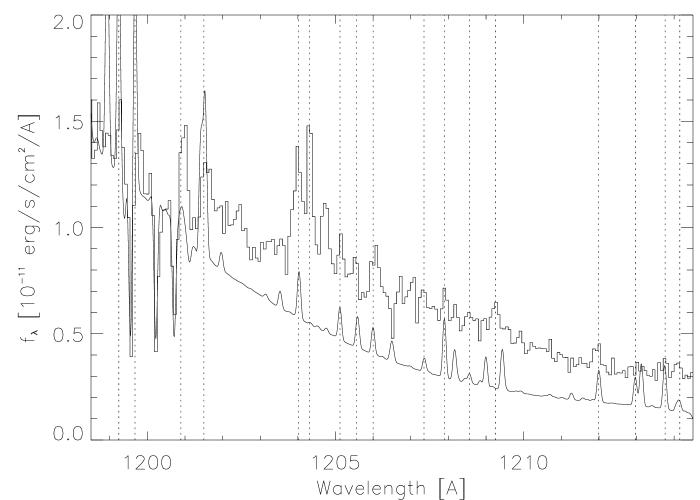
3.1 The L region
The blue wing and the core of L are displayed in Fig. 1, after rebinning to the nominal spectral resolution. In this figure, the LTE spectrum corresponds to the best fitting model of Vega in the 1300 Å spectral region (see Fig. 2). As expected, this LTE model does not fit well the L blue wing if one assumes the scaling factor determined at 1320 Å. Since we use it here only for illustration and line identification purposes, we have multiplied the theoretical flux by an additional factor 2 to have a scale similar to the observed spectra in the L region.
| Wavelength | Vega | Sirius-A | Ion | Lower energy | Term | Upper energy | Term | |
|---|---|---|---|---|---|---|---|---|
| [Å] | [cm-1] | [cm-1] | ||||||
| 1190.412 | abs. | abs. | Si ii | 0.000 | 84004.523 | 0.120 | ||
| 1190.736 | em. | em. | ||||||
| 1191.356 | em. | – | Fe ii | 8391.938 | D | 92329.891 | Fo | -1.868 |
| 1192.030 | em. | – | Fe ii | 8391.938 | D | 92282.461 | Fo | -1.448 |
| 1193.009 | abs. | abs. | C i | 16.400 | 83838.078 | -0.740 | ||
| 1193.286 | abs. | abs. | Si ii | 0.000 | 83802.211 | 0.420 | ||
| 1194.445 | em. | – | Fe ii | 25428.783 | G | 109149.680 | Io | -1.181 |
| 1194.498 | abs. | abs. | Si ii | 287.320 | 84004.523 | 0.820 | ||
| 1195.055 | em. | – | Fe ii | 8680.454 | D | 92358.609 | Fo | -1.909 |
| 1195.465 | em. | – | Fe ii | 8680.454 | D | 92329.891 | Fo | -1.509 |
| 1196.263 | em. | – | Fe ii | 8680.454 | D | 92274.117 | Po | -1.646 |
| 1196.670 | em. | – | Fe ii | 21251.607 | H | 104816.797 | Ho | -1.088 |
| 1197.391 | abs. | abs. | Si ii | 287.320 | 83802.211 | 0.120 | ||
| 1197.435 | em. | – | Fe ii | 8846.768 | D | 92358.609 | Fo | -1.585 |
| 1197.498 | em. | – | Fe ii | 21430.359 | H | 104937.797 | Ho | -1.020 |
| 1198.087 | em. | em. | Fe ii | 25805.328 | G | 109271.711 | Io | -1.751 |
| 1198.366 | em. | em. | Fe ii | 21581.639 | H | 105028.602 | Ho | -1.201 |
| 1198.931 | em. | em. | Fe ii | 21251.607 | H | 104659.258 | Ho | 0.162 |
| 1199.236 | em. | em. | Fe ii | 21430.359 | H | 104816.797 | Ho | 0.017 |
| 1199.550 | abs. | abs. | N i | 0.000 | 83364.617 | -0.290 | ||
| 1199.671 | – | em. | Fe ii | 21581.639 | H | 104937.797 | Ho | -0.112 |
| 1200.223 | abs. | abs. | N i | 0.000 | 83317.828 | -0.460 | ||
| 1200.710 | abs. | abs. | N i | 0.000 | 83284.070 | -0.760 | ||
| 1200.893 | em. | em. | Fe ii | 3117.461 | F | 86388.820 | Do | -1.828 |
| 1201.415 | em. | em. | Fe ii | 21581.639 | H | 104816.797 | Ho | -1.148 |
| 1201.506 | em. | em. | Fe ii | 21430.359 | H | 104659.258 | Ho | -1.295 |
| 1201.549 | em. | em. | Fe ii | 21711.918 | H | 104937.797 | Ho | -1.286 |
| 1204.020 | em. | em. | Fe ii | 25428.783 | G | 108483.867 | Go | -1.279 |
| 1204.250 | em. | em. | ||||||
| 1204.755 | em. | em. | Fe ii | 25805.328 | G | 108809.789 | Ho | -1.601 |
| 1205.117 | em. | em. | Fe ii | 26170.182 | H | 109149.680 | Io | -0.755 |
| 1205.558 | em. | em. | Fe ii | 26055.424 | G | 109003.297 | 4Do | -1.776 |
| 1205.997 | em. | em. | Fe ii | 26352.766 | H | 109271.711 | Io | -0.780 |
| 1206.500 | abs. | abs. | Si iii | 0.00 | 82884.406 | 0.230 | ||
| 1207.360 | em. | em. | Fe ii | 7955.299 | D | 90780.617 | Fo | -2.741 |
| 1207.900 | em. | em. | Fe ii | 25428.783 | G | 108217.570 | Fo | -0.697 |
| 1208.559 | em. | em. | Fe ii | 27314.922 | F | 110064.953 | Go | -2.308 |
| 1209.200 | em. | em. | ||||||
| 1209.700 | – | em. | ||||||
| 1211.986 | em. | em. | Fe ii | 8391.938 | D | 90901.125 | Po | -1.618 |
| 1212.966 | em. | em. | Fe ii | 7955.299 | D | 90397.867 | Do | -1.466 |
| 1213.759 | em. | em. | Fe ii | 8391.938 | D | 90780.617 | Fo | -1.174 |
| 1214.150 | em. | em. | Fe ii | 8846.768 | D | 91208.891 | Fo | -1.494 |
| 1217.140 | – | em. | Cr ii | 12303.860 | D | 94656.242 | Do | -1.138 |
| 1218.626 | – | em. | Cr ii | 12303.860 | D | 94363.508 | 6Po | -0.887 |
| 1218.906 | – | em. | Cr ii | 11961.810 | D | 94002.563 | 6Po | -1.085 |
| 1219.563 | – | em. | Cr ii | 12147.820 | D | 94144.430 | 6Po | -0.939 |
| 1219.959 | – | em. | Cr ii | 12032.580 | D | 94002.563 | 6Po | -1.057 |
| 1220.076 | – | em. | Cr ii | 12303.860 | D | 94265.992 | Do | -1.076 |
| 1220.165 | – | em. | Cr ii | 12496.440 | D | 94452.570 | Do | -1.067 |
| 1220.252 | – | em. | Cr ii | 12147.820 | D | 94098.133 | Do | -1.396 |
| 1221.492 | – | em. | Cr ii | 12496.440 | D | 94363.508 | 6Po | -0.939 |
In both stars, the narrow absorption which reaches zero-flux in L core is due to interstellar absorption, hidding the stellar Doppler core. Contrary to the LTE model prediction, the stellar line profiles do not reach zero-flux. Additionally, the profile differs between the two stars. The Sirius profile runs deeper towards the line center, while the Vega profile flattens out (except for the interstellar core) between 1212 and 1220 Å at a flux of erg/s/cm2/Å. This may be a first hint that a chromosphere is present in Vega, or this may simply result from different non-LTE heating in the Lyman continuum (see also Sect. 5).
The second striking feature in these spectra is the presence of numerous emission lines. Since emission lines have not been reported before in the spectrum of either star, we shall first examine the reality of these emission features, then identify them, and finally discuss their origin. While the presence of emission lines might seem unexpected in main-sequence, early A-type stars, Hubeny (hubeny82 (1982)) pointed out that some lines may indeed turn into emission in the L wings under some appropriate conditions.
The signal-to-noise ratio achieved in these GHRS observations (see Sect. 2) indicates that we cannot attribute these features to noise. Such a statement would not have been possible from IUE spectra. The similarity of the two spectra, as well as the presence of these emissions in an earlier GHRS spectrum of Sirius recorded in August 1992 (Bertin et al. 1995a ), provides additional support to the reality of these emission features.
The question is therefore to determine if these features are real emission lines, or if they are simply high points between blends of absorption lines. Some strong absorption lines can be readily identified: N i (1199.5, 1200.2, and 1200.7 Å), Si ii (1194.5, 1193.3, 1197.4, and 1190.4Å), and Si iii (1206.5Å). Except for the Si iii line, there are however no strong absorption lines in the range between 1202 and 1215 Å as verified by the LTE spectrum synthesis. Moreover, there is a very good correlation between the observed emission features in Vega and Sirius, and predicted Fe ii absorption lines in the LTE spectrum. Therefore, we believe that the explanation that these high points are only gaps between absorption blends is quite unlikely.
Our confidence in attributing the emission features to Fe ii emission lines is greatly increased by the fact that we can identify lines from the same multiplet in several instances. A first interesting case is the doublet H – Io at 1205.1, 1206.0 Å (labelled A in Fig. 1). The two lines appear in emission in the spectrum of the two stars. A second case (B) is the quartet D – Fo. Four lines (1191.4, 1192.0, 1195.1, 1195.5 Å) are in emission in the spectrum of Vega. A fifth line (1197.4 Å) coincides with the strong Si ii 1197.7 absorption line. We notice however that this latter line appears weaker than expected compared to the two other Si ii lines of the same multiplet. We attribute this weakness to some filling by the Fe ii emission line. Most interestingly, none of these five lines appear in emission in Sirius. This provides an indirect confirmation of the identification, and also indicates differences in Fe ii line formation between the two stars. We will later use these two multiplets as test cases to study the origin of the emission lines.
In the red wing of L (up to 1222 Å), there are no obvious emission lines in the spectrum of Vega, but there are two strong emission lines at 1220.1 and 1221.5 Å in the original spectrum of Sirius recorded in 1992. We can unambiguously attribute these lines to two Cr ii multiplets.
Table 2 lists the identified lines in this region, as well as four unidentified emission features. With a good certainty, most emission lines can be attributed to Fe ii or to Cr ii. We do not find any Fe ii absorption lines in the range, 1190–1222 Å. Conversely, no emission lines are found outside this range (see below).
Finally, we have measured in both stars a small wavelength shift of the order of 5 km s-1 of the resonance absorption lines. We attribute this shift to the deformation of the line profile due to an interstellar contribution. On the other hand, we do not find any systematic shift of the emission lines which may have suggested that these lines were formed in a wind.
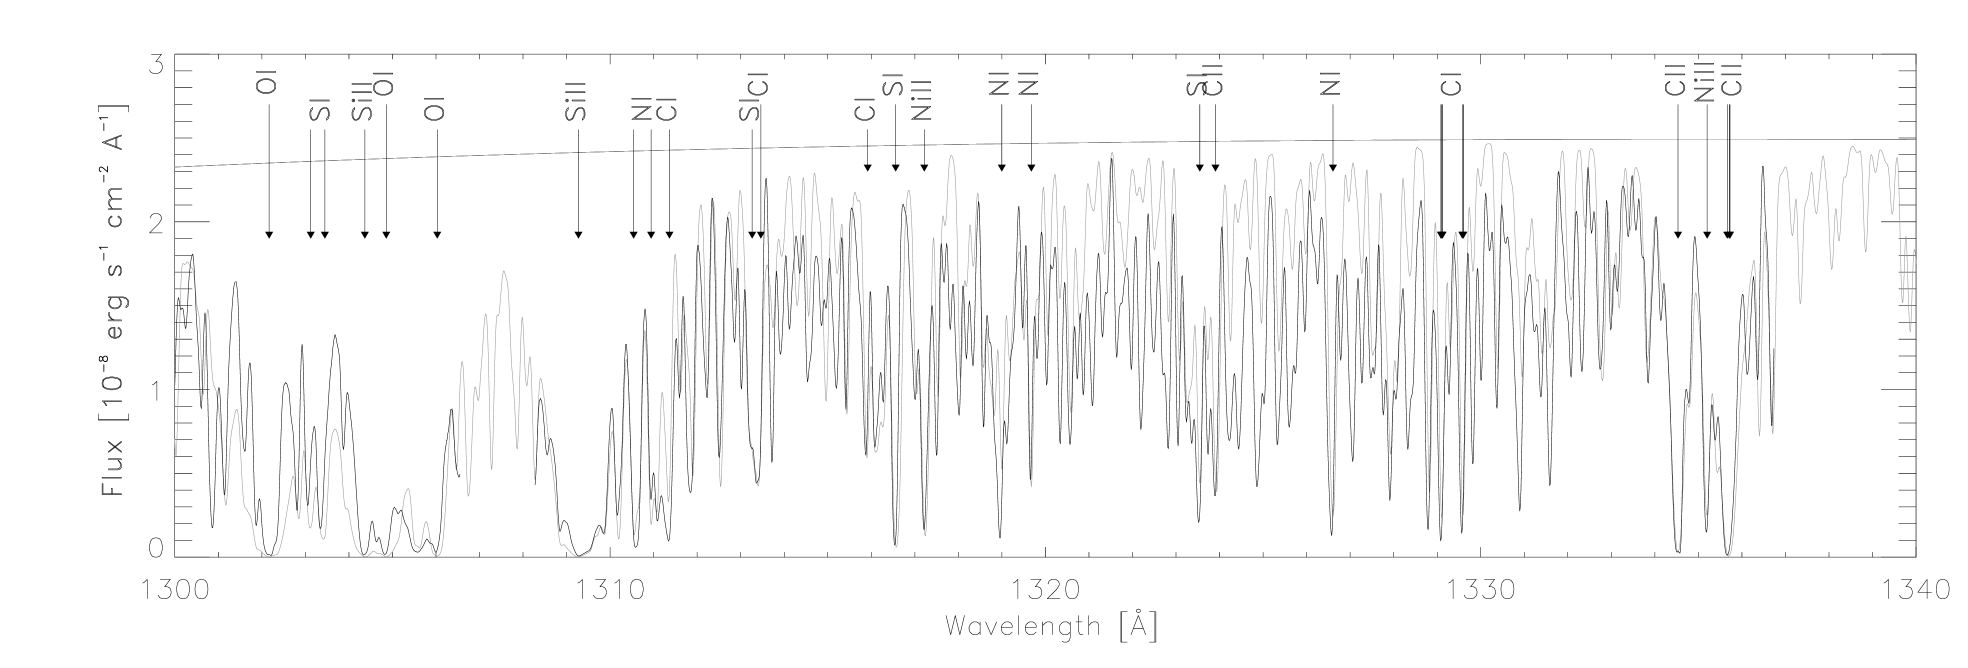
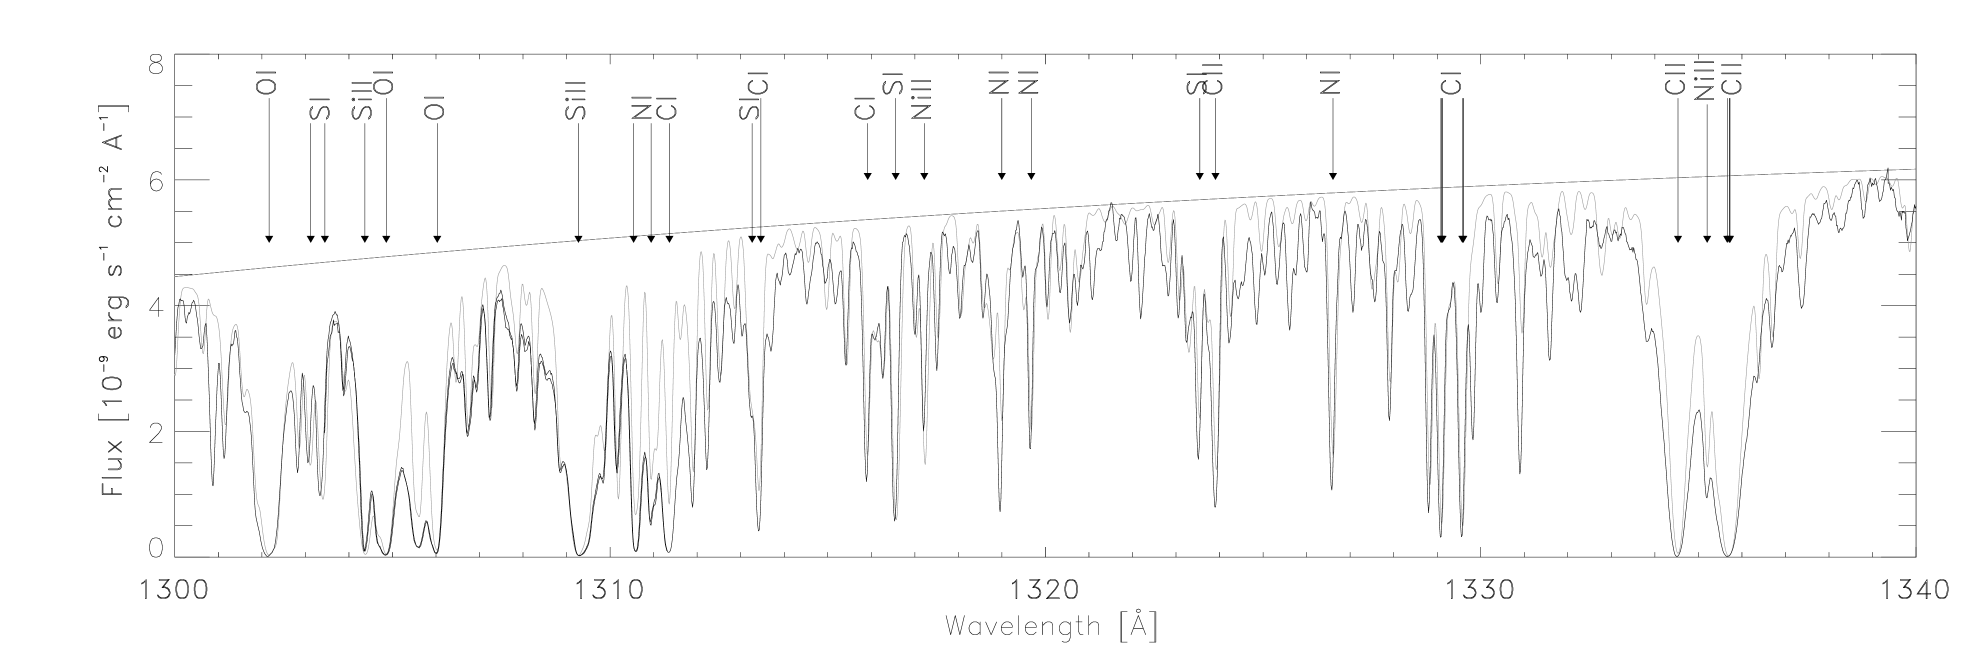
3.2 The 1300 Å region
Fig. 2 presents the GHRS spectra in a spectral region near the flux maximum. The stellar parameters have been set to provide the best fit to the observations in this range with a LTE spectrum. In this range, the LTE approximation is reasonably good (except perhaps for the Si ii and C ii resonance lines).
Since Sirius’ photosphere has a higher heavy element content (three times solar), its spectrum is much more depressed relative to the theoretical continuum compared to Vega (one third solar metallicity). High points in the Vega spectrum are often close to the theoretical continuum, but always below the continuum. There is thus no evidence of emission features in this range, where the spectrum can be well understood with absorption lines only.
Finally, we notice that the C ii 1334.5, 1335.7 resonance lines are weaker in Sirius than in Vega. C i lines in this range are also weaker, though less noticeably. To fit the carbon lines in Sirius, we have adopted an abundance, [C/H]=-0.6 dex, that agrees well with the carbon deficiency noted by previous authors (e.g. Lambert et al. lambert82 (1982)).
3.3 Summary of observation results
Thanks to the high quality of GHRS spectra of Vega and Sirius, we found evidence of emission features in the blue wing of L. In order to understand their origin, let us first summarize the properties of these features:
-
i)
The emission features are found in the range, 1190–1222 Å. No emission lines have been detected outside this range (see also e.g. Freire-Ferrero et al. freire83 (1983));
-
ii)
The emission features can be assigned to Fe ii and to Cr ii transitions;
-
iii)
There is a remarkable resemblance between Vega and Sirius spectra, most emission features being found in both spectra. Generally, Fe ii emission lines are somewhat stronger in Vega;
-
iv)
The spectrum of Sirius is almost identical to the GHRS spectrum obtained by Bertin et al. (1995a ) in 1992.
Finally, a model of Vega and Sirius outer layers must also explain the significant flux levels observed in the central region of L.
Based on these facts, we can exclude already some possible causes. While Sirius has a white dwarf companion, we can most likely rule out any effect from the companion, because the spectra are so similar and Vega is a single star. Moreover, any contribution from Sirius-B should remain negligible (Bertin et al. 1995a ). Time dependent phenomena, like transient mass-loss episodes, are also unlikely due to the absence of variations. Emission lines from a circumstellar shell would be also present at other wavelengths. Emission features can arise from a chromosphere or can result directly from non-LTE effects in line formation. We will investigate both possibilities with new model atmospheres for early A-type stars incorporating appropriate physics inputs. Since both spectra are so similar, we will concentrate on modeling the Vega spectrum and we shall discuss briefly in the concluding section the differences between the two stars.
4 Model atmospheres
4.1 General approach
L is formed in an extended part of the stellar atmosphere because of the large increase in opacity from the continuum to the line core. To compute L profiles correctly, we need therefore model atmospheres extending up to very-high, low-density layers. Usually, Kurucz LTE model atmospheres (Kurucz kurucz91 (1991)) stop before getting to these layers. In any case, departures from LTE are quite likely in these layers due to the very low densities, and thus there is a preponderance of radiative processes over collisional processes. In deeper layers where the continuum is formed, the crucial effect is backwarming due to line-blanketing, and non-LTE effects play a minor rôle. Ideally, we would like thus to model Vega and Sirius with consistent, non-LTE, line-blanketed atmospheres. We decided however to follow a more empirical approach by choosing various temperature structures in the outer layers, and thus to explore what atmospheric structures are compatible with the GHRS observations.
Our model atmospheres are set up in two pieces. In the deep part, we adopt a LTE line-blanketed model atmosphere, while we prescribe the temperature structure in the higher layers. Either we extrapolate the Kurucz temperature structure, or we assume a temperature plateau or a rise. We assume hydrostatic equilibrium everywhere to derive the total pressure. In a second step, we keep the temperature and pressure stratification fixed, and solve the statistical equilibrium for hydrogen and a few neutral elements which are important contributors to the continuum opacity (mainly, C i and Si i). To model L, we have compared the emergent spectrum assuming either complete photon redistribution in frequency (CRD) or coherent scattering (or partial redistribution, PRD). Finally, we solve the statistical equilibrium for Fe ii to study the non-LTE line formation problem. The next sections describe in more detail these steps.
4.2 LTE line-blanketed photospheres
We computed a series of LTE, line-blanketed model atmospheres with the ATLAS9 code (Kurucz kurucz91 (1991)). For each model, we have calculated a LTE spectrum synthesis in the range, 1270-1340 Å. The best match to Vega GHRS spectra was obtained for the stellar parameters, K, , and one third solar metallicity. In all models, we have assumed a turbulent velocity, km s-1. All extended models will be built upon this model photosphere.
4.3 Non-LTE extended model atmospheres

We had then to extend the ATLAS9 model atmosphere to smaller optical depths. We note in passing that the geometrical extension of the atmosphere itself remains small; a plane-parallel geometry is still adequate. We extrapolated the temperature stratification from the last depth points at to depths . We considered several cases (see Fig. 3):
-
i)
Cool external layers, by extrapolating logarithmically the T vs. relation from the ATLAS9 model (model EXT1);
-
ii)
Isothermal outer layers, with various surface temperatures; note that the isothermal region extends deeper if we choose higher surface temperature, and that this will eventually change drastically the overall flux distribution (models EXT2 to EXT4, with boundary temperatures, = 5700, 7000, 8000 K, respectively);
-
iii)
Chromospheric temperature rise (model EXT5).
The model with a temperature rise is characterized by three parameters, the surface temperature, the depth where the temperature starts to rise, and the zone in which the temperature increases. Many combinations are possible. The five models that we have selected here will however allow us to discuss the essential behavior of L and Fe ii lines. Assuming hydrostatic equilibrium, the total pressure and densities are then extrapolated straightforwardly.
For each model, EXT1 to EXT5, we derive non-LTE populations for hydrogen with the TLUSTY194 program (Hubeny tlusty88 (1988), Hubeny & Lanz clali1 (1995)). TLUSTY is a quite versatile program, in particular allowing one to solve only statistical equilibrium (and radiative transfer) while keeping the atmospheric stratification (temperature, total density) fixed. Hydrogen is represented essentially exactly with the lowest 8 levels included individually while the upper levels are merged into a non-LTE superlevel accounting for level dissolution (Hubeny et al. 1994a ). We have also included in the non-LTE model a few levels of heavier species which contribute to the continuum opacity in the UV (C i, Mg i, Al i, Si i, and Fe i).
4.4 CRD and PRD approximations

In most applications, one assumes non-coherent scattering in spectral-line formation and that photons are completely redistributed over the line profile (CRD approximation). Neither this limit nor the strictly coherent scattering limit is achieved in stellar atmospheres, requiring to calculate redistribution functions in some detail. Partial redistribution (PRD) effects on predicted line profiles turn out to be of importance mainly for resonance lines (see e.g. Mihalas book78 (1978)) and, particularly, for L where scattering is almost coherent (Vernazza et al. VAL1 (1973), Hubeny hubeny80 (1980)).
We have computed the L profile assuming LTE (i.e. no scattering), CRD or PRD, for model EXT2. Partial redistribution in L is treated following Hubeny (hubeny80 (1980)), as implemented in SYNSPEC (Hubeny et al. 1994b ). Fig. 4 shows that the three line profiles differ markedly. Basically, L is a scattering line (i.e. the source function is determined by the mean intensity, , and the thermal part is very small) and, therefore, the predicted profile depends critically on the assumed approximation for scattering. In CRD, photons absorbed in the Doppler core will be reemitted in the line wings where they could escape more easily. This contributes to increase the flux in the wings. The fraction of non-coherent scattering is small in the PRD approximation resulting in a deeper line profile. All non-LTE models, but EXT4, predict in CRD a central bump in L profile. This central bump is formed at depths where H becomes optically thin. H photons can escape, resulting in an increase of the level population, and eventually increasing the number of L core photons redistributed to the near-wings. This bump is therefore a spurious result of the CRD assumption.
None of the three predicted profiles reproduce Vega’s spectrum in the center of L. While we explained the spurious bump predicted in CRD, the source function in PRD and in LTE is too low to account for the observed flux. There are two possible ways to improve this situation. One may either assume a larger fraction of non-coherent scattering than currently used in the PRD approach, or increase the temperature at the depth of formation (e.g. model EXT5). The second possibility will be discussed in Sect. 5, while we leave a detailed study of partial redistribution to a future paper.
4.5 Treating Fe ii outside LTE
The final step consists in solving the non-LTE Fe ii line formation. At this point, we keep fixed the atmospheric structure and the non-LTE populations previously calculated to avoid changes in the background continuum (basically here the L profile) that may occur with different model atoms of Fe ii. In this way, we focus our attention on the Fe ii line formation, avoiding indirect effects which could mask the mechanism responsible of the observed emission lines.
Including Fe ii in non-LTE calculations has long been a challenge due to the complexity of this ion, the large number of energy levels (795 observed in the laboratory, about 11 000 predicted, Kurucz kurlist (1988)) and lines (45 815 and about 1.26 million, respectively) involved. Such numbers remain beyond the capacity of today’s computers, and this problem therefore requires some statistical approach. The idea consists in grouping individual levels with similar physical properties into superlevels. Individual levels in a given superlevel share a common non-LTE departure coefficient. We set up different level groupings based on two approaches: (i) grouping by energy and parity, (ii) grouping by configuration.
The first approach allows us to tailor freely the number of superlevels. We have defined energy limits in such a way that all observed levels are grouped into 80 superlevels. The transitions between superlevels can include lines in a wide wavelength interval with a complicated total cross-section. They are described by Opacity Distribution Functions, see details in Hubeny & Lanz (clali1 (1995)).
In the second case, the observed levels are grouped into 293 superlevels, according to terms. We assign the multiplet -value to each transition between two superlevels, and represent the transition by a single line with a Gaussian profile. In addition to the case including all terms, we have set up two simpler test cases. They are geared toward explaining specifically observed emission lines of two multiplets (see Sect. 3.1): the doublet H–Io, and the quartet H–Fo. We keep the model atom as simple as possible, including only the 10 lowest levels, the two levels of the multiplet, and those levels that are directly connected to the studied multiplet. In total, the two models include 40 and 44 Fe ii superlevels, respectively.
5 Chromospheric emissions in early-A stars?
Emission lines in cool stars are most often the signature of a chromosphere. A lot of effort has been devoted lately to define the locus of the onset of convective envelopes that are responsible of chromospheric activity. Such works as, for example, the recent survey of Marilli et al. (marilli97 (1997)), have reached a common conclusion, setting this limit at spectral type A7. The presence of surface convection and chromospheric emissions is thus not expected in early A-type stars.
Nevertheless, we decided to investigate the effect of various temperature stratification on the emergent L line profile and the Fe ii lines, since higher temperatures in the line-forming region might explain our observations. We have computed a spectrum for each model, EXT1 to EXT5, in the CRD and PRD cases. Here, we assume LTE for Fe ii line formation. Fig. 5 presents the emergent spectrum of models EXT2 and EXT5 in the CRD case. From these models, four main points emerge:
-
–
As far as the L profile is concerned, model EXT2 is indistiguishable from EXT1. Model EXT5, with a chromospheric temperature rise starting at , differs only in the central part, 1214-1217Å, which emerges from these hotter layers. Model EXT3 exhibits small differences in the same range.
-
–
On the contrary, increasing the temperature in deeper layers (model EXT4) produces a marked change in the line profile; the calculated flux becomes about 5 times larger than observed if CRD is assumed; on the other hand, if PRD is assumed, EXT4 predicts a flux closer to the observations in the center of L (compare Fig. 4 and bottom panel of Fig. 6).
-
–
N i, Si ii, and especially Si iii resonance lines turn to strong emissions in models with temperature rises.
-
–
Finally, Fe ii lines are affected only very slightly by changes in the upper atmosphere. They are sensibly weaker in model EXT4 only.

Turning the Fe ii lines into emission requires either high temperatures in relatively deep layers or/and low continuum source function (i.e. the PRD approximation). However, other lines, like the Si ii and Si iii lines, then turn also into emission. Indeed, Si iii1206 is observed in emission in A7 stars (Simon & Landsman simon97 (1997)), but not in Vega and Sirius. Could emission in these resonance lines be masked by interstellar absorption and mimic the observed narrow lines? This is unlikely, because our models predict broad emissions, either for the Si iii line in model EXT5 (see Fig. 5) or for Si ii lines in model EXT4 (see bottom panel, Fig. 6), and narrow interstellar absorption lines cannot mask the emission wings.
From these first models, we therefore conclude that the emission lines observed in L wings do not provide a compelling evidence for the presence of a chromosphere. The temperature rise, if any, must occur higher than . This agrees well with the result of a detailed non-LTE study of Mg ii resonance lines (both in CRD and PRD) by Freire Ferrero et al. (freire83 (1983)). They found that a limit for a chromosphere in Vega must be set to to achieve a good match to the observations. More definite conclusions based on L must however await more detailed PRD-NLTE calculations.
6 Non-LTE Fe ii line formation
6.1 Schuster mechanism

Weak lines in L wings see L as a strong scattering local continuum. The interplay between scattering and absorption may give rise to absorption as well as emission lines, and is know classically as the Schuster mechanism (see Mihalas book78 (1978)). Hubeny (hubeny82 (1982)) discussed the case of the different types of lines in the L wings of A stars.
Fig. 6 illustrates this effect. The top panel shows that the line profiles are drastically different depending on the assumption on L scattering. Here, all lines (except L) are assumed to be in LTE and, thus, . The source function of the local continuum is lower in the PRD case than in the CRD case, which results in weaker absorption lines in the PRD case. A close inspection of the figure even shows very weak emissions. Temperature in the line-forming region is higher in model EXT4, resulting in higher line source functions and stronger emissions (bottom panel).
The Schuster mechanism may therefore be an important effect to explain the observed Fe ii emission lines. Its efficiency depends however on the temperature gradient in the photosphere as well as on the details of L scattering.
6.2 Radiative interlocking
Another mechanism that can be responsible for the formation of emission lines is radiative interlocking. By interlocking, we mean the interaction of two or more atomic transitions. This is usually important only when one of the transitions is the dominant process in populating a shared level, and thereby influences the other transition(s). This can happen for instance when the flux in one line is much larger than in an other line.
In the solar spectrum, such situations have been observed. In particular, an emission line has been observed at 3969.4 Å close to the core of the Ca ii H resonance line. This line has been attributed first to Eu ii, Er ii, and finally to Fe ii.
Canfield & Stencel (canfield76 (1976)) suggested that interlocking usually occurs when the atomic structure is so complex that radiative interlocking of many weak lines becomes significant, as in rare-earth elements. On the other hand, metals have a simpler atomic structure, and emissions are mainly controlled by the presence of strong pumping lines at shorter wavelengths. They conclude that the Fe ii3969.4 emission line should be associated with the presence of a chromosphere.
However, non-LTE calculations with a simplified Fe ii model atom (Cram et al. cram80 (1980)) indicated that this is not necessarily the case. Fe ii emission in the wings of strong resonance lines can be explained by the same mechanism of radiative interlocking with a very limited number of transitions. Their results showed that the line properties depend primarily on the photosphere characteristics rather than on a chromosphere, just as for rare-earth elements.

Emission caused by radiative interlocking may be observed in situations where the flux varies strongly with wavelength, for instance in the wings of strong resonance lines. The depth of formation between weak lines in the continuum and weak lines close to the core of resonance lines can differ by several orders of magnitude in these situations. This large flux difference may result in a situation where one transition is the dominating process in populating the upper energy level.
Since L presents one of the strongest flux changes between the core and the continuum, radiative interlocking may therefore be a good candidate to explain the observed Fe ii emission lines in Vega and Sirius. We have tested this idea with the model atmosphere EXT2, and solving the Fe ii non-LTE line formation for the different Fe ii model atoms described in Sect. 4.4. Here we have still assumed the CRD approximation to limit the effect of the Schuster mechanism, and investigate the role of radiative interlocking in Fe ii. We will adopt the PRD approximation only in the final comparison (Sect. 6.6) since we deem it a better approximation to model L.
6.3 The ODF approach
To investigate the non-LTE effects of Fe ii lines, we have first used the grouping by energy and parity. In this way, we can still easily include all individual levels while keeping a relative freedom on the number of superlevels. We have adopted a model with 80 superlevels.
| E [cm-1] | Term | J |
|---|---|---|
| 25428.783 | G | |
| 25805.328 | G | |
| 26170.182 | H | |
| 26352.768 | H | |
| 30388.543 | G | |
| 32875.645 | I | |
| 32909.906 | I | |
| 33466.465 | G | |
| 109149.680 | Io | |
| 109271.711 | Io |
Some very weak Fe ii emission lines appeared in the wings of L. They are predicted however much weaker than the observed lines. Moreover, the strongest emission lines do not coincide with the observed emissions. Many absorption lines are also predicted weaker than in LTE. This is partly due to overionization, but may also indicate an increase in the line source function. This effect was just not strong enough to reproduce the observed emission lines. A probable reason for this failure is that many levels are grouped together in the highly-excited superlevels, resulting in some “dissolution” of the interlocking effect.
We have tried to improve this situation by splitting some superlevels and including explicitly a few individual levels, like the Io doublet, which give emission lines in the spectra of Vega and Sirius. Although this does not result in the expected emissions, the transitions associated with this doublet were further weakened, suggesting that radiative interlocking was a contributing factor.
If this approach is most practical to include iron opacities in model atmospheres, this does not appear to be the best way of grouping levels for the problem in our hands. In a further step, we decided therefore to use a more careful way of grouping levels by grouping them by configurations. We explore now two test cases where we focus on two multiplets identified in our spectra. In a final step, we will again include all Fe ii energy levels.


6.4 Case A: H – Io
As a first case with Fe ii grouped by configurations, we have selected the doublet H – Io The two lines, at 1205.1 and 1206.0 Å, are seen in emission in Vega and in Sirius. They are thus probably not too sensitive to the detailed conditions in the stellar atmospheres. The upper levels of these transitions, 109 149.7, 109 271.7, are also populated by several strong transitions around 1310 Å. Fig. 7 displays the most important lines connecting to these upper levels. Since the flux around 1205 Å is much lower than around 1310 Å, we are in a quite favorable situation for radiative interlocking. The complete system involving the lower and upper levels of the 1205 lines is relatively simple, and we can limit the model atom to 40 superlevels. The photoionization cross-sections of all Fe ii levels are approximated by an hydrogenic expression.
Our model, assuming atmospheric structure EXT2, shows that indeed interlocking is important in the formation of these lines. This can clearly be seen in Fig. 8, where the non-LTE departure coefficients of the Io, H and I terms are plotted as a function of the Rosseland optical depth. The departure coefficient of the upper level has a value significantly larger than unity in the region of line formation (). The populations of the two lower levels show almost no departures from LTE at this depth. The Fe ii 1205 lines have almost vanished (Fig. 8). This stands out in sharp contrast to the LTE prediction where they are in absorption. Although the lines are affected as expected, the effect falls just short of the observed emission.

The Io energy level is very close to the continuum. Therefore, ionization and recombination are also important processes for the population of these levels. Our assumption of an hydrogenic photoionization cross-section may be unrealistic. S. Nahar (priv. comm.) kindly provided us with new theoretical photoionization cross-sections. Indeed, cross-sections for all 2Io energy levels are notably smaller than the hydrogenic approximation, especially in the energy regime corresponding to the maximum of flux in Vega. This will reduce photoionization processes, and increase the non-LTE departure coefficients of levels close to the continuum. We expect then that lines will turn more easily into emission.
We have therefore proceeded in changing only the cross-section of level Io in our Case A. This results in turning the lines into stronger emission lines (Fig. 9). The departure coefficients of the levels differ only slightly from the ones previously calculated with hydrogenic cross-sections, but the difference is large enough to produce the required effect.
Fig. 10 displays the run of the source function, mean intensity, and Planck function with depth. In particular, we see that the Fe ii1205 line source function is larger than the source function of the local continuum (L wing) in the optical depth range where the lines are formed. When the Fe ii line becomes optically thin, the source function becomes larger than the mean intensity and the Planck function , resulting in an emission line.
This effect remains small, in particular due to a bump in the continuum source function. This bump is an artifact of the CRD approximation, which leads to a redistribution of L core photons in the wings. As noted previously, a better treatment with PRD would prevent this bump in the source function, and increase the contrast between the local continuum and the Fe ii lines. This would result in stronger emission lines.
These results show that the interlocking mechanism is capable of explaining the observed emission lines, by using a relatively simple, isolated system with a limited number of energy levels. However, the results remain sensitive to changes in the radiation field, using different photoionization cross-sections for instance.
6.5 Case B: D – Fo
A second example is the quartet D – Fo, around 1195 Å. These lines are observed in emission in Vega, but not in Sirius (Sect. 3.1). We have incorporated in Case B all levels connected to the two multiplet levels and the 10 lowest configurations. The total number of Fe ii superlevels is 44.
The upper level of this multiplet is not as close to the ionization limit as Case A. There are higher levels connected to Fo. This may result in decreasing the importance of photoionization and recombination processes. We assume here again a hydrogenic approximation for the photoionization cross-sections.
In Case B, the resulting emergent spectrum is not much changed in comparison to the LTE prediction. Radiative interlocking does not appear to play an important rôle. Although a larger model atomic system might produce the emission, it seems more likely to attribute the origin of the emission to the Schuster mechanism in this case. This would explain why this multiplet is observed in emission in Vega spectrum only, indicating that the formation of the second multiplet is more sensitive to the local conditions (radiation field, temperature, …) than the Case A multiplet.
6.6 Case C: All observed terms
We must finally examine whether radiative interlocking still produces emission lines when we incorporate all Fe ii terms. Many levels close in energy and numerous collisional transitions might result in lessening severely the effect of interlocking. Our last model includes 293 Fe ii superlevels, 7 453 radiative transitions, and about 35 000 collisional transitions. All photoionization cross-sections are assumed hydrogenic. The PRD approximation is used to model L.
Fig. 11 shows a good correspondence between the predicted and the observed emission lines. The strength of the emission lines compares also well to the observations. This demonstrates that the mechanism at the origin of the observed Fe ii emission lines is a non-LTE effect, combining interlocking and the Schuster mechanism. Assuming CRD, we also predict emission lines, but the correspondence is not as good. We believe that a better correspondence may still be achieved with realistic photoionization cross-sections for most Fe ii terms.
7 Conclusions
We have reported emission features in the L profile of Vega and Sirius-A. These emission lines have been attributed to Fe ii and Cr ii transitions. The identification appears quite secure because all the lines of several multiplets appear in emission.
We have built non-LTE model atmospheres with different assumed temperature structures in the outer layers and incorporating Fe ii with different degrees of sophistication. We found that the emission features cannot be explained by a chromospheric temperature rise. To produce the observed Fe ii emissions, the temperature would have to increase in relatively deep layers, turning other lines into emission (e.g. Si ii, Si iii lines). However, we cannot exclude a chromospheric rise in shallower layers () based on our present observations, in agreement with earlier results (Freire-Ferrero et al. freire83 (1983)).
Non-LTE Fe ii line formation calculations with different model atoms have demonstrated that some Fe ii lines can turn into emission in the wavelength range between 1190 and 1240 Å. We stress that emission lines are predicted only in this very low flux, central region of L. This results from the combined effect of the Schuster mechanism and radiative interlocking. Some highly-excited levels are overpopulated by transitions occurring in a high-flux region, and preferentially de-excite in this region near L. This mechanism explains the similarity of Vega and Sirius spectra.
Differences between the two stars can also be understood with this mechanism. The higher heavy-element content in Sirius’ photosphere results in depressing the flux, in particular near the flux maximum. The efficiency of the pumping is thus reduced, yielding generally weaker emissions in Sirius than in Vega. The details depend on the exact wavelength of the pumping transitions. The flatter L profile in Vega is also a consequence of the different metallicity. Lyman continuum heating must be more efficient in Vega’s case (less heavy-element line opacity) yielding a somewhat higher temperature in the outer layers and a higher flux in the central region of L.
We believe that the origin of the Cr ii emission lines may be explained by similar mechanisms. While we cannot rule out that radiative interlocking is also effective in Cr ii, the difference between Vega and Sirius points to the Schuster mechanism being the major cause of the emission in this case. The lines are thus stronger in Sirius due to the larger chromium abundance, and are simply too weak in Vega to stand out of the noise.
Although our model atmosphere calculations provide an explanation to an unexpected observation of emission lines in the spectrum of early A-type stars, we did not achieve a good fit to the L profile at this stage. It seems however likely that the flux observed in the central region of L may be explained by increasing somewhat the fraction of non-coherent scattering in the PRD approximation that we have used. Matching these observations would require (at least) non-LTE line-blanketed model atmospheres, treatment of L in partial redistribution tuning the ratio between coherent and non-coherent scattering, and improved, non-hydrogenic Fe ii photoionization cross-sections. Such an approach is necessary to gain a deeper insight into the outer layers of Vega and Sirius, and this certainly deserves further study.
Finally, we did not find emission lines very close to the L core, especially in the 0.5 Å blueward of the central wavelength. This implies fortunately that we have so far no reason to question the previous results on the local interstellar cloud (Bertin et al. 1995a ), and on the wind absorption feature (Bertin et al. 1995b ).
Acknowledgements.
We would like to thank the STScI staff for rescheduling Vega and Sirius observations after an original failure to acquire these two very bright stars. Especially, we are grateful to Alice Berman who noticed that the plan for the repeated observations would probably also fail, Dave Soderblom who proposed another approach that was successful, and Al Schultz who implemented it. We would like to thank also Ivan Hubeny and C. S. Jeffery for many comments and suggestions which helped to improve this paper. The non-LTE analysis was the topic of MvN master’s thesis in astrophysics at Utrecht University. TL acknowledges the financial support of the Netherlands Foundation for Research in Astronomy.References
- (1) Bertin P., Vidal-Madjar A., Lallement R., Ferlet R., Lemoine M., 1995, A&A 302, 889
- (2) Bertin P., Lamers H. J. G. L. M., Vidal-Madjar A., Ferlet R., Lallement R., 1995, A&A 302, 899
- (3) Böhm-Vitense E., Dettmann T., 1980, ApJ 236, 560
- (4) Canfield R. C., Stencel R. E., 1976, ApJ 209, 618
- (5) Castelli F., Kurucz R. L., 1994, A&A 281, 817
- (6) Cram L. E., Rutten R. J., Lites B. W., 1980, ApJ 241, 374
- (7) Freire-Ferrero R., Gouttebroze P., Kondo Y., 1983, A&A 121, 59
- (8) Heap S. R., Brandt J. C., Randall C. E., et al., 1995, PASP 107, 871
- (9) Hill G. M., Landstreet, J. D., 1993, A&A 276, 142
- (10) Hubeny I., 1980, A&A 86, 225
- (11) Hubeny I., 1981, A&A 98, 96
- (12) Hubeny I., 1982, in: Upper Main Sequence CP Stars, Proc. 23rd Liege Astrophys. Coll., 373
- (13) Hubeny I., 1988, Comp. Phys. Comm. 52, 103
- (14) Hubeny I., Lanz T., 1995, ApJ 439, 875
- (15) Hubeny I., Hummer D. G., Lanz T., 1994a, A&A 282, 157
- (16) Hubeny I., Lanz T., Jeffery C. S., 1994b, in: Newsletter on Analysis of Astronomical Spectra No. 20, ed. C. S. Jeffery, St Andrews Univ., p. 30
- (17) Kurucz R. L., 1988, in: IAU Trans., ed. M. McNally, Vol. 20B, Kluwer, p. 168
- (18) Kurucz R. L., 1991, in: Stellar Atmospheres: Beyond Classical Models, eds. L. Crivellari et al., NATO-ASI Ser. C-152, p. 441
- (19) Lambert D. L., Roby S. W., Bell R. A., 1982, ApJ 254, 663
- (20) Lanz T., Catala C., 1992, A&A 257, 663
- (21) Marilli E., Catalano S., Freire Ferrero R., Gouttebroze P., Bruhweiler F., Talavera A., 1997, A&A 317, 521
- (22) Mihalas D., 1978, Stellar Atmospheres, 2nd ed., Freeman Co., San Fransisco
- (23) Simon T., Landsman W. B., 1997, ApJ 483, 435
- (24) Vernazza J. E., Avrett E. H., Loeser R., 1973, ApJ 184, 605