An Aluminum Enhanced Cloud in a Civ Absorber at 11affiliation: Based in part on observations obtained at the W. M. Keck Observatory, which is jointly operated by the University of California and the California Institute of Technology.
Abstract
In the Civ absorption line system in the spectrum of quasar Q1222+228 (), we find two clouds which have contrasting physical conditions, although they are only at a 17 km s-1 velocity separation. In the first cloud Siii, Siiv, and Cii are detected, and Alii and Aliii column density limits in conjunction with photoionization models allow us to infer that this cloud has a large Si abundance and a small Al abundance relative to a solar abundance pattern. This pattern resembles that of Galactic metal–poor halo stars, which must have formed from such high redshift gas. The second cloud, in contrast, has detected Alii and Aliii (also Siiv and Cii), but no detected Siii. We demonstrate, using photoionization models, that Al/Si must be greater than (Al/Si)⊙ in this unusual cloud. Such a ratio is not found in absorption profiles looking through Milky Way gas. It cannot be explained by dust depletion since Al depletes more severely than Si. Comparing to other Al–rich environments, we speculate about the processes and conditions that could give rise to this abundance pattern.
1 Introduction
One of the motives for studying quasar (QSO) absorption line systems is to document the photoionization structure, chemical composition, and kinematics of the ISM and halos of high redshift galaxies at a level of detail on par with studies of the Milky Way ISM and Halo. QSO lines of sight that pass through high redshift galaxies sample multiple gaseous structures having a variety of physical conditions such as found in Galactic Hi and Hii regions, supershells, infalling Halo gas, and material being processed at the Galaxy/Halo interface. Recognizing the abundance patterns, photoionization conditions, and kinematics associated with these various types of structures is a prerequisite for a detailed understanding of the evolution of galactic gas.
Based upon low resolution spectra, early QSO absorption line efforts have been limited to simple curve of growth analyses of equivalent widths, providing only a weighted–average of the absorbing gas properties in each system. A great deal has been learned from these studies and a global (statistically based) picture of chemical and ionization evolution has been suggested [see Steidel (1993) and references therein]. The next logical step is to examine variations in the chemical and ionization conditions within single galaxies and to incorporate kinematic information. Using high resolution UV spectra, several researchers studied the Milky Way Disk and Halo at a detailed level (Welty et al. (1997); Savage & Sembach (1996); Snow et al. (1996); Spitzer & Fitzpatrick (1995); Fitzpatrick & Spitzer (1994); Spitzer & Fitzpatrick (1993)). Some recent efforts have focused on the cloud–by–cloud conditions in high redshift galaxies (cf. Tripp, Lu, & Savage (1997); Petitjean et al. (1994)). It is hoped that, ultimately, a statistical picture of the processes that give rise to the observed absorbing gas properties will improve our understanding of the present–epoch Milky Way and galactic evolution. In this Letter we study the cloud–to–cloud properties in a Civ system at along the line of sight toward the quasar Q in order to: 1) demonstrate a large variation in ionization and/or abundance conditions between two kinematically adjacent clouds in the same absorber; and 2) present an unusual cloud that has an Al/Si abundance ratio enhanced by a factor of several relative to the solar ratio.
2 The Data
Our spectrum of Q, which has resolution km s-1 with three pixels per resolution element, is a 3600 second exposure obtained with HIRES/Keck I (Vogt et al. (1994)) on 23 January 1995. The wavelength coverage is 3810.5–6304.9 Å with breaks redward of 5100 Å. The spectrum was obtained as part of a large study of intermediate redshift Mgii absorbers (Churchill (1997)), and thus the captured wavelength coverage did not include certain desirable transitions of the Civ system. The reduction and analysis of the data are described elsewhere (Churchill 1997, Churchill, Vogt, & Charlton 1998a, Schneider et al. 1993, Churchill et al. 1998b). In Figure 1, we present the detected transitions (5) aligned in line–of–sight velocity.
We focus upon the Siii , Alii , and Aliii transitions in two absorbing clouds centered at and km s-1. The Civ profiles are saturated across this velocity interval, but the Siiv and Cii profiles clearly show two distinct clouds. In Cloud A, at km s-1, we have detected Siii and obtained upper limits on both Alii and Aliii . In Cloud B, at km s-1, the converse is true; we have detected Alii and Aliii , and obtained an upper limit on Siii . The Aliii transition, the doublet counterpart of Aliii , was not covered.
The cloud velocities, column densities, and Doppler parameters were obtained from Voigt profile (VP) decomposition of the spectra using the program MINFIT (Churchill (1997)), which minimizes between the model and the data. All detected transitions were fit simultaneously, with the exception of the Civ transition, which is blended with an unidentified feature. The VP results are listed in Table 1. The equivalent width limits for the non–detected transitions were converted to column density upper limits using the curve of growth. Since these equivalent width limits correspond to the linear part of the curve of growth, the column density limits are not sensitive to the adopted parameter (see Table 1). We note that also corresponds to the linear part of the curve of growth and therefore is well constrained despite the large fractional error in .
Constraints are available for the total neutral hydrogen column density of the absorber, which can be interpreted as an upper limit on of any single cloud in the system. In the FOS/HST spectrum of Impey et al. (1996), there is no indication of a break at the expected location of the Lyman limit. They report detections of Ly and Ly that are members of complex blends which suffer from a pre–COSTAR point spread function. Fernández–Soto et al. (1995) performed a profile fit to a saturated, multi–component Ly feature at Å in a spectrum with resolution km s-1. However, the number of components and their parameters and column densities are too uncertain to provide a constraint more useful than that provided by the lack of a Lyman limit break. We have conservatively adopted an upper limit of cm-2.
3 Photoionization Modeling of the Clouds
We inferred the clouds’ physical conditions using CLOUDY (Ferland (1996)). We have assumed a extragalactic UV ionizing background, given by Haardt & Madau (1996) ( erg s-1 Hz-1 cm-2). The input parameters for CLOUDY are the neutral hydrogen column density, , the metallicity, , and the total number density of hydrogen, . CLOUDY assumes that photons are incident on one side of a plane–parallel slab of gas with constant and integrates the equations of radiative transfer along an optical path through the slab until it reaches a specified . For a fixed spectrum, there is a relationship between and the ionization parameter (the number density of hydrogen ionizing photons over the number density of electrons). For simplicity, we adjusted the two ratios111We use the notation . [Si/H] and [Al/H] keeping . An important assumption is that the modelled transitions arise in a single phase environment. The broad, saturated, Civ profile may arise in a physically distinct higher ionization phase from the Cii and other lower ionization species. We argue that the precise velocity alignment of the lower ionization species and the fact that their parameters are consistent (see Table 1) justify the assumption.
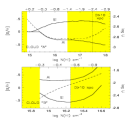
For Cloud A, we measured , , and upper limits on and . Without precise information on the neutral hydrogen distribution in the system, we modelled the cloud for a range of . For a given we ran CLOUDY in its “optimized” mode, allowing , , and [Si/H] to vary until the cloud model was consistent with the observed , , and . The ratio constrained both the ionization parameter and metallicity. For models with cm-2, was greater than the upper limit. We therefore set all other parameters equal to those given by the optimized solution and then solved for the model cloud by varying [Al/H] and optimizing on the measured upper limits on and . In the upper panel of Figure 2, we illustrate how the [Si/H] and [Al/H] ratios, , and , must be scaled for the models to be consistent with the data. For cm-2, a factor of two to three enhancement of [Si/H] and an underabundance of [Al/H] are obtained, nearly independent of metallicity. The lack of a Lyman limit break in the FOS/HST spectrum of Impey et al. (1996) precludes a large . This cloud could be consistent with [Si/H] and [Al/H] (solar values) only if the metallicity is super–solar [for cm-2]. We conclude that [Si/H] is enhanced and [Al/H] is underabundant by a factor of a few for the more plausible range of metallicities, . This pattern is similar to that seen in Galactic Halo stars of comparable metallicities (Lauroesch et al. (1996); Savage & Sembach (1996)).
For Cloud B, we have measured , , , and an upper limit on . As with Cloud A, the Lyman limit break provides the constraint of cm-2. Al is unusual in that its high–temperature dielectronic recombination rates are high and the ratio can increase with increasing for cm-2 (Petitjean et al. (1994)). For smaller this is not the case; a decreasing yields an increasing as naively expected. Nonetheless, because of the unusual nature of reactions involving Al, we approached the modeling of Cloud B with caution.
First, we considered the constraints that can be placed on the model cloud without considering the Al column densities (i.e. using only the Cii and Siiv detections and the Siii limit, we allowed , , and [Si/H] to vary). We found models consistent with the data for cm-2. Smaller values were unable to produce enough Siiv relative to Cii. For larger values, must be larger, corresponding to a smaller , and the model cloud was unrealistically large and Jeans unstable. For the acceptable range of , we found . The metallicity ranged from for cm-2 to for cm-2. Next, we considered what model clouds were consistent with the constraints provided by only the Alii and Aliii column densities while allowing and to vary. Again, a consistent model cloud could be achieved for cm-2. Systematically, the required metallicities were half to one dex larger than those required by the C and Si constraints alone. Naively, these two experiments imply [Al/Si], consistent with the striking strength of the Al profiles for Cloud B.
When we ran CLOUDY in optimize mode, using all Si, C, and Al constraints and allowing , , [Si/H], and [Al/H] to vary, we found and were required for all possible . Only the narrow range cm-2 yielded acceptable cloud models. For smaller values of , the ratios and could not be made consistent with the data (for the same ). The model results are illustrated in the lower panel of Figure 2. Over the permitted range of , we have , , , and .
Given the unusual conclusion we have reached that the Al in Cloud B is enhanced by a factor of two relative to solar, we now consider the validity of our assumption of photoionization equilibrium. Trapero et al. (1996) found the ratio of out of equilibrium in the interstellar cloud toward the B1 V star 23 Ori. In that case, excited carbon implied a high density so that collisional ionization was applicable; the ratio of implied a higher temperature than that measured from Doppler parameters, indicating that the gas had cooled faster than it could recombine. We obtained an unrestrictive upper limit on the density in Cloud B from an upper limit on . However, we have no reason to believe Cloud B suffers from such a non–equilibrium situation. Cloud B is consistent with photoionization in that the CLOUDY models are found to have kinetic temperatures consistent with those inferred from the Doppler parameters under the assumption of thermal broadening [such was not the case for the models of Trapero et al. (1996)].
Since the clouds are likely to be in a galaxy, it is possible that stellar sources could affect the shape of the ionizing radiation spectrum. However, the following basic argument applies. Both Ali and Sii have similar ionization potentials (6.0 eV and 8.2 eV, respectively) as do Alii and Siii (18.8 eV and 16.3 eV, respectively). Unless the spectrum of ionizing radiation has a very abrupt feature in these energy ranges, Alii and Siii will be similarly affected by a change in spectral shape. We ran test models and confirmed this with a star–forming galaxy spectrum (Bruzual & Charlot (1993)).
4 Summary and Speculations
Two kinematically adjacent, absorbing clouds in the same galaxy at km s-1 and km s-1 have very different abundance patterns, if they are in photoionization equilibrium. Based upon CLOUDY models, Cloud A is inferred to have Si enhanced relative to a solar abundance pattern, and Al underabundant relative to solar. This abundance pattern is characteristic of Milky Way Halo stars (Lauroesch et al. (1996); Savage & Sembach (1996)) which could have formed from gas like that observed in this galaxy. We would expect such a pattern for many clouds in high redshift galaxies. Independent of the details, Cloud B has Al several times enhanced relative to Si (compared to the solar abundance pattern). This Al enhancement is highly unusual. If depletion onto dust grains is important we would expect a smaller Al/Si since Al depletes more readily than Si. To date, such an Al enhanced pattern has not been seen in absorption profiles looking through Milky Way interstellar gas (Savage & Sembach (1996); Snow et al. (1996); Spitzer & Fitzpatrick (1995); Fitzpatrick & Spitzer (1994); Spitzer & Fitzpatrick (1993)).
How could an enhancement of Al originate in a cloud? In an attempt to find clues we note three astrophysical environments in which Al enhancement is observed: 1) in the stellar photospheres of the most metal poor globular clusters (Shetrone (1996); Smith & Kraft (1996)); 2) in the broad line regions of some AGNs222We note that the absorber lies 30,000 km s-1 from the emission redshift of the QSO, which is not a BAL AGN. (Shields (1997)); and 3) in the photospheres of Milky Way Bulge stars (McWilliam & Rich (1994)). The common theme for the enhancement of Al in these three seemingly different environments is novae. The novae could produce the Al either directly in their ejecta (Smith & Kraft (1996)) or indirectly by providing magnesium isotopes to the ISM that later deposit onto stellar photospheres (Langer & Hoffman (1995)). The 26Mg and 27Mg isotopes would then be converted to Al through proton capture in deep CNO convective mixing layers in metal poor stars (Langer & Hoffman (1995)). More generally, does this suggest that a concentration of novae contributed to enhancing the Al in this cloud? In the globular cluster environment one key is to have a large number of stars that were formed coevally. Another key, which may apply to all three environments, is to have a potential well large enough to retain the gas. These may be prerequisites in our case also. Another possibility for excess Al production is a particular class of supernova for progenitors over a narrow mass range. The predicted amount of enhancement relative to other elements depends on the specific supernovae model adopted (Nomoto et al. (1997)), however only a small subclass of models would give Al/Si in agreement with that inferred for this cloud.
Just how unusual is this cloud with a large Al/Si ratio? Such a pattern has not been seen in absorption along dozens of lines of sight toward Milky Way disk and halo stars. Most high redshift clouds do not have large Aliii and Alii (relative to Siii). However, in the damped Ly absorber in Q (Lu et al. (1996)), we have identified a single outlying cloud (at km s-1) for which the equivalent width of the Alii transition is larger than that of the Siii transition. The other clouds in the same system clearly have the opposite ratio. Finding more examples and establishing similarities between Al–rich environments are logical next steps in diagnosing the origin of this abundance pattern at high redshift and perhaps understanding the anomalous enhancements seen in metal–poor globular cluster and Bulge stars.
References
- (1)
- Bruzual & Charlot (1993) Bruzual, G., and Charlot, S. 1993, ApJ, 405, 538
- Churchill (1997) Churchill, C. W. 1997, Ph.D. Thesis, University of California, Santa Cruz
- (4) Churchill, C. W., Vogt, S. S., and Charlton, J. C. 1998a, ApJS, in preparation
- (5) Churchill, C. W., Rigby, J. R., Charlton, J. C., and Vogt, S. S. 1998b, ApJS, submitted
- Ferland (1996) Ferland, G. 1996, Hazy, University of Kentucky Internal Report
- Fernández–Soto et al. (1995) Fernández–Soto, A., Barcons, X., Carballo, R., and Webb, .J. K. 1995, MNRAS, 277, 235
- Fitzpatrick & Spitzer (1994) Fitzpatrick, E. L., and Spitzer, L. 1994, ApJ, 427, 232
- Giroux, Sutherland, & Shull (1994) Giroux, M. L., Sutherland, R. S., and Shull, J. M. 1994, ApJ, 435, 97
- Haardt & Madau (1996) Haardt, F., and Madau, P. 1996, ApJ, 461, 20
- Impey et al. (1996) Impey, C. D., Petry, C. E., Malkan, M. A., and Webb, W. 1996, ApJ, 463, 473
- Langer & Hoffman (1995) Langer, G. E., and Hoffman, R. D. 1995, PASP, 107, 1177
- Lauroesch et al. (1996) Lauroesch, J. T., Truran, J. W., Welty, D. E., and York, D. G. 1996, PASP, 108, 641
- Lu et al. (1996) Lu, L., Sargent, W. L. W., Barlow, T. A., Churchill, C. W., and Vogt, S. S. 1996, ApJS, 107, 475
- McWilliam & Rich (1994) McWilliam, A., and Rich, R. M. 1994, ApJS, 91, 749
- Nomoto et al. (1997) Nomoto, K., Hashimoto, M., Tsujimoto, T., Thielemann, F.-K., Kishimoto, N., Kubo, Y., and Nakasata, N. 1997, Nuclear Physics A, 616, 79
- Petitjean et al. (1994) Petitjean, P., Rauch, M., and Carswell, R. F. 1994, A&A, 291, 29
- Savage & Sembach (1996) Savage, B. D., and Sembach, K. R. 1996, ARAA, 34, 279
- Schneider et al. (1993) Schneider, D. P. et al. 1993, ApJS, 87, 45
- Shields (1997) Shields, G. A. 1997, in Mass Ejection from Active Galactic Nuclei, ed. N. Arav, I. Shlosman, and R. J. Weymann (PASP Conference Proceedings)
- Smith & Kraft (1996) Smith, G. H., and Kraft, R. P. 1996, PASP, 108, 344
- Snow et al. (1996) Snow, T. P., Black, J. H., van Dishoeck, E. F., Burks, G., Crutcher, R. M., Lutz, B. L., Hanson, M. M., and Shuping, R. Y. 1996, ApJ, 465, 245
- Shetrone (1996) Shetrone, M. D. 1996, AJ, 112, 1517
- Spitzer & Fitzpatrick (1993) Spitzer, L., and Fitzpatrick, E. L. 1993, ApJ, 409, 299
- Spitzer & Fitzpatrick (1995) Spitzer, L., and Fitzpatrick, E. L. 1995, ApJ, 445, 196
- Steidel (1993) Steidel, C. C. 1993, in Galaxy Evolution: The Milky Way Perspective, PASP Conf. Series 49, ed. S. R. Majewski, (San Francisco : PASP), 227
- Trapero et al. (1996) Trapero, J., Welty, D. E., Hobbs, L. M., Lauroesch, J. T., Morton, D. C., Spitzer, L., and York, D. G. 1996, ApJ, 468, 290
- Tripp, Lu, & Savage (1997) Tripp, T. M., Limin, L., and Savage, B. D. 1997, ApJS, 112, 1
- Vogt et al. (1994) Vogt, S. S. et al. 1994, SPIE, 2198, 326
- Welty et al. (1997) Welty, D. E., Laroesch, J. T., Blades, J. C., Hobbs, L. M., and York, D. G. 1997, ApJ, 489, 672
| Cloud A | Cloud B | ||||
|---|---|---|---|---|---|
| Transition | (km s-1) | (km s-1) | |||
| Alii 1670.787 | aaUpper limit for assumed , based upon the Cii transition | ||||
| Aliii 1862.790 | aaUpper limit for assumed , based upon the Cii transition | ||||
| Cii 1334.532 | |||||
| Siii 1526.707 | bbUpper limit for assumed , based upon the Alii transition | ||||
| Siiv 1393.755 | |||||
| Siiv 1402.770 | |||||