Morphological Evolution in High Redshift Radio Galaxies and the Formation of Giant Elliptical Galaxies11affiliation: Based on observations obtained at the W. M. Keck Observatory, which is operated jointly by the University of California and the California Institute of Technology.
Abstract
We present deep near–infrared images of high redshift radio galaxies (HzRGs) obtained with the Near Infrared Camera (NIRC) on the Keck I telescope. In most cases, the near–IR data sample rest wavelengths free of contamination from strong emission lines and at Å, where older stellar populations, if present, might dominate the observed flux. At , the rest–frame optical morphologies generally have faint, large–scale (50 kpc) emission surrounding multiple, kpc size components. The brightest of these components are often aligned with the radio structures. These morphologies change dramatically at , where the images show single, compact structures without bright, radio–aligned features.
The linear sizes ( kpc) and luminosities ( to ) of the individual components in the HzRGs are similar to the total sizes and luminosities of normal, radio–quiet, star forming galaxies at (Steidel et al. 1996; Lowenthal et al. 1997). For objects where such data are available, our observations show that the line–free, near–IR colors of the galaxies are very blue, consistent with models in which recent star formation dominates the observed light. Direct, spectroscopic evidence for massive star formation in one of the HzRGs exists (4C41.17, Dey et al. 1997). Our results suggest that the HzRGs evolve into much more massive systems than the radio–quiet galaxies and that they are qualitatively consistent with models in which massive galaxies form in hierarchical fashion through the merging of smaller star–forming systems.
The presence of relatively luminous sub–components along the radio axes of the galaxies suggests a causal connection with the AGN. We compare the radio and near–IR sizes as a function of redshift and suggest that this parameter may be a measure of the degree to which the radio sources have induced star formation in the parent objects. We also discuss the Hubble diagram of radio galaxies, the possibility of a radio power dependence in the relation, and its implications for radio galaxy formation.
Finally, we present for the first time in published format basic radio and optical information on 3C 257 (), the highest redshift galaxy in the 3C sample and among the most powerful radio sources known.
Submitted to The Astrophysical Journal on 11 August 1997
1 Introduction
Radio sources have allowed the identification of luminous galaxies out to extremely high redshifts. Optical/near–IR campaigns during the past few years by several groups have resulted in the discovery of more than 120 radio galaxies at , including 17 with , and 3 with (see De Breuck et al. 1997 for a recent summary). At lower redshifts, powerful radio sources are consistently identified with giant elliptical and cD galaxies (e.g. Condon 1989), suggesting that at the highest redshifts we are observing these massive galaxies in their early stages of formation. While recently developed techniques of finding very distant star–forming galaxies (e.g. and band dropouts, Steidel et al. 1996) are yielding substantial galaxy populations at , radio galaxy samples remain the best means of finding, and studying, the most massive galaxies at the highest redshifts. Hiearchical galaxy formation scenarios suggest that these massive galaxies are assembled from smaller structures at relatively late cosmic epochs (e.g. Baron and White 1987). Observations of HzRGs may provide a unique opportunity to study the beginning of this process at the highest redshifts.
The parent galaxies of luminous radio sources (log ) at low redshift are consistenly identified with massive elliptical galaxies (e.g. Condon 1989). Detailed studies of nearby ellipticals, using both radio–quiet and radio–loud selected samples, furthermore suggest that their radio properties are, in a statistical sense, governed by the luminosities of their host galaxies (Ledlow & Owen 1995, 1996, and references therein). Confirming much earlier results by Auriemma et al. (1977), Ledlow & Owen conclude that the probability of detecting radio emission increases with optical luminosity, and that radio source activity is a transient and probably recurrent phenomenon which may occur in all elliptical galaxies at some time during their evolution. The rather dramatic difference in radio morphology between low luminosity (edge-darkened, FR I type; Fanaroff & Riley 1974) and high luminosity (edge-brightened, classical–double, FR II type) radio sources may be due to evolution of their parent galaxies and/or environment (Ledlow & Owen 1996), or to qualitative differences between their central engines and their accretion rates (Rees 1982; Baum, Zirbel, & O’dea 1995). The FR I / FR II dichotomy is probably not fundamentally related to the stellar content and mass of their parent galaxies. However, there are strong indications that the host galaxies of powerful FR II sources are most often associated with ellipticals that show some evidence for recent galaxy interactions. The dynamical disruption may force large–scale gas flows into the nucleus, stimulating it to greater activity (Heckman et al. 1986; Zirbel 1996).
Powerful radio galaxies, like other active galaxies, are relatively rare (e.g. Osterbrock 1989). The local space density of radio loud ellipticals (log ) is % that of normal galaxies (log ; Condon 1989). The utility of radio emission, much like line emission (with which it is usually strongly coupled), lies therefore in providing a convenient beacon for finding galaxies over a large range in redshift. If we assume that the relationship between radio luminosity and galaxy type holds true at high redshift, then radio surveys provide a means to systematically study giant elliptical galaxy evolution over large lookback times. Such an assumption is reasonable, given the surprisingly well–behaved relation for radio galaxies at (Lilly and Longair 1984; Eales et al. 1997), and the discovery of several radio galaxies at moderate redshift having ages consistent with an early formation epoch similar to that inferred for elliptical galaxies (Dunlop et al. 1996; Spinrad et al. 1997; Dey et al. 1997). Throughout this paper we will assume that the identification of powerful radio sources with massive elliptical galaxies holds true at high redshift.
Near–IR observations of HzRGs are useful for studying galaxy evolution for two important reasons. First, they allow us to observe the galaxies at the rest–frame optical (Å) where older stellar populations, if present, may dominate the observed emission. Second, the rest–frame UV morphologies of powerful radio galaxies at are aligned with the radio emission, evidently affected by the parent active galactic nucleus (AGN; McCarthy et al. 1987; Chambers, Miley, & van Breugel 1987). In the rest–frame optical, however, the alignment effect at is less pronounced (Rigler et al. 1992; McCarthy 1993), though still present in some systems (Eisenhardt & Chokshi 1990; Dunlop & Peacock 1993). The relatively quiescent diagram for HzRGs could be explained if the rest–frame optical light in most of the systems is dominated by a passively evolving stellar population formed at (e.g. Lilly & Longair 1984; Lilly 1989). This scenario implies that the rest–frame optical morphologies of most HzRGs may be dominated by light from stellar populations, not by scattered light or radiation from other non–stellar processes related to the AGN.
With the 10 m Keck telescopes it is now possible to obtain near–IR images with unprecedented sensitivity (23 mag arcsec-2 at in one hour at 4), allowing investigations of HzRGs in the rest–frame optical to z 4. In this paper we present deep near–IR imaging of 15 HzRGs with to investigate the evolution of radio galaxies at the highest redshifts. Because of the strong correlation between radio power and emission–line luminosity (McCarthy 1993; Zirbel & Baum 1995), the HzRG in our sample are likely to have strong [O II], [O III], and H lines. We have attempted to select galaxy/filter combinations that avoid strong line emission redshifted into the near–IR bands, to ensure that the observed light will be dominated by continuum emission. In §2 we present the observations, followed by a description of the results for individual systems in §3, and a discussion of evolutionary trends apparent in the sample in §4. In §5 we discuss the diagram for HzRGs. We also include an Appendix on 3C 257, providing basic optical and radio information on this powerful and distant radio galaxy.
Throughout this paper we adopt H km s-1 Mpc-1, q, and for easy comparison to previously published work on near–IR imaging of HzRGs ( Eales et al. 1997). The assumed cosmology implies a angular size scale of 1314 kpc arcsec-1 for the redshift range covered. For q the corresponding angular size scale is 14% – 33% less at these redshifts.
2 Observations and Data Reduction
The observations described herein were made using NIRC (Matthews et al. 1994) at the Keck I telescope with mostly photometric conditions and subarcsecond seeing (065 on average) in July 1994, January 1995, November 1996, and September 1997. NIRC contains a 256256 InSb array with a scale of 015 pix-1. The target exposures were taken using a nonredundant dithering pattern, with typical offsets between pointings of a few arcseconds. Integration times for each pointing were typically 60–120s comprised of 5–10 coadds, depending on the sky conditions and the wavelength of the observations. After bias subtraction, linearization, and flatfielding, the data were sky–subtracted, registered and summed using the DIMSUM11affiliation: DIMSUM is the Deep Infrared Mosaicing Software package, developed by P. Eisenhardt, M. Dickinson, A. Stanford, and J. Ward, which is available as a contributed package in IRAF. near–IR data reduction package. The photometry was flux calibrated via short observations of UKIRT faint standards, which, after a suitable transformation, yields magnitudes on the CIT system (Casali & Hawarden 1992). A summary of the observed objects, filters used, seeing, total integration times, and magnitudes is given in Table 1. Small and large apertures were used to measure magnitudes; the former to obtain higher signal–to–noise, and the latter for use in the diagram (see §5). While the seeing varies from the to bands, the effect on infrared aperture colors is small. In Table 1 we note the rest wavelengths corresponding to the observed bands, indicating when a strong emission line might contaminate the observed flux. The relevant radio parameters for our sources are presented in Table 2. While we include the IAU designations of the objects in the latter table, in general we use the common names listed in Table 1.
3 Notes on Individual Galaxies
Greyscale images of fields centered on the observed radio galaxies are shown in Figure 1 (Plates 1 — 4). The objects are ordered in decreasing redshift, and rotated such that the inner axes of the associated radio sources are aligned with the horizontal to allow straightforward assessment of the degree of radio/optical alignment (see Table 2 for the radio source position angles). To the upper right of each figure we provide a compass arrow indicating the cardinal directions. Each panel corresponds to an area of approximately at these redshifts. When an HzRG was observed in more than one band, we typically only present either the most line–free image or the longest wavelength image. We wish to focus on the majority of the sample for which the new data cover a spectral region above 4000Å in the rest–frame at which stellar continuum emission, in particular from older stars, when present, could dominate. The panels show a trend of decreasing overall complexity and size in the observed morphologies with decreasing redshift. The significance and possible interpretation of this trend is considered in §4.1. In this section we discuss the HzRGs individually.
6C 0140+326 at z = 4.41 (Rawlings et al. 1996), is the highest redshift radio galaxy known to date. Our observations in September 1997 were made during photometric conditions and 04 seeing. The image shows a faint, diffuse halo surrounding a bright, multi–component and elongated feature which is comparable in length (25, ) and aligned with the radio structure. Rawlings et al. suggest that the radio galaxy may be lensed by a foreground galaxy (labelled G in our image; ) only 16 away. Our image could contain [O II]3727 at the blue edge of the filter, where it would be passed at 20% of the transmission peak.
8C 1435+63 at z=4.251 (Lacy et al. 1994), was observed in both the and bands. The image presented in Plate 1 is a sum of the new 1920 observation with the 3480 observation reported in Spinrad, Dey, & Graham (1995, hereinafter SDG95). The system is very faint and diffuse at with emission seen over a 5 (70 kpc) long area. The morphology in the band is similar. When measured over the central , the resulting is consistent with the prediction of a “standard” (1 Gyr burst with solar metallicity and Salpeter IMF) passively–evolving Bruzual & Charlot (1997, hereinafter BC97) model for a formation redshift in our assumed cosmology. is sensitive to the age of a stellar population because it spans the 4000Å break at . SDG95 argue that the light is likely due to stars. Problematic to such an interpretation, however, is the fact that the near–IR morphology, like that of 6C 0140+326, is aligned with the radio axis, implying an unlikely connection between a moderately old stellar population (1.2 Gyr according to the BC97 model) and a short–lived radio source (typical ages yr).
4C 41.17 at z=3.800 (Chambers, Miley, and van Breugel 1990; Chambers et al. 1996), with emission at spread nonuniformly over a () area, is one of the largest HzRGs. We observed 4C 41.17 in the band to compliment the NIRC imaging reported in Graham et al. (1994). The morphologies are very similar and allow us to study the colors of 4C 41.17. The and Ks bands are free of strong emission lines, while and are contaminated by line emission from [O II] and H[O III], respectively. We find that both the radio aligned component, 4C 41.17–North (N in Plate 1), and its diffuse southern component, 4C 41.17–South (S in Plate 1; see also van Breugel et al. 1997, 1998), are very blue with = 0.8 and 1.0, respectively. Such blue colors at these redshifts are consistent with the predictions of models for young star forming systems (see also B2 0902+34, below).
4C 60.07 at z=3.790 (Chambers et al. 1996), was observed in both and . The system has a complex morphology, with clumpy emission in the central area almost aligned with the inner radio source (Chambers et al. 1996), surrounded by a diffuse, faint halo and a nearby companion, all spread out over a 6″ (84 kpc) long area. The -band image [not shown] suffers from a small contribution from the [O III] doublet at the upper edge of the passband and has slightly more pronounced filamentary features E and SW of the main body of the galaxy.
MG 2144+1928 at z=3.594 (Maxfield et al. 1997), was observed in the and bands to obtain color information, as well as the band to examine the contamination of emission lines to the other near–IR bands. It is one of the most elongated objects in our sample with a maximum size of 8″ (111 kpc). The emission–line free morphology is very diffuse, and aligned with the radio axis. Armus et al. (1997) present Keck/NIRC and narrow–band 2.3m images of this galaxy, where the latter targets the redshifted [O III] emission line. They find the galaxy to be extended along the radio axis and estimate that 35% of the total flux is contributed by the [O III] emission line.
4C 1243+036 at z=3.581 (van Ojik et al. 1996), has unusually diffuse IR emission aligned with the radio emission. The galaxy was observed in the and bands, as well as in a narrow–band “CO” filter covering 2.28–2.31. The narrow–band image was used to correct for any contamination from the [O III] doublet, which redshifts to 2.294 at . The [O III] flux was found to contribute only 10% of the observed band flux in the main two parts of the system over a 2″ 4″ area, indicating the morphology is dominated by continuum radiation. Both the band and narrow–band 2.3 images are presented in Plate 2. The object below the center may not be part of the system as it shows no [O III] emission. After correcting for the [O III] contribution, the morphology of the system in the observed band is similar to that seen in the line–free band image. The line–corrected colors of the radio galaxy are . The diffuse and faint emission extending over 5″ (70 kpc) to the NE of the main system is likely primarily due to continuum, since little [O III] emission is detected there.
B2 0902+34 at z=3.395 (Lilly 1988), occupies a special place in the history of HzRG studies as the first identified using near–IR techniques and the diagram (Lilly 1988). We observed it in the band because that is the only near–IR band free of a strong emission–line. As discussed in Eisenhardt & Dickinson (1992) and Eales et al. (1993), the [O III] doublet contributes a major fraction of the observed emission in the band, which suggests that the observed band would be strongly contaminated by [O II] emission. The band continuum morphology is very diffuse and clumpy, comparable to that of the HST WFPC2 F602W image of Eisenhardt et al. (1997) when the latter is smoothed to a similar resolution. The emission encompasses a area (), comparable to 4C 41.17, 4C 60.07, and 4C 1243+036. However, in B2 0902+34 there is no evidence for a strong radio–aligned component. This reinforces the suggestion by Eisenhardt & Dickinson (1993), on the basis of its line corrected and large diffuse structure, that B2 0902+34 is a young forming galaxy in which most of the rest–frame optical light is unaffected by the radio source.
B3 0744+464 at z=2.926 (McCarthy 1991), has a regular and compact structure in the image. McCarthy classifies this object as a broad–lined radio galaxy (BLRG) on the basis of broad C IV and C III] lines with narrow Ly and He II lines. Unfortunately, while the band imaging was obtained in the very good seeing (05), the band imaging suffers from by far the worst seeing (13) of our data. The magnitude presented in Table 1 was measured after convolution with a Gaussian to approximate the resolution of the band image. Although a de Vaucouleurs profile can be fit to the original band image, the profile appears nearly stellar (Figure 2; see below). Given its very blue , BLRG spectroscopic classification, and compact structure, B3 0744+464 appears to be dominated even in the near–IR by light from a strong AGN.
MRC 0943242 at z=2.922 (McCarthy et al. 1996; also TX 0943-242, Röttgering et al. 1995), presents a rest–frame optical structure with a centrally concentrated morphology. As seen in Figure 2, the surface brightness profile is somewhat rounded, which is consistent with the late stages of dynamical relaxation after a merger (Navarro et al. 1995). The maximum angular extent is 3″ (41 kpc) in the observed .
4C 28.58 at z=2.905 (Chambers et al. 1996), also has a more compact appearance compared to most of the higher redshift objects, with a maximum IR diameter of 3″ (41 kpc). The HST WF/PC image shown in Miley (1992) and Chambers et al. (1996) is clumpy, consisting of two bright rest–frame UV knots, which are separated by 1″ and lie along the radio axis. There is no clear one–to–one correspondence with the rest–frame optical structure seen in our near–IR image, except that it is generally aligned along the same axis. A small companion is seen 31 to the NW. Comparison with the optical images presented in Chambers et al. (1996) suggests that this companion is very red. The band profile of 4C 28.58may be intrinsically similar to those of the other HzRGs if the IR morphology of its central region is dominated by the same compact double system resolved in optical images by imaging (Miley 1992; Chambers et al. 1996).
MG 1019+0534 at z=2.765 (Dey, Spinrad, & Dickinson 1995, hereinafter DSD95), appears to consist of two galaxies engaged in a close encounter, indicated by an A and B in Plate 3 (following the nomenclature of DSD95). However, spectroscopy suggests component B to be a foreground object at while component A is identified as the HzRG (DSD95). The maximum extent at of the radio galaxy is 2″ (27 kpc). The surface brightness profile of the HzRG was determined after the foreground galaxy was removed by the subtraction of an artificial galaxy constructed from fitted ellipses.
TX 2202+128 at z=2.704 (Röttgering et al. 1997), has a smooth, compact morphology in the observed band image with a maximum size of 2″ or 27 kpc.
MRC 2025218 at z=2.630 (McCarthy et al. 1996), was observed in the band, to avoid including the redshifted H emission line, and also in the band. The morphology is compact and fairly symmetric, except for a faint plume approximately along the radio source axis. The maximum size is 41 (55 kpc). Previous imaging by McCarthy, Persson, & West (1992) found the near–IR colors somewhat red compared to a model with exponentially-declining star formation of time constant 1.5 Gyr (Bruzual 1983), but their low S/N measurements may well be contaminated by [O II], [O III]/H, and H respectively. Our new data give a in the same 4″ aperture, which is more consistent with the predicted color of a young population.
3C 257 at z=2.474 is the highest redshift radio galaxy in the 3C catalog. The redshift, determined from optical spectroscopy obtained by Spinrad and collaborators, is published herein for the first time (see Appendix). The observed band contains the line, while the band contains the [O III] doublet and the band contains the [O II] doublet. Nevertheless, the (rest–frame ) band light is fairly smooth, with a maximum size of 4″ (53 kpc), and a morphology resembling that of an elliptical galaxy. The band image, taken in non-photometric conditions, is still useful in determining whether there is any strong morphological wavelength dependence in the rest–frame optical (see §4.2 below).
MG 2121+1829 at z=1.861 (Stern et al. 1997), lies at the lower limit of the redshift range under consideration. The observed band samples a relatively red part of the optical rest–frame compared to the higher redshift radio galaxies. The morphology seen in Plate 3 has a maximum size of 2.5″ (32 kpc), but is not as centrally concentrated as the other radio galaxies.
4 HzRG Morphologies and Colors
The first systematic near–IR observations of radio galaxies showed that there is a surprisingly good correlation between band magnitudes and redshifts (Lilly & Longair 1984; Lilly 1989). This was interpreted as evidence that the rest–frame optical light in these objects is dominated by stellar populations evolving passively since their formation epoch at . Subsequent multi–band visual and near–IR photometry of larger samples of HzRGs, when compared to the theoretical spectral energy distributions from stellar population models, have supported the galaxy formation paradigm of Eggen, Lynden–Bell, & Sandage (1963; see McCarthy et al. 1992). The most direct estimates of high–redshift galaxy ages have been made for two low–power radio galaxies (Dunlop et al. 1996, Spinrad et al. 1997, Dey et al. 1997). When compared with a wide variety of models, spectroscopic measurements yield stellar ages of Gyr and in these objects, indicating that stellar populations in some galaxies formed at a time prior to the observation epoch of even the radio galaxies in our sample.
Our new imaging allows us to probe closer to the possible epoch of radio galaxy formation at the rest–frame optical wavelengths where relatively old stellar populations might dominate the observed emission. The sample presented in §3 allows us to begin addressing important questions about the formation of the first radio galaxies: 1) when do the first massive galaxies appear? 2) do these massive galaxies evolve into giant ellipticals? 3) is there evidence for morphological evolution over the redshift range of our sample in their rest–frame optical light? and 4) does the relationship continue at the highest redshifts are the galaxies already on a passive evolution track at z 4?
4.1 Morphological Evolution: Evidence of Massive Forming Ellipticals?
Our observations show that at the highest redshifts, , the rest–frame visual morphologies exhibit structure on at least two different scales. They often consist of several relatively bright, –size (10 kpc) components, which are surrounded by very extended (50 100 kpc) diffuse emission (particularly 4C 41.17, 4C 60.07, 4C 1243+036, and B2 0902+34). The individual component luminosities are to , and the brightest are often aligned with the radio sources. The total HzRG luminosities, including the low surface brightness large scale emission, are to (Table 3). For comparison, present–epoch L⋆ galaxies and, perhaps more appropriately, ultraluminous infrared starburst galaxies, have on average (Binggeli, Sandage & Tamman 1988; Sanders & Mirabel 1996), while brightest cluster galaxies in the local universe have . For objects where such data are available, our observations show that the integrated, line–free colors (, , or ) of the galaxies are very blue, consistent with the BC97 predictions for a stellar population formed at .
The linear sizes and luminosities of individual HzRG components are similar to the total sizes and luminosities of normal, radio–quiet, galaxies at which have been discovered in the Hubble Deep Field (, Williams et al. 1996) using the or -band dropout technique (Steidel et al. 1996; Lowenthal et al. 1997; Trager et al. 1997). Most of these galaxies show subclumping at the resolution ( at these redshifts), and have deduced star formation rates of M☉ yr-1. Recent images of a number of HzRGs have shown that the individual kpc size HzRG components also are resolved into smaller, kpc scale structures (van Breugel et al. 1997, 1998; Pentericci et al. 1998; Chambers et al. 1996; Miley 1992).
It appears therefore that the parent galaxies of radio sources have total sizes and luminosities which are several times those of normal, radio–quiet galaxies at similar high redshifts, but also that they show compact structures on similar linear scales. These results suggest that the HzRGs evolve into much more massive systems than the radio–quiet galaxies and that they are qualitatively consistent with models in which such galaxies form in hierarchical fashion through the merging of smaller star–forming systems. A possible problem with this scenario, if the HzRGs are indeed the progenitors of massive 1012 M☉ ellipticals, is that in standard hierarchical cold dark matter models such large systems are thought to form relatively late, at much lower redshifts ( Kauffmann, White, & Guiderdoni 1993).
The presence of relatively luminous to sub–components, which are aligned with the radio sources in most of the galaxies, suggests a causal connection with the AGN. The most popular explanations for such an alignment effect, which is most prominent at rest–frame UV wavelengths, include induced star formation, scattered light from a hidden quasar, and nebular continuum emission (e.g. McCarthy 1993; Dickson et al. 1995). Detailed Keck spectropolarimetry and WFPC2 images of the radio–aligned component in 4C 41.17–N at have shown that the rest-frame UV continuum is dominated by jet–induced star formation (Dey et al. 1997; van Breugel et al. 1997), and that the contribution from any scattered AGN light must be small. This suggests that jet–induced star formation may also be an important process in the other radio galaxies, and that even at the rest–frame optical wavelengths of our observations (Å) the emission in the radio–aligned features may be dominated by hot, young stars.
At lower redshifts, , the rest–frame optical morphologies become smoother, smaller, more centrally concentrated, and less aligned with the radio structure. To quantify the visual contrast of their morphologies with those of the HzRG, we have calculated the ratio of the average flux at and for each of the HzRGs. The average value of these contrast ratios is 4.7 at and 19.1 at . We have also attempted to describe the IR sizes by measuring the area of the emission regions associated with the HzRGs as shown in Figure 1 (except for 4C 41.17 where we used the image). The areas are listed in Tables 3 and 4; the average surface brightnesses (-corrected to the rest band; see below) within this area for the objects are also given in Table 3. The observations of the higher redshift objects do not go deep enough, relative to the surface brightness limit of the observations, to make up for the expected cosmological dimming. However, the point illustrated by the sizes in Table 3 vs those in Table 4 is that the objects are generally much larger than those at . If our imaging of the objects were deeper, the measured sizes of these HzRGs would only become larger still. The two measures described here confirm the visual impression, generated by inspection of Figure 1, that HzRGs undergo dramatic morphological evolution with redshift in the rest frame optical.
This result could be subject to several selection effects. The images shown in Figure 1 sample differing rest–frame spectral regions as a function of redshift, band at and band at . In present epoch galaxies, there is little difference between rest–frame and band morphologies of massive galaxies. In the HzRGs one might expect enhanced star formation would yield increased morphological differences. To explore this question, we have observed two of the HzRGs both in the band and a shorter wavelength infrared passband ( for 3C 257, for MRC 2025-218). The shorter wavelength passbands sample a similar rest wavelength as do the band images of the HzRGs. In Figure 1d we present the multi–wavelength near–IR images of these two galaxies. The general similarity of each of these two HzRGs at rest and , indicates that the change with redshift in the HzRG near–IR images is not simply due to a morphological –correction.
We also should consider if a redshift–radio power dependence biases our analysis and the inferred morphological evolution. Most of the 365 MHz radio luminosities are within a factor of 2.5 of the mean radio luminosity, log , where is the flux at 365 MHz measured in the units of erg s-1 Hz-1. The average 365 MHz radio luminosity of the and radio galaxies differs only by a factor of 4 (see Table 2). This relatively small dispersion coupled with the profound morphological differences between 6C 0140+326 and 3C 257, both having log but spanning a redshift range of 2.5 to 4.4, indicates that the range in radio power for the sample has relatively mild impact on the strong morphological evolution reported.
We have also briefly investigated the possibility that the near–IR compactness of the HzRGs may be enhanced by relatively large contributions from AGN (e.g. see McCarthy et al. 1992). None of the objects stands out in the diagram with a band excess (see below), though the scatter is quite large, limiting the utility of this test. Assuming that the radio core fraction (CF in Table 2), defined as the ratio of the core to total radio flux density, is a measure of AGN activity, one might expect that objects with relatively strong radio cores would be more highly nucleated in the near–IR images. This trend is generally not observed. One apparent exception is B3 0744+464, which has a BLRG spectrum (McCarthy 1991) and is very blue in . Its nearly unresolved band morphology may be dominated by an AGN. Higher spatial resolution observations with NICMOS on HST of this and other compact HzRGs will help to determine the actual AGN contribution in the rest frame optical.
We conclude that the evolution from large, diffuse, multi–component, and predominantly aligned morphologies at to centrally concentrated elliptical-like galaxies at suggests that at the highest redshifts the radio sources more strongly affect the appearances of their parent galaxies, possibly due to induced star formation in the dense proto–galactic media. At , this effect becomes less important and the overall galaxy formation process of merging sub–components results in the rounder, more symmetric structures, at least when seen at rest–frame optical wavelengths. This provides qualitative support for hierarchical galaxy evolution models in which massive galaxies form through merging of sub–galactic stellar systems (e.g. Baron & White 1987). According to dynamical simulations, soon after merging, the morphology becomes centrally concentrated and similar to that of an elliptical galaxy (e.g. Barnes & Hernquist 1994).
4.2 Surface Brightness Profiles
Surface brightness profiles of the galaxies were measured in the near–IR images using the STSDAS ellipse task. The profiles are generated by fitting elliptical isophotes to the data, with the center, ellipticity and position angle of each ellipse allowed to vary. The iterative method used in the fitting of each ellipse is described more fully in Jedrzejewski (1987). The surface brightness profiles are shown in Figure 2, except for 6C 0140+326 and 4C 1243+363, where nearby bright objects caused too much confusion to obtain useful profiles. As already suggested by their morphologies in Figure 1, the surface brightness profiles of the radio galaxies are fairly flat. No attempt was made to fit the profiles with the standard galaxy functional forms. All of the profiles are resolved, with significant light well beyond the radius of the seeing disk. The FWHM of a Gaussian fit to a star in the NIRC images ranged from 04 08, except for the band image of B3 0744+464.
The host galaxy profiles in (Figure 2) have steeper profiles than those of the radio galaxies. We attempted to fit the surface brightness profiles with a de Vaucouleurs r1/4 law and with an exponential law, the forms commonly used to fit elliptical and spiral galaxy profiles, respectively. We demonstrate the fitting for our best resolved object at , 3C 257 at , in Figure 3. Within the limited dynamical range of the data, both functional forms fit the observed profiles—neither is preferred. In the case of B3 0744+464, shown in Figure 2, the band profile is indistinguishable from that of a star.
To transform our observed near–IR magnitudes to the rest–frame (for ) and () bands we used the BC97 population synthesis models. The –corrections for the observed large–aperture band magnitudes were calculated using a model with all the stars formed in a 1 Gyr burst, with solar metallicity and a Salpeter initial mass function, for = 7. The form of the –correction is described by Humason, Mayall, & Sandage (1956). Uncertainties in formation redshift and assumed cosmology result in uncertainty in the –correction. For example, a 1 Gyr change in model age for an object at results in a mag change. This uncertainty, however, grows very quickly with increasing redshift, particularly for higher H0 and/or q0 cosmologies in which the time between the formation epoch and the observed epoch is severely attenuated. B2 0902+34 was only observed in the band, so there is a relatively larger uncertainty in the calculated due to the larger wavelength separation between the observed and rest frame bands. The resulting estimates of the total rest–frame optical luminosities of the HzRGs, shown in Tables 3 and 4, are 3–5 magnitudes more luminous than present epoch L⋆ galaxies, which have M and M (Binggeli, Sandage, & Tamman 1988).
4.3 Linear Radio/IR Size Evolution
In Figure 4 we plot the log of the ratio of the radio and near–IR lengths against redshift. The IR lengths are defined to be the long axis of the band emission for those objects showing the alignment effect, and the diameter for the circularly symmetric objects. The radio lengths are measured as the distance between the two hot spots on either side of the nucleus. For most of the HzRGs have comparable radio and IR sizes. The exceptions are 4C 41.17 and 4C 60.07, but even in these objects a large fraction of their radio emission (60% and 40% respectively at 1.5 GHz) is confined within their parent, elongated galaxies (Chambers et al. 1996). Although the sample is small and the uncertainties large it appears that there is a tendency for the radio sources to be comparable in size to their aligned galaxy components at , and systematically larger to the host galaxies in the IR at , the exception being MG 1019+0534 which is confused by a nearby object of similar brightness in the observed IR.
A possible interpretation is that at the radio sources are strongly interacting with very dense ambient gas, triggering star formation along the radio axis while in the more evolved and less gas–rich galaxies at , such jet-induced star formation is much weaker. A strong radio/optical size anti–correlation has been found in radio galaxies (Best, Longair, & Röttgering 1996). Since at such relatively low- the galaxies are more–or–less coeval, this has been interpreted as stemming from jet–induced star formation and the subsequent dimming of the young stellar population as the radio sources become older and larger. Alternative explanations which might apply are related to scattered light from hidden quasars, which appear to be common in radio galaxies (e.g. Cimatti et al. 1996, 1997; Dey et al. 1996).
5 The HzRG K–z Diagram
Recent near–IR observations of flux–limited samples of HzRGs with a range in radio luminosities have been interpreted in terms of a possible radio power– dependence in the diagram, as well as an increase in the magnitude dispersion with redshift (Eales et al. 1997). Investigations of dependencies between radio and optical/near–IR parameters (e.g. radio power, spectral index, spectral curvature; accuracy of radio/optical/near–IR alignments; the fractional contribution of the aligned UV flux to the flux at 5000Å) have resulted in a number of possible correlations, as well as speculative interpretations (Lilly 1989; Dunlop & Peacock 1993; Eales et al. 1997). General agreement, however, seems to exist that the strength of the alignment effect depends on the power of the radio sources and that the most luminous radio galaxies may be too extreme in their rest–frame optical properties to allow an unbiased study of their stellar populations in the band, while lower power HzRGs may inhabit galaxies which are less affected by their resident AGN. We turn next to the Hubble diagram to further compare the low and high power HzRGs.
A diagram is presented in Figure 5, combining our new band photometry with 3C and 6C data from Eales et al. (1997). We have followed the same photometric procedures described in Eales et al. to ensure that all magnitudes are on the same metric system. There is some uncertainty in the highest redshift point (6C 0140+326) because of possible gravitational lensing (Rawlings et al. 1996). As for the rest of the objects in our sample, only 3 of the 14 HzRGs in our sample with band data suffer from serious line emission contamination which might affect their placement in the diagram. It is interesting to note that for 3C 257, which most diverges from the Hubble relation in our sample, Eales & Rawlings (1996) estimate a 35% emission line contribution to the flux. One could imagine that, as in the case of 3C 257, correcting the magnitudes for strong line emission could lead to an even tighter relation in the diagram.
Our new data fall on a reasonable extrapolation of the relation as defined by the lower redshift data. The 6C points appear to have a slightly steeper slope in the range compared to the other objects in Figure 5. The radio luminosities of our NIRC sample are comparable to those of the 6C sample reported in Eales et al. (1997). The main difference between the two samples is that nearly all our objects are from samples which were selected to have radio sources with steep radio spectra (“red radio colors”, with ; ). Also, the 6C sample of Eales et al. has a somewhat lower average redshift than the heterogeneous sample defined by our NIRC data.
If the trend suggested by the slight divergence of the 6C and our NIRC samples in the diagrams is real, it may be due to the possibility that aligned structures in the HzRGs may boost the total star formation rates of their host galaxies during the earliest stages. In the case of 4C 41.17 (Dey et al. 1997), jet–induced star formation may temporarily, during the lifetime of the radio source, add as much as 30% to the total star formation rate of the entire galaxy system, and as much as to the total stellar population (van Breugel et al. 1998). If radio source activity is recurrent, as is likely since it is presumably related to regular feeding of massive black holes through gas rich merger events, then the cumulative effect of jet–induced star formation may add even more to the total stellar population during the formative time of these galaxies (the first 1 Gyr). Correction of the -band values for the enhanced star formation by the radio sources might make these 0.5—1 magnitudes fainter, driving them more in line with the relation described by the lower redshift 6C objects.
Induced star formation will be significant only if large amounts of cool gas in the form of dense clouds are encountered by the radio source. If this is not the case, for example because the proto–galaxy is predominantly disk–shaped rather than spherical and the radio-source axis is by chance directed at a large angle to this disk, then star formation in this galaxy is little enhanced by the radio source outflow (as may be true in B2 0902+34), compared to cases where radio jets are propagating more within the galaxy disks (possibly the case in 4C 41.17 and 4C 1243+036). Furthermore, radio power is at least indirectly related to the inter–cloud density of its ambient medium because of the greater confinement pressure provided (McCarthy, van Breugel, & Kapahi 1991; Eales 1992). Thus, both the stellar luminosity of the galaxy and the power of the radio source will depend on the morphology, density, and inhomogeneity of the gaseous proto–galactic medium, as well as the age and duty cycle of the radio source. The result could be large enough variations in the magnitudes of HzRGs to explain the dispersion, as well as a possible radio power dependence, in the diagram.
6 Conclusions
Our near–IR observations of HzRGs show significant evolution in the rest–frame optical ( 4000—5000Å) morphologies of HzRGs. At the morphologies exhibit structure on at least two different scales: relatively bright, compact components with typical sizes of 10 kpc surrounded by large–scale (50 100 kpc) faint and diffuse emission. The brightest components are often aligned with the radio sources, and have individual luminosities to , comparable to nearby L⋆ galaxies. These morphologies change considerably towards lower redshifts, and at the HzRGs have smooth and much more compact structures, with decreased radio–optical alignment. The lower redshift objects have shapes resembling elliptical galaxies. Analysis of their surface brightness shows that our spatial resolution and dynamic range are insufficient to clearly discriminate between elliptical (r1/4) or disk (exponential) profiles. Because of the absence of strongly radio–aligned, rest–frame optical features in the HzRGs, spectroscopic age determinations at Å of the stellar populations in these systems may provide useful constraints on the formation epoch of the stellar populations in these massive systems. Such observations may become feasible with the advent of near–IR spectrographs on 10–m class telescopes.
We have found some evidence that most of the radio sources and their host galaxies are comparable in size and are aligned, while the radio sources appear systematically larger (in a relative sense) and are not aligned. We interpret this possible lack of a correlation in the radio and optical size evolution, as well as the simultaneous change from predominantly aligned to non–aligned structure, as evidence that the radio sources are interacting strongly with the dense gaseous media of their forming galaxies, boosting the overall star formation rate. In the more evolved and less gas rich ellipticals at the radio sources do not affect their stellar populations significantly. We suggest that the temporary effects of radio source activity, as well as inhomogeneities in the gaseous media of their forming galaxies, might explain the dispersion and possible radio luminosity dependence in the diagram at the highest redshifts.
Appendix A Appendix
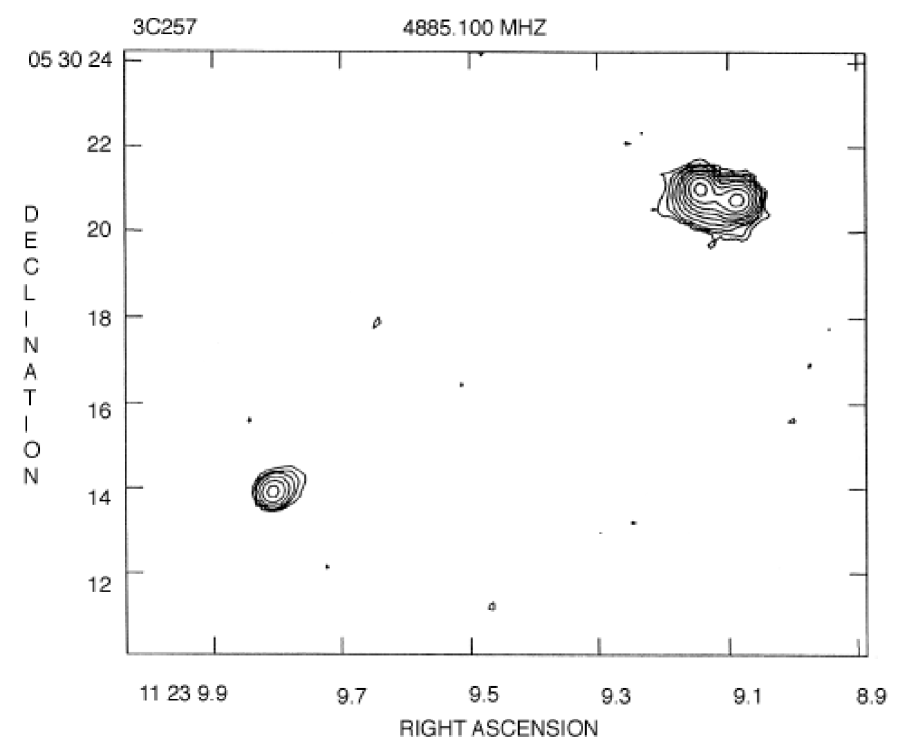
3C 257, at is the highest redshift galaxy in the 3C catalog and among the highest radio luminosity sources known (see Table 2). We publish herein for the first time a radio map, finding chart, and redshift for this interesting source.
A 04 resolution radio map at 4885 MHz (6.1 cm) is shown in Figure 6. The source was also observed with 130 resolution at 1465 MHz (20.5 cm) and 4885 MHz (6.1 cm) which we use to calculate an accurate radio spectral index. These observations reveal no additional radio structure but show that the two lobes are very asymmetric in radio brightness and spectral index (see Table 5), and a exhibit a large rest–frame rotation measure for the Sf lobe (see Table 5). The radio lobe separation is approximately 12″.
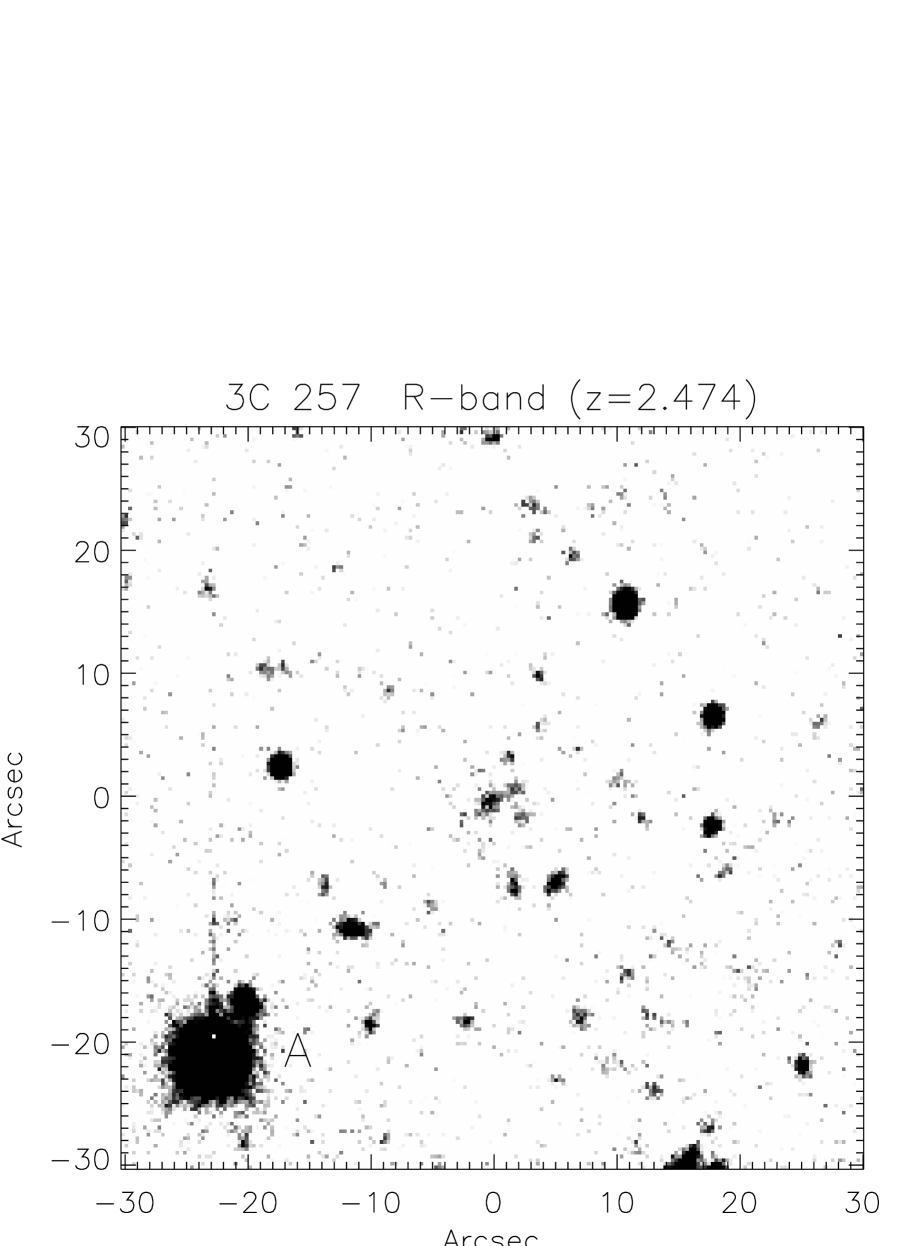
In Figure 7 we present a finding chart for 3C 257. The optical identification of the radio galaxy was done Spinrad and collaborators and lies approximately midway between the radio lobes. Typical of HzRGs, the optical (rest–frame UV) host galaxy is aligned with the radio axis. Optical spectroscopy and redshift identification was also obtained by Spinrad and collaborators using the Lick Observatory 3m, MMT, KPNO 4m, and Palomar 5m telescopes over a period of several years. In Table 5 we present the observed emission lines and implied redshift. The Ly line is broad and diffuse spatially, with a flux of erg cm-2 s-1 and a rest–frame equivalent width of 100 Å.
References
- (1)
- (2) Armus, L. et al. 1997, astro-ph/9709292
- (3) Auriemma, C.G. et al. 1977, A&A, 57, 41
- (4) Baron, E. & White, S.D.M. 1987, ApJ, 322, 585
- (5) Barnes, J.E., & Hernquist, L. 1992, ARA&A, 30, 705
- (6) Baum, S.A., Zirbel, E.L., & O’Dea, C.P. 1995, ApJ, 451, 88
- (7) Best, P.N., Longair, M.S., & Röttgering, H.J.A. 1996, MNRAS, 280, 9
- (8) Binggeli, B., Sandage, A., & Tammann, G.A. 1988, ARA&A, 26, 509
- (9) Bruzual, A.G., & Charlot, S. 1997, in preparation (BC97)
- (10) Bruzual, A.G. 1983, ApJ, 273, 105
- (11) Casali, M.M., & Hawarden, T.G. 1992, JCMT-UKIRT Newsletter, 4, 33
- (12) Chambers, K.C., Miley, G.K., van Breugel, W.J.M., Bremer, M.A.R., Huang, J.-S., & Trentham, N.A. 1996, ApJS, 106, 215
- (13) Chambers, K.C., Miley, G.K., van Breugel, W.J.M., & Huang, J.-S. 1996, ApJS, 106, 247
- (14) Chambers, K.C., Miley, G.K., & van Breugel, W. 1990, ApJ, 363, 21
- (15) Chambers, K.C., Miley, G.K., & van Breugel, W. 1987, Nature, 329, 604
- (16) Cimatti, A., Dey, A., van Breugel, W., Hurt, T., & Antonucci, R. 1997, ApJ, 476, 677
- (17) Cimatti, A., Dey, A., van Breugel, W., Antonucci, R., & Spinrad, H. 1996, ApJ, 475, 145
- (18) Condon, J.J. 1989, ApJ, 338, 13
- (19) Condon, J.J., Cotton, W.D., Greisen, E.W., Yin, Q.F., Perley, R.A., Taylor, G.B., & Broderick, J.J. 1997, preprint
- (20) De Breuck, C. et al. 1997, Proc. Radio Surveys Workshop, Tenerife Sp., ed. M. Bremer, Kluwer
- (21) Dey, A., Spinrad, H., & Dickinson, M. 1995, ApJ, 440, 515 (DSD95)
- (22) Dey, A., Cimatti, A., van Breugel, W., Antonucci, R., & Spinrad, H. 1996, ApJ, 465, 157
- (23) Dey, A., van Breugel, W.J.M., Vacca, W., & Antonucci, R. 1997, ApJ, 490, 698
- (24) Dey, A. et al. 1997, in preparation
- (25) Dickinson, M. 1997 Proc. Galaxy Scaling Relations: Origins, Evolution and Applications, ESO, Munich, astro-ph/9703035
- (26) Dickson, T., Tadhunter, C., Shaw, M., Clark, N. & Morganti, R. 1995, MNRAS, 273, L29
- (27) Douglas, J.N., Bash, F.N., Bozyan, F.A., Torrence, G.W., & Wolfe, C. 1996, AJ, 111, 1945
- (28) Dunlop, J., Peacock, J., Spinrad, H., Stern, D., & Windhorst, R.A. 1996, Nature, 381, 581
- (29) Dunlop, J. & Peacock, J. 1993, MNRAS, 263, 936
- (30) Eales, S., Rawlings, S., Law-Green, D., Cotter, G., & Lacy, M. 1997, astro-ph/9701023
- (31) Eales, S., Rawlings, S., Puxley, P., Rocca-Volmerange, B., & Kuntz, K. 1993, Nature, 363, 140
- (32) Eggen, O.J., Lynden-Bell, D., & Sandage, A.R. 1963, ApJ, 136, 748
- (33) Eisenhardt, P. 1997, private communication
- (34) Eisenhardt, P. & Dickinson, M. 1992, ApJ, 399, L47
- (35) Eisenhardt, P. & Chokshi, A. 1990, ApJ, 351, L9
- (36) Fanaroff, B.L. & Riley, J.M. 1974, MNRAS, 167, 31P
- (37) Freeman, K.C. 1970, ApJ, 160, 811
- (38) Graham, J.R., Matthews, K., Soifer, B.T., Nelson, J.E., Harrison, W., Jernigan, J.G., Lin, S., Neugebauer, G., Smith, G. & Ziomkowski, C. 1994, ApJ, 420, L5
- (39) Humason, M.L., Mayall, N.U., & Sandage, A.R. 1956, AJ, 61, 97
- (40) Jedrzejewski, R.I. 1987, MNRAS, 226, 747
- (41) Kauffmann, G., White, S.D.M., & Guiderdoni, B. 1993, MNRAS, 264, 201
- (42) Kormendy, J. 1977, ApJ, 218, 333
- (43) Lacy, M., Miley, G.K., Rawlings, S. Saunders, R., Dickinson, M., Garrington, S., Madox, S., Pooley, G., Steidel, C.C., Bremer, M.N., Cotter, G., van Ojik, R., Röttgering, H. & Warner, P. 1994, MNRAS, 271, 504
- (44) Ledlow, M.J., & Owen, F. 1995, AJ, 110, 1959
- (45) Ledlow, M.J., & Owen, F. 1996, AJ, 112, 9
- (46) Lilly, S.J. 1989, ApJ, 340, 77
- (47) Lilly, S.J. 1988, ApJ, 333, 161
- (48) Lilly, S.J. & Longair, M. 1984, MNRAS, 211, 833
- (49) Lowenthal, J.D., Koo, D.C., Guzman, R., Gallego, J., Phillips, A.C., Faber, S.M., Vogt, N.C., Illingworth, G.D., Gronwall, C. 1997, ApJ, 481, 673
- (50) Mathews, K., & Soifer, B.T. 1994, in Proc. Infrared Astronomy with Arrays: The Next Generation, ed. I. McClean (Dordrecht: Kluwer), 239
- (51) Maxfield, L.M. et al. 1997, in preparation
- (52) McCarthy, P.J., Kapahi, V.K., van Breugel, W.J.M., Persson, S.E., Athreya, R.M. & Subrahmanya, C.R. 1996, ApJS, 107, 19
- (53) McCarthy, P.J. 1993, ARA&A, 31, 639
- (54) McCarthy, P.J. 1993, PASP, 105, 1051
- (55) McCarthy, P.J., Persson, S.E., & West, S.C. 1992, ApJ, 386, 52
- (56) McCarthy, P.J. 1991, AJ, 102, 518
- (57) McCarthy, P.J., van Breugel, W.J.M., Spinrad, H. & Djorgovski, S. 1987, ApJ, 321, 29
- (58) Miley, G.K. 1992, Proc. ST-ECF Workshop ’Science with the Hubble Space Telescope, Sardinia, Italy, ed. P. Benvenuti and E. Schreier, ESO Proc. 44
- (59) Navarro, J.F., Frenk, C.S. & White, S.D.M. 1995, MNRAS, 275, 56
- (60) Osterbrock, D.E. 1989 Astrophysics of Gaseous Nebulae and Active Galactic Nuclei (Mill Valley: University Science Books, 310
- (61) Pentericci, L. et al. 1997, ApJ, submitted
- (62) Rawlings, S., Lacy, M., Blundell, K.M., Eales, S.A., Bunker, A.J. & Garrington, S.T. 1996, Nature, 383, 502
- (63) Rees, M., Begelman, M., Blandford, R., & Phinney, E. 1982, Nature, 295, 17
- (64) Rigler, M., Stockton, A., Lilly, S.J., Hammer, F., & le Fevre, O. 1992, ApJ, 385, 61
- (65) Röttgering H.J.A., Hunstead, R.W., Miley, G.K., van Ojik, R. & Wieringa, M.H. 1995, MNRAS, 277, 389
- (66) Sanders, D.B. & Mirabel, I.F. 1996, ARA&A, 34, 749
- (67) Sandage, A. & Perelmutter, J.-M. 1990, ApJ, 361, 1
- (68) Spinrad, H., Dey, A., & Graham, J. 1995, ApJ, 438, 51 (SDG95)
- (69) Spinrad, H., Dey, A., Stern, D., Dunlop, J., Peacock, J., Jimenez, R., & Windhorst, R. 1997, ApJ, 484, 581
- (70) Steidel, C.C., Giavalisco, M., Pettini, M., Dickinson, M., & Adelberger, K.L. 1996, AJ, 112, 352
- (71) Stern, D., Dey, A., & Spinrad, H. 1997, in preparation
- (72) Trager, S.C., Faber, S.M., Dressler, A., & Oemler, A., Jr. 1997, ApJ, 485, 92
- (73) van Breugel, W.J.M., Miley, G.K., McCarthy, P.J. & Spinrad, H. 1997, in “The Hubble Space Telescope and the High Redshift Universe”, p. 369, Cambridge, United Kingdom, ed. N.R. Tanvir, A. Aragon-Salamanca and J.V. Wall, World Scientific Publ. Co.
- (74) van Breugel, W.J.M. et al. 1998, in “The Most Distant Radio Galaxies”, in press, Reidel Publ. Co., The Netherlands, ed. P. Best, H. Röttgering and M. Lehnert,
- (75) Röttgering, H.J.A., van Ojik, R., Miley, G.K., Chambers, K.C., & van Breugel, W.J.M. 1997, A&A, 317, 358
- (76) van Ojik, R., Röttgering, H.J.A., Carilli, C.L., Miley, G.K., Bremer, M.N., & Macchetto, F. 1996, A&A, 313, 25
- (77) Williams, R.E. et al. 1996, AJ, 112, 1335
- (78) Zirbel, E.L. & Baum, S.A. 1995, ApJ, 448, 521
- (79) Zirbel, E.L. 1996, ApJ, 473, 713
- (80)
| Object | z | Filter | Mag | Mag | Seeing | Exp. | Rest | Notes |
|---|---|---|---|---|---|---|---|---|
| 2″ | 8″ | ″ | s | |||||
| 6C 0140+326 | 4.41 | 20.7 | 20.0 | 0.41 | 3840 | 3677-4486 | includes [O II] | |
| 8C 1435+635 | 4.251 | 20.1 | 19.5 | 0.6ccEstimated seeing; no stars in field. | 5760aaTotal exposure after coadding new data with a 3480 observation by SDG95. | 3809-4622 | ||
| 21.0 | 0.6ccEstimated seeing; no stars in field. | 3600 | 2840-3474 | very faint | ||||
| 4C 41.17 | 3.800 | 20.7 | 19.2 | 0.87 | 2372 | 4146-4833 | ||
| 21.1 | 0.69 | 3300 | 2302-2910 | |||||
| 4C 60.07 | 3.790 | 19.9 | 0.65 | 2000 | 4175-5067 | [O III] at edge | ||
| 20.1 | 19.3 | 0.65 | 3660 | 4081-4785 | ||||
| MG 2144+192 | 3.594 | 19.9 | 0.62 | 3840 | 4354-5283 | includes [O III] | ||
| 20.4 | 19.2 | 0.65 | 2760 | 4256-4989 | ||||
| 20.5 | 0.74 | 3600 | 3246-3970 | includes [O II] | ||||
| 4C 1243+036 | 3.581 | 19.8bbCorrected for [O III] emission (see §3). | 19.3bbCorrected for [O III] emission (see §3). | 0.81 | 3000 | 4366-5298 | includes [O III] | |
| CO | 0.60 | 3000 | 4985-5045 | [O III] | ||||
| 22.1 | 0.63 | 3000 | 2412-3050 | |||||
| B2 0902+34 | 3.395 | 22.7: | 21.3: | 0.73 | 4900 | 2514-3179 | very diffuse | |
| B3 0744+464 | 2.926 | 18.9 | 18.5 | 1.30 | 600 | 5069-5909 | ||
| 20.4 | 0.50 | 1250 | 2815-3558 | |||||
| MRC 0943242 | 2.922 | 19.4 | 19.2 | 0.87 | 1000 | 5128-6223 | TX also | |
| 4C 28.58 | 2.905 | 19.6 | 18.7 | 0.73 | 1800 | 5122-6215 | ||
| MG 1019+0534 | 2.765 | 19.9 | 19.1 | 0.6ccEstimated seeing; no stars in field. | 2000 | 5312-6446 | superposition | |
| TX 2202+128 | 2.704 | 18.6 | 18.4 | 0.83 | 1320 | 5400-6552 | ||
| MRC 2025218 | 2.630 | 19.0 | 18.5 | 0.77 | 2520 | 5386-6314 | ||
| 19.9 | 0.48 | 1800 | 3044-3719 | |||||
| 3C 257 | 2.474 | 18.4 | 17.8 | 0.75 | 2000 | 5757-6986 | includes H | |
| 0.79 | 1350 | 4292-5181 | includes [O III] | |||||
| MG 2121+1839 | 1.861 | 19.8 | 18.7 | 0.63 | 1560 | 6991-8483 |
| Cat | Name | Common | S365 | S1400 | CF | Size | PA | Ref | log L365 | ||
|---|---|---|---|---|---|---|---|---|---|---|---|
| J2000 | Name | mJy | mJy | % | ″ | ∘ | O,R | ||||
| 6C | 0143+3253 | 6C 0140+326 | 4.41 | 451 | 92 | 1.19 | 0.0 | 2.6 | 102 | Ra,Ra | 36.73 |
| 8C | 1436+6319 | 8C 1435+635 | 4.251 | 2823 | 498 | 1.29 | 3.3 | 4.3 | 155 | La,La | 37.54 |
| 4C | 0650+4130 | 4C 41.17 | 3.800 | 1113 | 266 | 1.07 | 0.6 | 10 | 78 | Ch,Ca | 36.81 |
| 4C | 0512+6030 | 4C 60.07 | 3.790 | 1120 | 157 | 1.46 | 2.1 | 9.0 | 98 | Ch,Ca | 37.08 |
| MG | 2144+1929 | MG2144+1929 | 3.594 | 1730 | 344 | 1.20 | 0.0 | 8.9 | 177 | Ma,Ca | 37.01 |
| 4C | 1245+0323 | 4C 1243+036 | 3.581 | 1947 | 375 | 1.23 | 1.0 | 7.4 | 145 | Oj,Oj | 37.07 |
| B2 | 0905+3407 | B2 0902+34 | 3.395 | 1129 | 335 | 0.90 | 6.6 | 6.5 | 142 | Li,Ca | 36.55 |
| B3 | 0747+4618 | B3 0744+464 | 2.926 | 1851 | 503 | 0.97 | 1.2 | 1.9 | 92 | M1,Ca | 36.60 |
| MRC | 09452428 | MRC0943242 | 2.922 | 1296 | 272 | 1.16 | 0.0 | 3.9 | 73 | M2,Ca | 36.56 |
| 4C | 2351+2910 | 4C 28.58 | 2.905 | 1704 | 262 | 1.39 | 2.1 | 17 | 144 | Ch,Ca | 36.80 |
| MG | 1019+0534 | MG1019+0534 | 2.765 | 925 | 395 | 0.63 | 5.8 | 1.3 | 105 | De,De | 36.02 |
| TX | 2205+1305 | TX2202+128 | 2.704 | 839 | 198 | 1.07 | 0.9 | 4.2 | 72 | Ro,Ca | 36.20 |
| MRC | 20272140 | MRC2025218 | 2.630 | 1280 | 342 | 0.98 | 0.7 | 5.1 | 17 | M2,Ca | 36.30 |
| 3C | 1123+0530 | 3C 257 | 2.474 | 5648 | 1784 | 0.86 | 0.0 | 13 | 124 | Sp,vB | 36.83 |
| MG | 2121+1839 | MG2121+1839 | 1.861 | 922 | 242 | 0.99 | 0.0 | 6 | 145 | St,St | 35.68 |
Note. — Columns: S365 = radio flux density at 365 MHz (University of Texas survey; Douglas et al. 1996); S1400 = radio flux density at 1400 MHz (NVSS; Condon et al. 1997) = radio spectral index between 365 MHz and 1.4 GHz, ; CF = radio core / total fraction; Size = maximum radio source size; PA = radio source postion angle. Ref = references to optical (O) and Radio (R) data: Ca = Carilli et al. 1997; Ch = Chambers et al. 1996; De = Dey et al. 1995; La = Lacy et al. 1994; Li = Lilly 1988; Maxfield et al. 1997; M1 = McCarthy 1991; M2 = McCarthy et al. 1996; Oj = van Ojik et al. 1996; Ro = Röttgering et al. 1997; Ra = Rawlings et al. 1996; Sp = Spinrad, this paper; St = Stern et al. 1997; vB = van Breugel, this paper; L365 = radio luminosity at 365 MHz in ergs/s/Hz.
| Object | Aaasurface area of object in band image (see text) | bbaverage surface brightness (within A), converted to the rest-frame band(see text) | |
|---|---|---|---|
| (arcsec2) | (mag) | (mag arcsec-2) | |
| 6C 0140+326 | 4.2 | 25.7 | 26.3 |
| 8C 1435+635 | 10.2 | 26.1 | 27.4 |
| 4C 41.17 | 15.3 | 25.7 | 27.4 |
| 4C 60.07 | 12.1 | 25.6 | 27.4 |
| MG 2144+1929 | 10.4 | 25.5 | 27.2 |
| 4C 1243+036 | 9.6 | 25.4 | 28.1 |
| B2 0902+34 | 8.2 | 26.0: | 26.3: |
| Object | Aaasurface area in band image (see text) | |
|---|---|---|
| (arcsec2) | (mag) | |
| B3 0744+464 | 3.4bbmeasured in band image because of very poor seeing in image | 26.0 |
| MRC 0943242 | 4.7 | 25.2 |
| 4C 28.58 | 6.0 | 25.7 |
| MG 1019+0534 | 4.5 | 25.1 |
| TX 2202+128 | 2.5 | 25.7 |
| MRC 2025218 | 7.3 | 25.5 |
| 3C 257 | 10.1 | 26.0 |
| MG 2121+1839 | 4.1 | 24.1 |
| Region | S20.5cm | S6.1cm | |
|---|---|---|---|
| (mJy) | (mJy) | ||
| Np lobe | 1473 | 436 | 1.01 |
| Sf lobe | 140 | 22 | 1.54 |
| Integrated | 1619 | 459 | 1.05 |
| Region | %20.5cm | %6.1cm | aa rad m-2. | ||
|---|---|---|---|---|---|
| (rad m-2) | |||||
| Np lobe | 24 12 | 16 45 | 6.5 3.8 | 9.7 4.2 | – |
| Sf lobe | 20 3 | 58 2 | 6.7 1.9 | 12.6 2.8 | 434 |
| Line ID | ||
|---|---|---|
| (Å) | ||
| Ly 1216 | 4228 | 2.478 |
| C IV 1549 | 5380 | 2.472 |
| He II 1640 | 5700 | 2.476 |
| C III] 1909 | 6625 | 2.470 |
| mean = 2.474 |