The Density of Ly Emitters at Very High Redshift
Abstract
We describe narrowband and spectroscopic searches for emission-line star forming galaxies in the redshift range 3 – 6 with the 10 m Keck II Telescope. These searches yield a substantial population of objects with only a single strong (equivalent width Å) emission line, lying in the Å range. Spectra of the objects found in narrowband–selected samples at Å and Å show that these very high equivalent width emission lines are generally redshifted Ly Å at and 4.5. The density of these emitters above the 5 detection limit of ergs cm-2 s-1 is roughly 15,000//unit at both and 4.5. A complementary deeper ( ergs cm-2 s-1) slit spectroscopic search covering a wide redshift range but a more limited spatial area () shows such objects can be found over the redshift range , with the currently highest redshift detected being at . The Ly flux distribution can be used to estimate a minimum star formation rate in the absence of reddening of roughly Mpc-3 yr-1 (, ). Corrections for reddening are likely to be no larger than a factor of two, since observed equivalent widths are close to the maximum values obtainable from ionization by a massive star population. Within the still significant uncertainties, the star formation rate from the Ly–selected sample is comparable to that of the color-break–selected samples at , but may represent an increasing fraction of the total rates at higher redshifts. This higher- population can be readily studied with large ground-based telescopes.
Subject headings:
cosmology: observations — early universe — galaxies: evolution — galaxies: formation1. Introduction
The search for high-redshift galaxies and the effort to map the star formation history of galaxies have progressed rapidly in the last several years as magnitude–limited spectroscopic surveys pushed into the range (Cowie et al. 1996; Cohen et al. 1996), while color–based selection techniques produced many objects in the range (Steidel et al. 1996a, 1996b; Franx et al. 1997; Steidel et al. 1998), particularly in the exquisite Hubble Deep Field (HDF) sample (Lowenthal et al. 1997). However, the galaxies chosen by these techniques correspond to objects with ongoing massive star formation and small amounts of extinction, and may represent only part of the populations at these early epochs. More evolved objects may be heavily dust–reddened and more easily picked out at submillimeter wavelengths (Smail, Ivison, & Blaine 1997; Hauser et al. 1998), while earlier stages in evolution may have relatively little continuum light and be too faint to be seen in the magnitude–limited samples or selected with the color-break techniques at current sensitivity limits.
This latter class of objects may represent the earliest stages of the galaxy formation process, in which substantial amounts of metals have yet to form. These galaxies may have much stronger Ly emission relative to the stellar continuum, since they have massive star formation that can excite the Ly emission line, but without so much dust that the line is suppressed, and this can result in very high observed equivalent widths in the range of 100–200 (1+) Å (e.g., Charlot & Fall 1993). Such objects may be hard to pick out with color-break techniques but be detectable in Ly searches of sufficient depth (Cowie 1988; Thommes 1996). An increased incidence of strong Ly emission does, indeed, appear in the color-break samples at fainter continuum magnitudes (Steidel et al. 1998).
Earlier blank-field Ly surveys (e.g., Thompson, Djorgovski, & Trauger 1995; Thompson & Djorgovski 1995) failed to find such objects, as Pritchet (1994) has summarized, but their sensitivity lay at the margin of where such objects would be expected in significant numbers (Cowie 1988; Thommes & Meisenheimer 1995). However, Hu & McMahon (1996), using very deep targeted narrowband searches ( ergs cm-2 s-1), found Ly-emitting galaxies with the very strong emission and weak or undetected continuua predicted for early star-forming objects. The advent of 10 m telescopes, along with this successful detection of Ly emitters, prompted us to undertake a new survey that has been successful in detecting blank-field high- Ly emitters. The present Letter describes the early results of this search, which uses extremely deep narrowband filter exposures taken with LRIS (Oke et al. 1995) on the Keck II telescope to search for emission-line populations at extremely faint flux levels ( ergs cm-2 s-1). This survey picks out sources of extremely high equivalent width ( Å) emission lines as candidates, and then uses followup LRIS spectroscopy (§2) to determine if these are Ly emitters.
The first results from the Hawaii survey with a 5390/77 Å filter, corresponding to Ly emission at , were described in Cowie & Hu 1998 (hereafter, Paper I), and yielded a number of candidate high- galaxies similar to the redshift Ly-emitting galaxies found by Hu & McMahon (1996) and emitters at (Pascarelle et al. 1996; Francis et al. 1997) in targeted searches. In Paper I, we showed that the use of color selection on emission-line selected objects of high equivalent width ( Å) picked out objects with continuum colors similar to those of color–selected Lyman break galaxies with measured redshifts of . They also recovered the one field object whose previously measured redshift placed Ly within the filter bandpass. However, the emission-line galaxies selected by their high equivalent width also comprised objects with very faint continuua, that would have fallen below the magnitude threshold of current Lyman break surveys, and also included two objects that could not be detected in Keck imaging of the optical continuum ( , , and ; Å).
In the present Letter we first present spectroscopic followups for the narrowband candidates of Paper I. In a small fraction of the cases, the spectrum shows both Ly and C iv 1550 Å, confirming the redshift identification but suggesting AGN-like properties. However, the majority of the spectra show only a single strong emission line. The absence of other detectable features, in combination with the high equivalent width of the selected candidates, identifes the single line as redshifted Ly emission, and argues that the equivalent width criterion ( Å) can, in fact, be used as a good diagnostic of high- Ly-emitting galaxies. We then (§3) present results of a second deep narrowband search with a 78 Å bandpass Å filter (Ly at ) and followup spectroscopy, that confirmed two Ly-emitting galaxies at this higher redshift. In §4, we describe a very deep blank-field spectroscopic search (6 hr LRIS integration covering Å) that yielded four emitters at redshifts 3.04 – 5.64. Finally (§5), the data on emission-line objects from the imaging surveys in the two redshift intervals are combined with various spectroscopic surveys at lower redshift to show the evolution of the emission-line fluxes with redshift. We argue that the Ly-emitting objects are significant contributors to the integrated star formation of the galaxy population throughout the redshift range, and that the integrated star formation rate of the Ly selected objects is flat, or possibly rising through this redshift range, with a value greater than 0.01 Mpc-3 for and . At the highest redshifts, most of the star formation may be occurring in objects of this class.
2. Spectroscopic Confirmation of Candidate Lyman alpha emitters
Paper I provides a sample of 12 objects in the SSA22 and HDF fields, with Å in the 5390/77 Å filter. A further 7 objects were detected in a similar field surrounding the quasar BR0019–1522 (Storrie-Lombardi et al. 1996), giving a total sample of 19 objects over an area of . All the SSA22 and HDF candidate objects have now been spectroscopically observed using LRIS on the Keck II telescope, as have three of the objects in the BR0019–1522 field. Multi-slit masks with slits were used, giving a resolution of 16 Å (Cowie et al. 1996), and exposure times ranged from hrs, with most objects having the longer exposure. Two objects in the HDF field have strong C iv emission, placing them at but suggesting AGN activity (Fig. 2). These objects appear similar to the brighter objects in Pascarelle et al. (1996). However, the remaining objects have only one strong emission line, and the continuua are too weak for absorption line identifications.
![[Uncaptioned image]](/html/astro-ph/9803011/assets/x1.png)
Figure 1. Spectra of strong Ly emitters in SSA22, LA1 and LA3, (top two panels) compared with the spectrum of an [O ii] emitter with extremely high equivalent width (third panel) shifted so the [O ii] emission lies at the narrowband wavelength (5390 Å). We also show for comparison one of the two Ly emitters (LA1) in the HDF field that shows strong C iv emission (bottom panel). The observed equivalent widths of the two SSA22 objects are Å for the topmost object and Å for the second. The observed equivalent width of the [O ii] line in the comparison object is 220 Å. The H+[O iii] complex is clearly evident in the case of the [O ii] emitter, and these cases may be easily distinguished from genuine high- Ly emission objects.
A primary concern in the simple equivalent width selection procedure is whether we are misinterpreting emission lines such as [O ii] 3727 Å and H 6563 Å, that are common features in galaxies at moderate redshift, as higher redshift Ly emission. For objects where the continuum is strongly detected it is possible to use color information to diagnose the different lines (Paper I), but in cases in which only one emission line is seen, we can only make the distinction based on the equivalent width strength of the line, assuming that an observed equivalent width Å is generally Ly rather than unusually strong [O ii] or H. Spectroscopic followup is therefore essential to decide whether this procedure is reliable.
It is easiest to argue that single-line objects are Ly emitters at lower redshifts, where the number of possible contaminating lines is smaller. An emission line at 5390 Å lies below rest-frame H, and only slightly above the [O iii]+H complex at 5000 Å, so that the only probable sources of confusion are [O ii] 3727 emitters at . However, such objects would then have H 4861 and [O iii] 5007 lying at 7030 Å and 7241 Å, and we would expect these emission lines to be strong, given the necessary strength of the [O ii] 3727 line. In Figure 2 we compare the spectra of two strong emitters ( and Å) found in the SSA22 field with one of the strongest equivalent width [O ii] emitters ( Å) found in the Hawaii Deep Field Survey of Cowie et al. (1996), and with one of the objects with Ly and C iv emission detected in the HDF. The [O ii] comparison spectrum has been wavelength shifted so that its [O ii] line lies over the emission lines in the objects. It can be clearly seen that the absence of the H+[O iii] complex in the SSA22 spectra rules out the possibility that the objects are [O ii] emitters, and leaves us only with the Ly interpretation.
![[Uncaptioned image]](/html/astro-ph/9803011/assets/x2.png)
Figure 4. The plots show Ly emission-line objects recovered from deep multi-slit spectroscopy of a field around the quasar BR1202–0725 using LRIS. The 4 detected objects have observed equivalent widths of , , 450, and 350 Å. See Fig. 3 for the corresponding two-dimensional spectra. If the emission line were [O ii], the H+[O iii] complex would lie in the Å region.
At higher redshifts, the most problematic contaminants are likely to be high ionization extragalactic Hii regions, with strong lines of [O iii] and H. Spectroscopic followups of candidate emitters from narrowband surveys where the filter bandpass lies in regions devoid of strong night sky lines, as is the case for the 5390 Å and 6741 Å filters, can rule out [O iii] by the doublet line structure. H from high ionization systems can have observed equivalent widths of several hundred angstroms (cf., Stockton & Ridgway 1998), and requires broad wavelength coverage of the [O iii] lines and/or the measurement of a continuum break across the emission line to confirm it as Ly. We do not find such contaminants evident among the narrowband and spectroscopic samples discussed in the present paper.
3. Lyman alpha emitters at
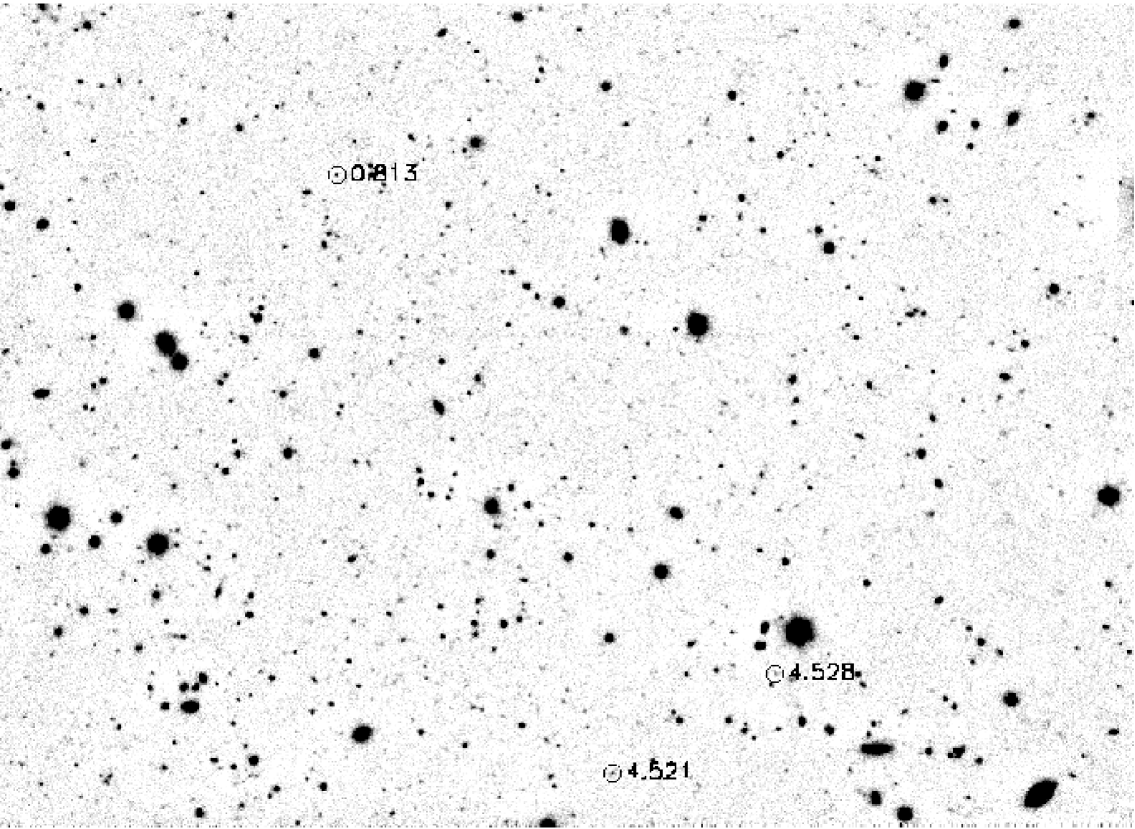
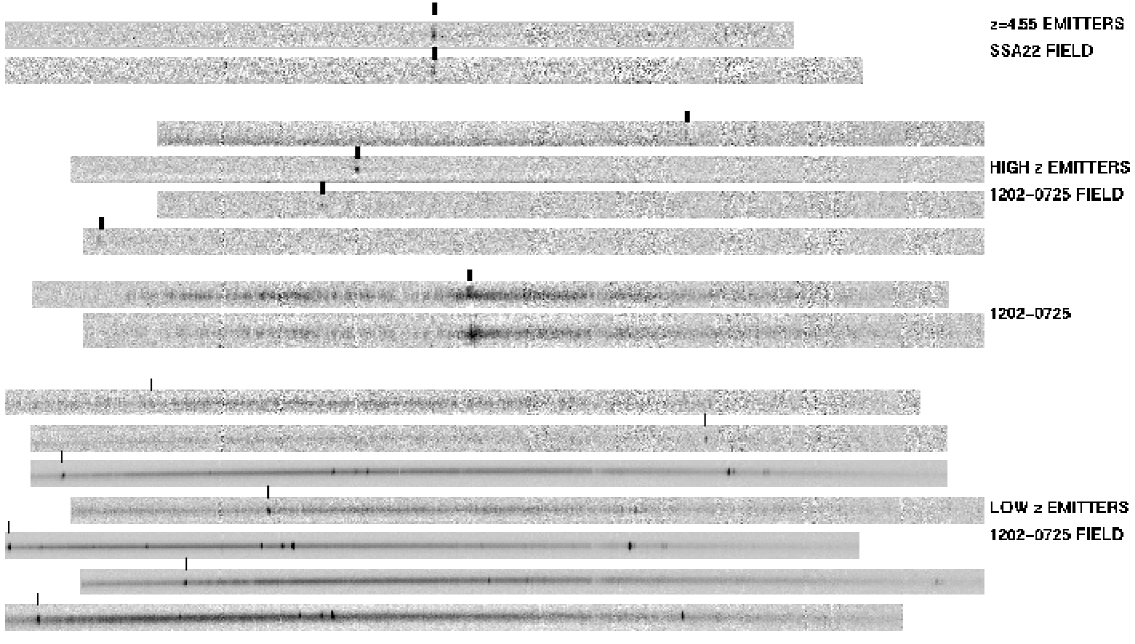
Narrowband observations of the SSA22 field were obtained on the nights of UT 1997 September 21–22 with the LRIS camera on Keck II, through a narrowband interference filter centered at 6741 Å, with a bandpass of 78 Å and transmission of 81%. The net exposure of 2.7 hrs was obtained as a sequence of 900 s exposures taken with offsets, with FWHMs of (1.2 hrs) and (1.5 hrs). A corresponding 1.2 hr -band image was obtained as a series of 360 s exposures to define the local continuum. Three Å objects were detected, which are marked on the narrowband image in Figure 2 (Plate 1), and shown as 2-dimensional spectra in Figure 3 (Plate 2).
At this narrowband wavelength (6741 Å) we may be contaminated by [O ii] 3727 at , H at , or [O iii] or H at . However, our spectroscopic followup again easily distinguishes such cases. The lowest flux object, with the weakest equivalent width constraint ( Å), is identified as an [O ii] emitter at , but the stronger object with substantial red wavelength coverage does not have detected [O iii] and does not permit this interpretation. For the second strong object there is a strong break across the emission line, consistent with the Ly interpretation. Nor does either of the objects have emission lines near the primary line, that would permit the objects to be identified as [O iii] or H. Once again there appears no choice but to interpret these lines as Ly.
![[Uncaptioned image]](/html/astro-ph/9803011/assets/x3.png)
Figure 5. Composite plot of H flux times redshift squared versus redshift. At low redshift we show the +[N ii]) fluxes (filled squares) from the sample of Gallego et al. (1995), converted to corresponding H flux by multiplying by 0.75. The crosses show normalized H fluxes or converted, normalized [O ii] fluxes from the Hawaii wide-field surveys (Songaila et al. 1994). The filled triangles show renormalized, converted [O ii] fluxes from a spectroscopic sample (cf., Cowie et al. 1997) with open squares showing renormalized +[N ii]) or with circles showing renormalized (Ly) at the highest redshifts if the spectrum does not cover [O ii]. Finally, the remaining circles (at and show for the samples of objects detected in the two narrowband filters. The solid () and dashed () reference lines show the fluxes corresponding to star formation rates = 10, 1, and 0.1 yr-1 for km s-1 Mpc-1 and the normalization discussed in the text.
4. Spectroscopic Search
The surface density of emitters from the narrowband search is sufficiently high (//unit at , based on the 3 fields) that searches of existing very deep long-slit or multi-slit LRIS observations should yield such objects over the optical redshift range (). Indeed, Franx et al. 1997 identified a second object by inferring that the single strong emission line seen in a serendipitously placed slit during spectrosopic exposures of their color–selected, gravitationally lensed galaxy, was also due to Ly at their target object’s redshift. In our own archival LRIS data the best suited exposure is that around the quasar BR1202–0725, where a 6 hr integration in a single mask configuration was obtained under photometric conditions and with reasonable seeing (UT 31 March – 2 April 1997; 4 hrs obtained with FWHM, and the remaining 2 hrs with FWHM). The data were taken to study color–selected and emission-line–selected objects in the quasar field (Hu, McMahon, & Egami 1996; Giallongo et al. 1998) and the mask comprised only twelve slits, with the blank sky area covering roughly 200 arcsec2. A search of this spectral image yielded four extremely high equivalent width emitters ranging in redshift from . These spectra are shown in Fig. 2 and in Plate 2. The two highest redshift objects can be seen in the red continuum, and have a strong break across the emission line, consistent with the expected Ly forest decrement.
The surface density of emitters in the spectroscopic field is roughly 60,000 deg-2/unit in the accessible redshift range, consistent with the narrowband searches when account is made for the slightly fainter flux limit in the spectrocopic data ( ergs cm-2 s-1) and the current uncertainty in the numbers. Ultimately, the census of the populations is best done with the narrowband data with its uniform selection procedures and well-defined flux limits, but the present data suggest that we will see substantial populations of these objects to very high redshift.
5. Discussion
Since resonant scattering enhances the effects of extinction, it is harder to convert the Ly emission into a massive star formation rate than it is for line luminosity diagnostics such as H and [O ii] 3727. For the present calculation, we assume that extinction may be neglected in computing the required massive star formation rates, which then constitute a minimum estimate. However, upward corrections to this value are unlikely to be larger than a factor of two, since the observed rest-frame equivalent widths lie in the Å range — close to the maximum values that are obtainable from ionization by a massive star population (Charlot & Fall 1993). Then, assuming case B recombination, we have Ly) = 8.7 H) (Brocklehurst 1971), which using Kennicutt’s (1983) translation of from H luminosity, gives Ly)/ ergs s-1) yr-1. In order to cross-calibrate to [O ii] fluxes at lower redshift we assume (H+[N ii]) = ([O ii]) based on the mean values of the ratio in both the Gallego et al. (1995) and Hawaii Deep Survey (Cowie et al. 1996) samples. We also assume (H+[N ii]) = (H) (Kennicutt 1983).
In Figure 3 we compare the range of Ly luminosities to the range of line luminosities in lower redshift objects. The plot shows the quantity vs redshift, where H+[N ii], [O ii], and Ly fluxes have been converted to H fluxes using the relationships above, and we have restricted ourselves to the imaging data in which the fluxes of the Ly are well determined. The comparison objects are drawn from the surveys of Gallego et al. 1995 (filled boxes), Songaila et al. 1994 (pluses), and the Hawaii sample [open boxes (H+[N ii]), triangles ([O ii]), and circles (Ly)]. The solid () and dashed () lines on Fig. 3 show the fluxes corresponding to stellar mass production rates of 10 yr-1, 1 yr-1, and 0.1 yr-1 for . Maximum formation rates locally are around a few yr-1, rising to values of just over 10 yr-1 above . The Ly fluxes at the higher redshifts are then consistent with this value or just slightly smaller depending on the extinction correction. The CADIS results (Thommes et al. 1998) would lie a factor of several times higher in flux than the two Hawaii filter samples, but both Keck spectroscopy and repeat Fabry-Pérot observations have disproved the original candidate selection (Meisenheimer 1998).
The minimum integrated star formation rates at and are 0.006 Mpc-3 yr-1 and 0.01 Mpc-3 yr-1 respectively for where the first value is slightly smaller than that given in Paper I since AGN-like objects are excluded. Both values are lower limits calculated in the absence of extinction and the value is based on a single field. Within the substantial uncertainties of the as yet small samples, the results suggest that the star formation rates in the strong emission line population are constant or may possibly be increasing with redshift from , in contrast to color-based samples where the rate is declining at higher redshifts (Madau et al. 1996, 1998). This is consistent with the broad expectation that as we move to higher redshifts and earlier stages of galaxy formation, an increasingly larger fraction of the star formation should be in strong Ly emitters that correspond to the youngest galaxies.
References
- (1)
- (2) Brocklehurst, M. 1971, MNRAS, 153, 471
- (3) Charlot, S., & Fall, S. M. 1993, ApJ, 415, 580
- (4) Cohen, J. G., Cowie, L. L., Hogg, D. W., Songaila, A., Blandford, R., Hu, E. M., & Shopbell, P. 1996, ApJ, 471, L5, astro-ph/9608121
- (5) Cowie, L. L. 1988, in The Post-Recombination Universe, ed. N. Kaiser & A. N. Lazenby (Dordrecht: Kluwer), 1
- (6) Cowie, L. L. & Hu, E. M. 1998, AJ, 115, 1319 (Paper I), astro-ph/9801003
- (7) Cowie, L. L., Hu, E. M., Songaila, A., & Egami, E. 1997, ApJ, 481, L9, astro-ph/9702235
- (8) Cowie, L. L., Songaila, A., Hu, E. M., & Cohen, J. G. 1996, AJ, 112, 839, astro-ph/9606079
- (9) Fontana, A., Cristiani, S., D’Odorico, S., Giallongo, E., & Savaglio, S. 1996, MNRAS, 279, L27, astro-ph/9601086
- (10) Francis, P. J., Woodgate, B. E., & Danks, A. C. 1997, ApJ, 482, L25, astro-ph/9703178
- (11) Franx, M., Illingworth, G. D., Kelson, D. D., van Dokkum, P. G., & Tran, K.-V. 1997, ApJ, 486, L75, astro-ph/9704090
- (12) Gallego, J., Zamorano, J., Aragón-Salamanca, A., & Rego, M. 1995, ApJ, 455, L1, astro-ph/9510061
- (13) Giallongo, E., D’Odorico, S., Fontana, A., Cristiani, S., Egami, E., Hu, E. M., & McMahon, R. G. 1998, AJ, in press, astro-ph/9802340
- (14) Hauser, M. G. et al. 1998, ApJ, in press, astro-ph/9806167
- (15) Hu, E. M., & McMahon, R. G. 1996, Nature, 382, 231, astro-ph/9606135
- (16) Hu, E. M., McMahon, R. G. & Egami, E. 1996, ApJ, 459, L53, astro-ph/9512165
- (17) Hu, E. M., McMahon, R. G. & Egami, E. 1997, in The Hubble Space Telescope and the High Redshift Universe, ed. N. R. Tanvir, A. Aragón-Salamanca, & J. V. Wall (Singapore: World Scientific), 91, astro-ph/9609188
- (18) Kennicutt, R. C., Jr. 1983, ApJ, 272, 54
- (19) Lowenthal, J. D. et al. 1997, ApJ, 481, 673, astro-ph/9703093
- (20) Madau, P., Ferguson, H. C., Dickinson, M. E., Giavalisco, M., Steidel, C. C., & Fruchter, A. 1996, MNRAS, 283, 1388, astro-ph/9607172
- (21) Madau, P., Pozzetti, L., & Dickinson, M. E. 1998, ApJ, 498, 106, astro-ph/9708220
- (22) Meisenheimer, K. 1998, private communication
- (23) Oke, J. B. et al. 1995, PASP, 107, 375
- (24) Pascarelle, S. M., Windhorst, R. A., Keel, W. C., & Odewahn, S. C. 1996, Nature, 383, 45
- (25) Petitjean, P., Pécontal, E., Valls-Gabaud, D., & Charlot, S. 1996, Nature, 380, 411, astro-ph/9603088
- (26) Pritchet, C. J. 1994, PASP, 106, 1052
- (27) Smail, I., Ivison, R. J., & Blain, A. W. 1997, ApJ, 490, L5, astro-ph/9708135
- (28) Songaila, A., Cowie, L. L., Hu, E. M., & Gardner, J. P. 1994, ApJS, 94, 461
- (29) Steidel, C. C., Adelberger, K., Dickinson, M., Giavalisco, M., Pettini, M., & Kellogg, M. 1998, ApJ, 492, 428, astro-ph/9708125
- (30) Steidel, C. C., Giavalisco, M., Dickinson, M., & Adelberger, K. L. 1996a, AJ, 112, 352, astro-ph/9604140
- (31) Steidel, C. C., Giavalisco, M., Pettini, M., Dickinson, M., & Adelberger, K. L. 1996b, ApJ, 462, L17, astro-ph/9602024
- (32) Stockton, A. & Ridgway, S. E., 1998, AJ, 115, 1340, astro-ph/9801056
- (33) Storrie-Lombardi, L. J., McMahon, R. G., Irwin, M. J., & Hazard, C. 1996, ApJ, 468, 121, astro-ph/9604021
- (34) Thommes, E. 1996, PhD thesis, Univ. Heidelberg
- (35) Thommes, E. & Meisenheimer, K. 1995, in Galaxies in the Young Universe, ed. Hippelein, H., Meisenheimer, K., & Röser, H.-J. (Berlin: Springer), 242
- (36) Thommes, E., Meisenheimer, K., Fockenbrock, R., Hippelein, H., & Röser, H.-J. 1998, MNRAS, 293, L6
- (37) Thompson, D., Djorgovski, S., & Trauger, J. 1995, AJ, 110, 963
- (38) Thompson, D. & Djorgovski, S. G. 1995, AJ, 110, 982