S. García–Burillo 11institutetext: Observatorio Astronómico Nacional, Campus Universitario, Apdo 1143, E–28800 Alcalá de Henares (Madrid), Spain 22institutetext: Observatoire de Paris, DEMIRM, 61 Av. de l’Observatoire, F–75014, France 33institutetext: IRAM, 300 Rue de la Piscine, F-38406, France \thesaurus 07.14.1, 07.02.1, 07.21.1, 07.11.1,09.19.1
Molecular gas in the barred spiral M 100
Abstract
Using the IRAM interferometer we have mapped at high resolution () the 12CO(1–0) emission in the nucleus of the doubled barred SABbc spiral M 100. Our synthesized map includes the zero spacing flux of the single–dish 30m map (Sempere & García–Burillo, 1997, paper I). Molecular gas is distributed in a two spiral arm structure starting from the end points of the nuclear bar ( pc) up to kpc, and a central source (100 pc). The kinematics of the gas indicates the existence of a steep rotation curve (vrot=180 km s-1 at pc) and strong streaming motions characteristic of a trailing spiral wave inside corotation.
Interpretation of the CO observations and their relation with stellar and gaseous tracers (K, optical, H, H I and radiocontinuum maps) are made in the light of a numerical model of the clouds hydrodynamics. Gas flow simulations analyse the gas response to a gravitational potential derived from the K-band plate, including the two nested bars. We develop two families of models: first, a single pattern speed solution shared by the outer bar+spiral and by the nuclear bar, and secondly, a two independent bars solution, where the nuclear bar is dynamically decoupled and rotates faster than the primary bar.
We found the best fit solution consisting of a fast pattern (=160 kms-1kpc-1) for the nuclear bar (with corotation at R=1.2 kpc) decoupled from the slow pattern of the outer bar+spiral (=23 kms-1kpc-1) (with corotation at R=8-9 kpc). As required by non-linear coupling of spirals (Tagger et al 1987), the corotation of the fast pattern falls in the ILR region of the slow pattern, allowing an efficient transfer of molecular gas towards the nuclear region. Solutions based on a single pattern hypothesis for the whole disk cannot fit the observed molecular gas response and fail to account for the relation between other stellar and gaseous tracers. In the two-bar solution, the gas morphology and kinematics are strongly varying in the rotating frame of the slow large-scale bar, and fit the data periodically during a short fraction (about 20%) of the relative nuclear bar period of 46 Myr.
keywords:
Galaxies: kinematics and dynamics of - Galaxies: barred - Galaxies: spiral - Galaxies: individual - Interstellar medium: molecules1 Introduction
The advent of high-sensitivity near-infrared imaging of galaxies has shown that a significant percentage of barred spirals host secondary bars in their nuclei. There could be two interpretations of the bars within bars phenomenon, according to the relative pattern speeds of the two bars (Friedli and Martinet, 1993; Friedli and Benz, 1993 and 1995; Combes, 1994). The two patterns could be corotating if they are about parallel or perpendicular to each other. If the secondary inner bar is strongly misaligned with the primary outer bar, the two bars are likely to have distinct wave pattern speeds, as shown by numerical simulations. The decoupling of an inner faster pattern appears in self-consistent simulations with gas and stars thanks to the role of the dissipative component: as a result of gas inflow, under the action of the bar gravitational torques, mass accumulates onto the x2 types of orbits which weakens the primary bar. The rotation period becomes much shorter in the nuclear regions due to mass concentration, which leads to the decoupling of a fast-rotating bar. Eventually, the nuclear bar destroys itself or it destroys the primary bar, modifying the overall disk potential. Evolution can then occur in much less than a Hubble time, and galaxies change their morphological type along the Hubble sequence. They change from barred to un-barred, and also they concentrate mass in the process, evolving slowly from late-types to early types.
The observation and modelling of real barred galaxies offers the opportunity to test theory predictions on galaxy evolution and it seems a necessary complement to numerical simulations of model galaxies. The present work is intended to bring a combined observational and modelling effort in the study of the nearby barred spiral M100 (NGC4321). In this galaxy, classified as SABbc by de Vaucouleurs et al (1991), the hypothesis of a single mode common to the whole disk is dubious, both from observational and theoretical evidences.
On the observational side, the nuclear region of M100 (up to r=3kpc) has been so far the subject of numerous studies. The pioneering work of Arsenault and collaborators (1988, 1989, 1990) established a connection between the ring-like H morphology of the nucleus and the existence of Inner Linblad Resonances. Further steps in sensitivity made appear, first, a four-armed structure (Cepa et al, 1990) and recently a fragmented two spiral arm structure in H (Knapen et al, 1996). The 6cm radio-continuum VLA map of Weiler et al (1981) shows also a two arm spiral pattern.
Near infrared images of the nucleus (Pierce 1986, Shaw et al 1995, Knapen et al 1995 (hereafter K95), Rauscher 1995) show the existence of either a secondary nuclear bar in K (nearly parallel to the main bar) together with a leading spiral structure, or an inner oval in the I band (with principal axes misaligned with respect to the outer bar). The synthesis aperture 12CO(1–0) maps (Canzian, 1992; Rand, 1995; Sakamoto et al 1995) indicate the existence of a two-arm molecular spiral structure connected to the K nuclear bar end points. The IRAM 30m map of paper I shows a strong concentration of CO emission towards the nuclear disk ND, a component clearly distinguishable from the main bar. A steep rotation curve gradient, unresolved by the 30m beam (12′′ in the 2–1 line), indicates a high mass concentration in the ND.
On the modelling side, García-Burillo et al (1994) (hereafter called GB94) and Sempere et al (1995) (hereafter S95) made numerical simulations of the cloud hydrodynamics to study the evolution of the molecular gas disk under the action of a realistic spiral+barred potential derived from a red band plate. The authors assume the whole disk to be fitted by a single well defined wave pattern characterized by , shared by the primary bar and the spiral arms. However they lacked first, of the necessary spatial resolution and secondly, of a fair potential tracer to analyse the gas response in the inner 500 pc.
K95 have made numerical simulations of the stellar and gas dynamics in M100, using a model potential which departs markedly from the real mass distribution. Although they favour a one bar mode scenario their model fails to reproduce the molecular gas distribution observed by the interferometer.
We present here a combined single-dish and interferometer data set fulfilling both high resolution (2.2′′1.2′′) and sensitivity requirements. Contrary to the synthesis aperture maps so far published, we recover entirely the zero-spacing flux of the ND. The comparison between the different gaseous and stellar tracers of the ND is reexamined in this work. Particular attention is paid to the bias introduced by extinction in optical and even near-infrared images of the nucleus, and what might be the implications on the interpretation of the data. Observations are confronted to the result of new numerical simulations of the clouds hydrodynamics, based on a mass distribution directly derived from the infrared luminosity image of M100. We will focus on the feasibility of two independent patterns in the disk and how this scenario accounts better for the observations.
2 Observations
12CO(1–0) visibilities were obtained between February 1995 and April 1996 by the IRAM Plateau de Bure interferometer. We used the 4-antennas set of extended configurations (BC) supplemented by 3-antennas observations compact set (D). All antennas were equipped with SIS receivers operating in the single-side-band mode and yielding receiver temperatures close to 40 K. The system temperatures range typically from 250 K to 400 K. The cross-correlator was adjusted within a 540 MHz passband with a channel width of 2.5 MHz, corresponding to a velocity resolution of 6.5 kms-1 in the 12CO(1–0) line.
Instrumental calibration was performed using the quasars 3C273 and 1219+285. The atmospheric rms phase fluctuations on the longest baselines, integrated over 4 minutes, were always found to be degrees. The receiver passband was verified on 3C273. The absolute flux density scale was based on measurements of 3C273 and 1219+285. Information on their fluxes were bootstrapped from regular IRAM monitoring observations (Dutrey & Ungerechts, 1995, 1996). The data were antenna-based calibrated using the CLIC package (Lucas, 1992).
Short spacing visibility data was provided by the 30m radiotelescope. Single-dish visibilities were derived from the brightness temperature distribution following a reduction scheme described in the software package GILDAS (Guilloteau & Forveille, 1989) (see also the comprehensive discussions in Vogel et al. 1984, Neri et al. 1997). Firstly, the single-dish data were resampled to the 2.5 MHz frequency resolution of the interferometric data, and the main beam temperatures were converted to Jy/beam by applying the standard conversion factor Jy/K adopted for the 30m telescope (Wild 1995). Secondly, the single-dish maps were deconvolved by dividing their Fourier transforms by the Fourier transform of the 21′′ beam of the telescope, which was assumed to be circular and Gaussian, and the results multiplied by the 42′′ primary beam of the interferometer. Finally, the single-dish map was corrected from a 2′′ absolute residual pointing error. The derived M100 dynamical center (see below) coincides with the emission peak in the single-dish and the interferometer synthesized field.
Single-dish and interferometric visibilities were then combined into a common visibility table by scaling the single-dish weights to the mean weight of the short spacing interferometer visibilities in the uv range . Henceforth we implicitly correct for eventual calibration errors in the 30m data.
CLEANed maps were then obtained from the visibilities by standard deconvolution procedures (no tapering and uniform weighting). The map field is pixel2 in size with a linear scale of /pixel. The synthesized beam was and oriented along PA=30 degrees. The rms noise level in the 2.5 MHzchannel maps is mJy/beam or equivalently 140mK within the synthesized beam. Point source sensitivity, determined for the line-free 400 MHzcontinuum passband is mJy/beam.
We adopted (1950)= 12h20m23.2s, (1950)= 16∘06′00′′as the phase tracking center. Correlator was centered at vLSR=1562 kms-1. However, we re-determined the dynamical center and the systemic velocity of NGC4321, following a standard least squares procedure applied to the interferometer data cube. Assuming a priori a position angle of PA=153∘(paper I), the dynamical center (the (0,0) offset as referred in this work) is found at (1950)=12h20m22.96s, (1950)=16∘05′57.5′′; the systemic velocity is fitted to =15733 kms-1. The velocity and spatial scales used in this paper will be relative to the derived v and (0,0) central offset. At the assumed distance of M100 ( 17.1 Mpc), 1 82 pc.
3 Molecular gas distribution
3.1 The CO maps
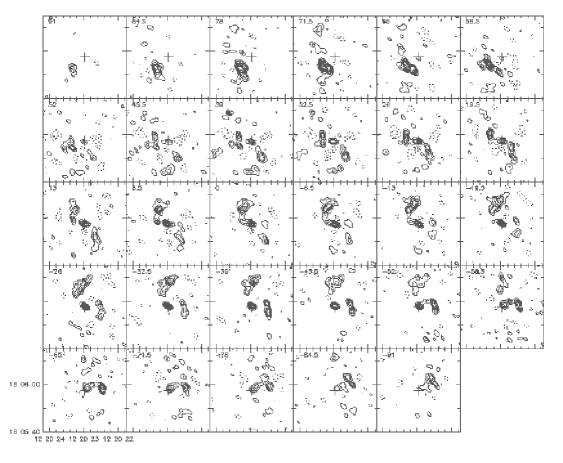
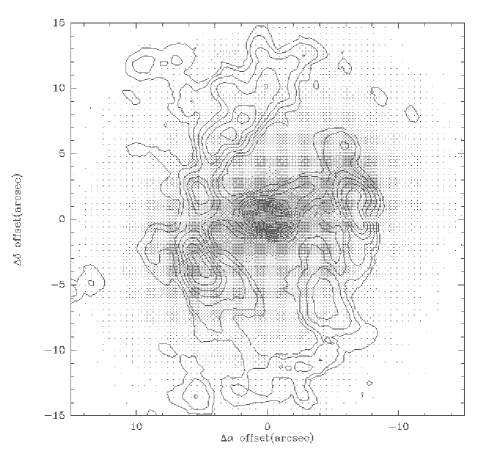
We present in Fig.1 the 12CO(1–0) velocity-channel maps displaying line emission from v=-91kms-1 to v=91kms-1. No significant emission is found outside this velocity range. The rms noise in the channel maps (6.5kms-1 wide) is 8.5mK in brightness temperature. The emitting gas is confined within an elongated region extending over xy=20′′ 30′′. As expected for a moderately inclined (i=32o) rotating disk whose major axis is close to North (PA=153o) and assuming that M100’s spiral structure is trailing, gas emission is bound to appear mostly at positive velocities on the southern side, contrary to blueshifted gas emission showing up on the northern side. Notwithstanding this general trend, the morphology of the channel maps indicate strong deviations from axisymmetry both in the velocity field and in the gas distribution. Channel maps with velocities close to vsys=0, show a distorted S-like pattern reminding of spiral-like streaming. Emission from a strong CO source is detected within a large velocity range v=(-70 up to 70kms-1) at the center of the galaxy. There are also evidences of gas emission at highly forbidden velocities: CO emission is detected on the northern part, towards (, )= (+7′′,+10′′), at positive velocities (v=60 up to 80kms-1). There is a southern counterpart of this component towards (, )= (-7′′,-10′′), at negative velocities (v=-60 up to -80kms-1).
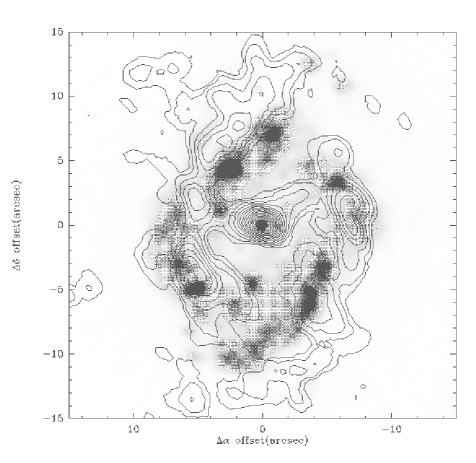
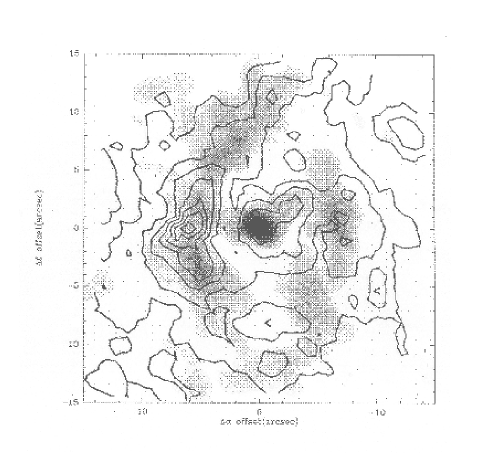
The CO velocity-integrated maps (not corrected for primary beam attenuation) for the Plateau de Bure (I) and the combined Plateau de Bure+30m data (I) are shown in Figs2a-b. They have been obtained by integrating the emission in channels with brightness temperature higher than 2. The morphology of molecular gas distribution seen by the interferometer is characterized by:
-
•
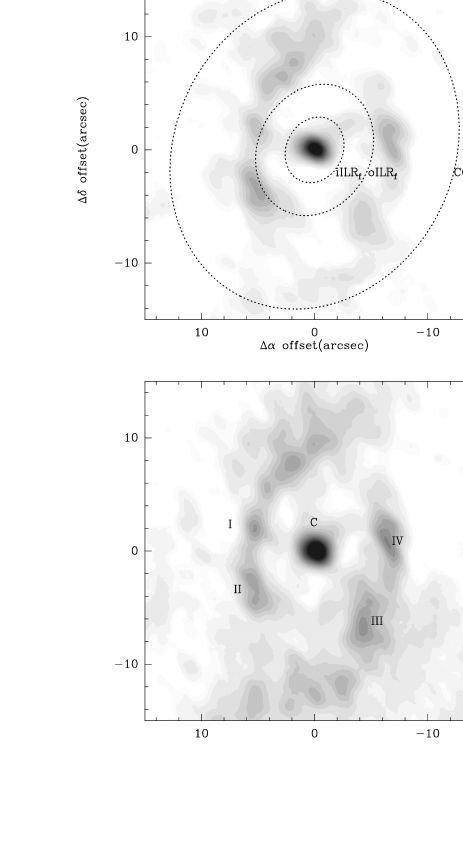
Two spiral arms stretching out from radius r7′′and position angles PA=130∘(on the eastern side, hereafter Arm E) and 310∘(on the western side, hereafter Arm W). The arms spread over an azimuthal range of =120∘and reach the edges of the map. Arm W has a sudden change in its pitch angle near PA=210∘, appearing broken and discontinuous. CO emission along the spiral arms is uneven: it displays a clumpy hierarchy. Some of these clumps (denoted as I-IV) have been spatially resolved by the interferometer beam. Spiral arms are narrow: at places, they are not resolved transversely (FWHM). The sign of the observed non-circular motions both in the interarm and in the arm regions correspond to the expected velocity pattern inside corotation (see discussion of S95 and section 6).
-
•
There is a strong concentration of molecular gas at the center in the shape of an ellipsoidal source which is marginally resolved by the interferometer beam (major axes–(a,b)=(2.5′′, 2.1′′)). The central clump C is connected to the western spiral by a bridge of emission.
-
•
Away from the spiral-like and central sources, gas emission is hardly detected in the inner and outer interarm region.
Fig 2b shows the I map. Roughly the morphology of both maps are alike. The zero-spacing flux recovered (defined as (f=I-I)/I) reaches on average 50. However, this percentage varies markedly in the map: it lowers up to 10-20 for Arm E, it rises up to 50 for Arm W, and it reaches 100 for the interarm region. The flux recovered in the central source (f30) makes it appear rounder and spatially resolved. Spiral arms are also broader and there is smooth interarm emission detected up to r=10′′that the interferometer map filtered out completely. Still, the ND arm-interarm contrast is high (4–5).
3.2 Mass of molecular gas
We derive masses and column densities of molecular gas from ICO using a CO-to-H2 conversion factor X=N(H2)/ICO=2.3x1020cm-2K-1km-1s (Strong et al. 1988). Assuming the distance to be D=17.1Mpc, the total molecular gas mass in the interferometer and combined integrated intensity maps are 1.4109M⊙ and 2.7109M⊙ respectively. The masses of clumps (I, II, III, IV and C; all of them of sizes spatially resolved by the interferometer beam) are estimated, first, from I and I (CO based masses including the correction factor for helium, MCO) and, secondly, from the virial theorem (MVIR). In the latter case, masses come from M(H2)=550, where d is the equivalent FWHM diameter, defined as d= ( and are the FWHM diameters along the principal axes in a 2D-gaussian model), and is the measured radial velocity dispersion seen in the CO line. Clumps I, II, III and IV seem gravitationally bound entities (MCO=1.7-2.7MVIR, according to mass estimates from I), contrary to the central clump (C), as expected (for C the measured is entirely due to the large velocity gradient of rotation curve). CO-based masses range from 0.6 to 2.4x10 typical of GMA-like associations. Note however that we have no accurate calibration of the conversion factor in M100 and that the previous conclusions on gravitational boundness of GMAs lean on the assumed value of X.
The I contours at half power along the spiral arms correspond on average to molecular gas column densities of 400-500/pc2. N(H2+He) peaks at 800-1000/pc2 along both spiral arms and it reaches 2000/pc2 towards C. The critical column densities for gravitational instabilities (Nc; Toomre (1964), see also Kennicutt (1989) can be derived from (see paper I)
range from 100 (at r15′′) to 350/pc2 (towards C), and henceforth the condition for the onset of gravitational instability (N(H2+He)/N1) is largely fulfilled along the spiral arms and the nuclear source (N(H2+He)/N2–6)
We used the relation between I12CO(1-0) and Av obtained by Cernicharo and Guélin (1987) for the Taurus cloud complex to estimate the visual extinction towards the center of M100:
I(12CO(1–0))=(5.00.5)(2Av-0.50.2) [1]
where the factor of 2 corrects for the non-obscuring dust behind the HII regions, assumed to be located in the middle of the disk. Av derived from [1] ranges from 2–2.5 (in the gaseous spiral arms) to 5 (towards C) in good agreement with the average value obtained from I(13CO(1–0)) in paper I for the ND (A 3.5).
4 Comparison with other tracers
We discuss in this section the global picture emerging from the comparison of the different gaseous and stellar tracers in the center of M100.
The near infrared K pictures of the M100 disk show the presence of an outer stellar bar with a 90-100′′diameter. A gaseous molecular bar, aligned with the stellar bar, has been detected (paper I) and a flow of gas parallel to the bar is evident in the observed CO kinematics up to r60′′: the CO p-v minor axis diagram shows the S-like pattern typical of a bar driven gas flow (GB94). The molecular gas bar has two ridges offset from the bar major axis, mimicking the offset leading dust-lanes often observed in barred galaxies. This indicates the presence of two ILRs, and the tendency of the gas flow to become perpendicular to the bar in between (Athanassoula 1992).
The previous infrared (I, J and R) images of the nuclear region showed the existence of a nuclear oval or inner bar, but with a 30∘leading angle respect to the outer bar. The discrepancy is explained by differential extinction, affecting less severely the K band image. The spiral-like distribution of molecular gas and henceforth the extinction maxima locus explain why Pierce (1986) see a misaligned nuclear lens. K95 used the alignment of both K bars as an argument supporting the existence of one mode for the disk, opposed to the two independent bars scenario. Still, this is just a statistical argument: whatever relative orientation of two independent bars is equally probable, including the alignment case. On the other hand, although the K band picture of M100 is less affected by extinction, the existence of substructures such as leading arms or relative maxima at the bar ends (used by Knapen and collaborators as supporting evidences of the one mode case), are shown to be linked with extinction (see below).
4.1 Bias of extinction
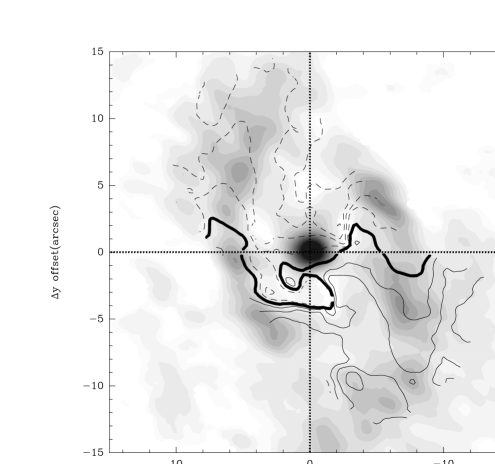
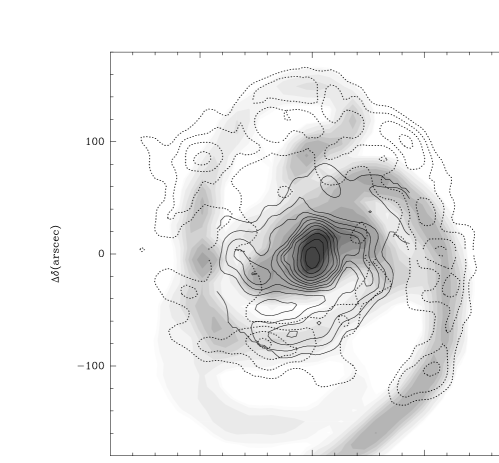
Fig.3a shows the overlay of I contours with Hα, in gray scale. Although, similarly to CO, Hα emission is confined in a ring-like structure and a central source, there are systematic shifts between the CO and Hα ridges along the arms. Assuming the spiral to be trailing (see section 6), Hα appears upstream the CO ridge along both arms for PA=0∘-90∘(Arm E) and PA=180∘-270∘(Arm W). On the contrary, the Hα ridge lies downstream the CO maximum in the azimuthal ranges PA=90∘-180∘(Arm E) and PA=270∘-360∘(Arm W). Towards C, Hα is relatively dimmed. Generally speaking, there is apparently a local anticorrelation between molecular gas column densities and massive star formation in the ND: CO peaks suspiciously avoid Hα maxima.
From the Av map we can estimate the opacity in the Hα band and correct the map of Fig.3a by a factor e. Although some of the relative shifts between CO and Hα clumps are still present after correction, many of the reported displacements disappear or at least they are considerably attenuated. The latter result indicates that a direct comparison between CO and extinction uncorrected Hα maps may be highly misleading, as expected, considering that Av ranges from 2 to 5, as shown above.
Additional insight into extinction effects is illustrated in Fig.3b, showing the overlay between I (gray scale) and radiocontinuum emission at 6cm (S6cm) (contours). M100 possesses an extended source of radio emission associated with the ND. The brightest radio peak lies at (1950)=12h20m23.46s, (1950)= +16∘05′56.5′′. A secondary radio maximum coincides with the optical nucleus. S6cm contains both thermal free-free emission and non-thermal synchrotron emission. In order to estimate the contribution of each component we have considered, first, the existent measurements at three wavelengths (1.2cm, 6cm and 20 cm) and, secondly, a simple hypothesis on the spectral indexes of thermal and non-thermal emission (=-0.1 and =-1.0, respectively, where is defined as S). The resulting best fit indicates that thermal emission from HII regions dominates at 6 cm, as S60. As shown in Fig.3b, there is an excellent spatial correlation between I and S6cm. Henceforth, no systematic offsets exist between massive star formation, traced by S6cm, (not affected by extinction) and molecular gas column densities, traced by I.
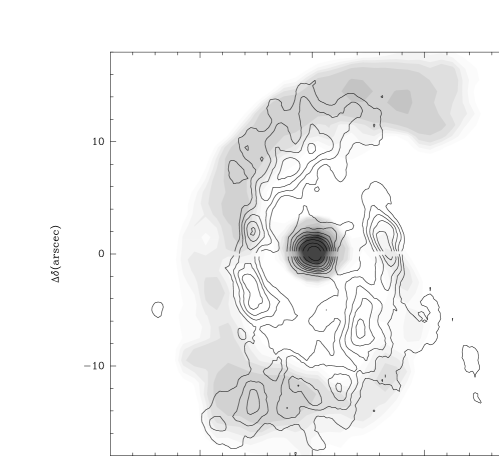
Fig.4 shows the overlay of I contours with the K-band image (in gray scale) which represents the bulk of the old stellar component. The isophote deviations in the inner 6′′ were first interpreted by K95 as the signature of leading arms. A similar interpretation is invoked to account for the K peaks visible at the bar end-points (denoted as K1-2). A rough inspection of Fig.4 suggests that these features might be affected by extinction. The CO spiral arm ridges going across the K nuclear bar, create artificially the weak leading arms signature. The same applies to the K1-2 features. Following a similar procedure to the one used for the Hα map, we have corrected to the first order the K band image by a factor e. We estimate from AK=0.12 Av (where Av comes from equation [1]). In the corrected map, the K1-2 features disappear somewhat and the leading arms are less visible.
5 Kinematics
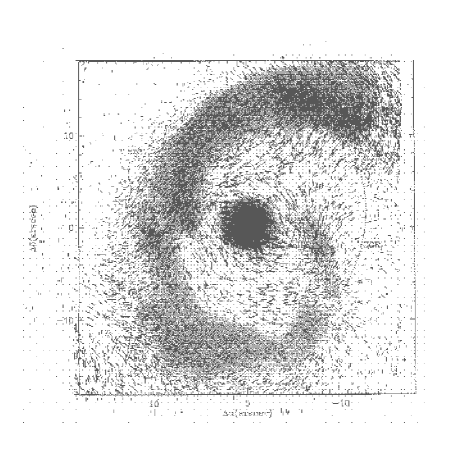
Fig. 5 shows the 12CO(1–0) isovelocity contours superposed on the I10 map. Although basically a rotating pattern, the velocity field is characterized by the presence of strong streaming motions associated with the nuclear spiral arms. Deprojected onto the galaxy plane, the latter reach 50-60kms-1 within the synthesized beam of .
We used the whole data cube to fit both the systemic velocity and the dynamical center, as stated in section 2. The global velocity field is highly symmetric with respect to vsys and C. However, we note that the systemic velocity contour does not go exactly across the dynamical center, coincident with the C central clump. As it is seen in the p–v major axis diagram of Fig 6a (see below), this is due to the strongly asymmetric wings of the CO emission line towards C.
In Fig.6a we show the major axis p–v diagram. The deprojected CO rotation curve (vobs) derived from Fig.6a (assuming i=32o) implies a steep rise of 180kms-1 in less than 2′′, associated with the ultracompact region C, marginally resolved by the interferometer beam. Henceforth, the velocity gradient there might be higher. The dynamical mass enclosed in the inner 100pc is 6.5x10, the percentage of molecular mass in C is 20.
At larger radius (at r=2–5′′) we note the existence of a hole in the major axis p-v diagram, at a position coincident with the interarm crossing, on both sides of the nucleus. Therefore we are unable to determine accurately vobs in this region. We can either assume a simple solution consisting of interpolating between the known values of vobs at r=2′′ and r=7′′, or just consider vobs to be undetermined within this region. The uncertainties of the inner vobs are discussed in section 6.2, in particular a comparison with the rotation curve obtained from the infrared potential(vcir) will help to clarify what might be the “real” trend of rotation curve in the ND. The latter is shown to be crucial in the model fitting. Moreover, although tentatively, we report the detection of CO emission from two symmetric lobes at r=4′′ showing velocities highly forbidden by the preponderant rotating pattern (see Fig. 6a). Isovelocities appear distorted in this region encircling C on both sides of the nucleus (see Fig.5). This could be the signature of orbit crowding in the vicinity of the iILR, or alternatively out of the plane motions.
Farther away, and coinciding with the crossing of the inner spiral arms (r=10–20′′) the declivity at both sides of the p–v diagram might evidence strong streaming motions associated with the arms. However the symmetry of the declivity suggest that we see a real decline of vrot, reflecting the existence of a compact mass distribution in the ND. Disentangling between the kinematical signatures of the axisymmetric and the non-axisymmetric parts of the mass distribution is not straightforward. We illustrate below (section 6) how numerical simulations help us in separating both contributions. See paper I for a discussion of rotation curve at r20′′.
We show in Fig 6b the p–v diagram along the minor axis. We assume the eastern side (x0, eastwards) to be the near side. The most remarkable feature is the strength of the radial component of the non–circular motions at the crossing of the spiral arms. The velocity gradient of the streaming, deprojected onto the galaxy plane, reaches 80km s-1 within a beam of 2′′ (165pc).
6 Numerical simulations
Previous numerical simulations have explored the fit of one pattern associated with the primary bar and the spiral structure in the disk of M100 (G94,S95). The detailed picture of the nucleus available now at different wavelengths allows to refine the model tuning, in particular, to evaluate the feasibility of a two independent patterns explanation for the bar within a bar morphology and to compare the different modelling approaches.
We perform simulations of the molecular clouds hydrodynamics, using a potential as close as possible to reality. This numerical code was developped by Casoli & Combes (1982) and Combes & Gerin (1985) (see the detailed description of the model in these references) and it was first applied to a real galaxy (the interacting system M51) by García-Burillo et al (1993).
We use galaxy plates of M100 at wavelengths that trace the old population, i.e. close to the real mass distribution. The approach is different from what K95’s work is based on for three reasons: first, they use in their simulations a theoretical potential only qualitatively similar to M100’s. When their theoretical potential and their rotation curve are compared with the directly derived from observations the discrepancies are flagrant. Their rotation curve rises much more rapidly (vrot=270kms-1 at r=1 kpc), and it reaches a much larger plateau value farther out (v350 kms-1 for r 5kpc). The position of Lindblad resonances are therefore completely different in their model and in the real galaxy. Secondly their simulations use the SPH code, which induces much more viscosity in the gas behaviour. Henceforth they enhance the action of viscous torques compared to gravitational torques. Finally, they intend to fit the gas response in the whole galaxy disk by a single fast pattern (=70kms-1kpc-1): this is in contradiction with G94,S95 who fit successfully a slow pattern for the outer disk. In the present work two models are explored: one slow mode or two coupled modes (slow+fast).
6.1 Gravitational Potential
We have obtained the potential in the plane of the galaxy from the combination of a large-scale red image of the outer disk and a small-scale K-band image of the nuclear region. The red image is subject to obscuration in the very dusty nucleus, while the K-band image is not extended enough to cover the whole galaxy disk. The two images were deprojected onto the plane of the galaxy, assuming an orientation of PA (position angle)=153∘ and i (inclination angle)=32∘. To combine these two images, we performed a Fourier transform at each radius of the deprojected images, and obtained up to the 8th order Fourier component (in ei8θ). We plotted the radial distribution of the coefficients in both images, and found the relative scale factor to make these distributions continuous. The connection between the two images was done at 10” (800pc). Then the combined image was rebuilt from the Fourier coefficients. Higher order coefficients, from to 8 were completely negligible inside the nucleus, and their contribution was slight (a few % of the ) but visible, in the large-scale disk.
Through 2D- FFT transform of this recombined image, the gravitational potential was obtained in the plane. We run the gas simulations in 3D assuming cylindrical symmetry for the gravitational forces within the plane (Fx, Fy). This hypothesis is justified considering that the gas thickness (H50-100pc) is much smaller than the stellar thickness (H1kpc). Therefore for the gas itself, we can neglect the variations of both Fx and Fy with z, making plausible the local approximation of cylindrical symmetry for them. We assume Hstars to be constant with radius. The vertical z-forces are derived assuming an isothermal stellar disk with a density law. The useful grid used for the potential is 512x512, with a cell of 1” ( 100pc), and a maximum radius of 25 kpc.
6.2 The rotation curve of the simulations (vcir), compared to observations (vobs)
In a first step, we chose a constant mass-to-light ratio (M/L) to compute the rotation curve adopted for the simulations (vcir) and compared with the observed one (vobs). The disagreement was severe, especially for the inner regions where vvobs. The fit can be obtained adjusting M/L as a function of radius. It seems logical to think that M/L is to be lowered in the ND because there might be a non- contribution of young supergiants within the K band, which have a low mass-to-light ratio. Moreover the large amount of dust associated with the high neutral gas column densities of the nuclear region, which even in the K-band modifies the light profile, also demands a modulation of the M/L ratio as a function of radius.
It is far from straightforward to choose the radial trend of the M/L ratio or equivalently the right vcir to introduce in the simulations code. Imposing vcir=vobs, seems unrealistic as it implies an anomalous low M/L ratio for the ND (the implications of this limit case solution are explored in section 6.3.1). Moreover the determination of vobs is, at places, controversial and it is often mixed with strong non-circular motions (see section 5.4).
Still this step is found to be determinant, as the relative positions of resonances, and henceforth, the morphology of the gas response to the wave, depend strongly, first on the pattern speed(s) of the mode(s), and last but not least, on the finally adopted vcir. Indeed the fit of the optimum rotation curve for the simulations must be envisaged as an iterative process, where both Omegap(s) and vcir must be varied coherently to get a sensible fit. In particular when a two patterns scenario is envisaged, we must necessarily find an overlap between the resonances of the fast and slow patterns, otherwise the response of the gas departs markedly from the observations. This coincidence is justified by the theory of modes coupling in spiral disks (Tagger et al, 1987; see also Masset and Tagger, 1997). These restrictions limit considerably the parameter space of the fit when we try the solution of two patterns (see section 6.3.2).
Basically we will perform two families of simulation runs: a) with one pattern and vvobs at all radii, and henceforth with a strongly lowered M/L ratio in the ND and b)with two patterns, dynamically decoupled, for the inner bar and the primary outer bar. The latter implies a different tuning of the rotation curve in the ND (implying vvobs) and consequently for the M/L ratio (see fig.7).


6.3 Best fit solution
We then simulate the hydrodynamics of the gas in the potential computed from the combined K and red images. The gas is launched in equilibrium in circular orbits in the axisymmetrical part of the potential.
The decomposition of the stellar potential has been done in one axisymmetric part and two non-axisymmetric parts, to include the possibility of two nested bars with two different pattern speeds. The nuclear bar in the K-band image has a radius of about 10” ( 1 kpc), and we overlapped the Fourier analysis of the images also at 10”.
The axisymmetric part of the density is first used alone to compute the axisymmetric part of the potential; then we compute the potential over the whole disk due to the central non-axisymmetric part of the density for radii smaller than 10”, and a third FFT transform is completed for the external non-axisymmetric part of the density ( 10”). The second part of the potential is rotated with , generally at a larger angular speed than the main bar, rotating with . Obviously when =, we recover the one mode solution.
We have not considered here the self-gravity of the gas, since it only slightly modifies the overall morphology, given the gas to total mass ratio of NGC 4321 (see S95). We have also run a simple collisional code for the gas, without mass spectrum. Clouds interact with each other via inelastic collisions, with their radial relative velocity losing 75% of their absolute value in the collision. The collisional grid is two-dimensional, since the thickness of the gas disk is not larger than the collisional mean free-path. Clouds are launched with an initial radial distribution which is exponential with a scale length of 7 kpc (70”).
The non-axisymmetric part (one or two bars), rotating as a solid body, is introduced gradually over a time scale of 150 Myr. Simulations carry on until a steady response of the gas is reached; on average the condition is fulfilled after 900 Myr.
For each numerical run we compute a data cube of the simulated galaxy. We use the positions and radial velocities of each cloud at the final time of the simulations. The cube is synthesized using a convolution beam similar to that of the interferometer map, of FWHM2′′ for the ND and a 30m-like beam of FWHM13′′ for the outer disk.
The gas response is mostly sensitive to the action of gravitational torques induced by the non-axisymmetric potential of the disk. Depending on the velocity pattern (s) of the mode (s) and the adopted vcir, molecular clouds accumulate towards the loci of the principal resonances of the disk, delineating pseudo-rings, ovals and spiral edges. The morphology of these substructures and the kinematical signature revealing the population of different orbit families during the secular evolution of the gaseous disk, are to be confronted with the observations and henceforth we derive from this detailed comparison the optimum fit.
6.3.1 The one pattern solution
We extend the slow one pattern solution, found by G94 and S95 for the outer bar+spiral structure, also to the ND, i.e. the two non-axisymmetric parts share the common pattern speed: ==23 kms-1kpc-1. The main difference introduced by the model developed in this section is the inclusion of a bar component in the potential of the ND, present in the K band image. Note that G94 and S95 used a red plate where the nuclear bar is not present. Therefore their orbit structure for the gas clouds was probably not realistic for the ND.
The first family of runs assume a fit on vvobs, following the approach of S95. In the region where there is no information on vobs (between r=2–7′′) we interpolate linearly between the observed values. In the epicyclic approximation we derive the existence of two ILRs: a) iILR=0.4 kpc and b) oILR=2.5kpc (see Fig.5 of S95).
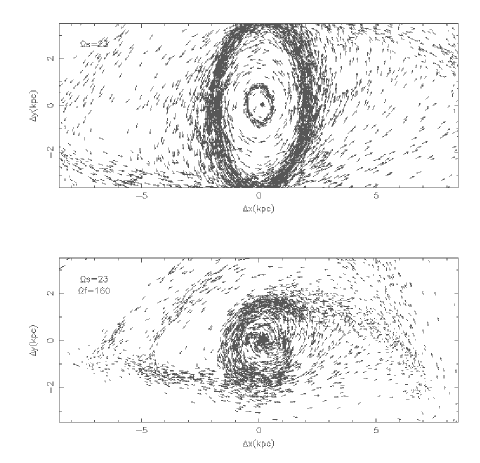
The response of the gas for the outer disk (r30′′) is similar to the best fit solution of S95: the fit of the outer bar+spiral structure is optimized with =23 kms-1kpc-1. In the ND, once a quasi-stationary state is reached after 800 Myr, an elliptical gaseous ring appears between r=3.5kpc and 2kpc, i.e, in the vicinity of the oILR. An additional and less conspicuous ellipsoidal ring appears between r=0.5 and 1kpc, i.e., in the vicinity of the iILR. There is no trace of gaseous orbits aligned along the bar. The particle orbits, as seen by the rotating frame at =23 kms-1kpc-1 are displayed in Fig 8a.
The formation of rings near the outer and the inner ILRs are explained by the long run action of gravitational torques, extremely efficient on a cloud-structured medium as it is molecular gas. The sign of the torques change at the crossing of wave resonances (iILR, oILR, COR and OLR) and also near the maximum of the precession frequency -/2. At the latter position gas spiral arms, formed by the relative precession of the bar driven orbits, change from trailing to leading. The angular momentum transfer to gas leads to the formation of rings near the OLR and also associated with the ILRs. A ring can be formed at an intermediate position between the inner and outer ILR or eventually two rings associated with each resonance, as seen here.
Although the solution is clearly valid for the outer disk, it fails completely to explain the observed morphology of the CO ND:
-
•
First the size and the orientation of the rings hardly correspond with the observed distribution of molecular gas: the gas ring formed near the oILR (r3 Kpc) is much too large compared with the size of the CO ND (r1-1.5 Kpc).
-
•
We also emphasize the absence of gaseous spiral structure in the simulations when they reach steady state. In our model, the gas is stopped at the oILR barrier forming a ring-like source at a distance of r3 Kpc, and it cannot go inwards. Viscous torques acting on the gas at the oILR ring only operate at a much larger time scale and are inefficient to drive the gas inwards, opposed to gravitational torques. The morphology is quite similar to the one obtained by K95
-
•
The formation of the inner ring at iILR is also explained by gravitational torques, still the amount of gas clouds trapped in the inner 200pc is clearly insufficient and it cannot account for the strength of the ultracompact source C.
If we adopt vcir directly obtained from a constant M/L ratio (vvobs in the ND) the oILR locus is at smaller radius (r1–1.5Kpc), but although the formed ring coincides with the size of the ND, no spiral structure is delineated by the gas and no ultracompact source is formed at the center (see the ND particle orbits in Fig.9). With the latter vcir we certainly get the gas closer to the center, but not close enough. Moreover the response of the gas departs also from the observed one.
6.3.2 The two patterns solution
To summarize, the major problem of the one pattern solution is its inability to drive the gas to the inner 500 pc and henceforth to account for the observed morphology of the CO ND. An alternative solution consists of increasing the pattern speed of the mode (this is implicitly assumed by K95 who take =70 kms-1kpc-1). That certainly drives the gas inwards, as the principal resonances shrink if we take a larger pattern speed. However this solution is incompatible with the outer bar+spiral structure fit of G94 and S95): a fast mode solution for the outer disk can be excluded. In fact, the isodensity contours seen in Fig 14 of K95’s model are similar to our fig 8a of our slow one mode solution. The only difference is the scale due to their higher pattern speed.
The high precession rate of the gas orbits in the ND strongly suggests the onset of a fast mode: the maximum of -/2 reaches 200 kms-1kpc-1 and a weighted average precession rate (derived from -/2=(-/2)ICOdr/ICOdr, in the inner 1kpc) is close to 15020kms-1kpc-1. In the slow pattern solution, the rapidly precessing cloud orbits see just an axisymmetric average of the nuclear bar potential, and fail to get in phase with the slow bar forcing. The straightforward approach is to try a two pattern solution: one slow pattern speed () for the outer disk and a faster mode () for the ND, associated with the K-band bar, and whose speed is to be adjusted simultaneously with vcir. Henceforth we build the parameter space of the fit with, first, and secondly, with vcir (obtained via a tunable M/L ratio).
We emphasize that the tuning of both cannot be made independently: we explore a range of pattern speeds between =80-180 kms-1kpc-1, and for a fixed we tune vcir so as to get spatial overlapping of corotation of the fast mode with oILR of the slow mode, otherwise the dynamic decoupling of modes cannot occur (Tagger 1987; Masset and Tagger, 1997). The choice for the range of (80-180) is not arbitrary: in fact outside this range there is no possible overlapping of resonances and no acceptable solutions are to be expected. We underline that the above criterium is a first order approach (strictly valid in the epicyclic approximation), and it is taken as a starting point: in fact the loci of resonances are not circular-like but they can be severely distorted in a barred galaxy(G94). Also they have a broad radial extent and therefore by overlapping we do not mean mathematical coincidence (R=R). In any case, the result of simulations will serve as the conclusive test to judge the goodness of the adopted solution.
Among the explored space of parameters the best agreement with the observations is found within the interval =16020 kms-1kpc-1. Outside this range, i.e. below =140kms-1kpc-1, the tuned vcir fulfilling the overlapping condition makes appear anomalous responses in the gas for the outer disk, in particular, a strong m=3 pattern outside the large-scale bar. Although paper I shows observational evidences of this pattern (both in the red plate and in the molecular gas response), the m=3 mode is weaker than the bar driven m=2 pattern. Moreover the rings or structures formed in the gas response depart markedly from the observations and no steady state is reached in the gaseous disk.
Fig 8b shows the plot of the particle orbits for the best fit evaluated by a standard Chi-squared statistical test: =160kms-1kpc-1. Figs 10a-b display the corresponding synthesized 30m and interferometer-like cubes. The following observed features are accounted for by the best fit solution:
-
•
Formation of a gaseous spiral response in the ND with size and pitch angle comparable with the observed in the CO mini-spiral. The spiral is formed by precessing x1 orbits of the fast pattern, mostly inside its corotation (r=14′′, i.e., R=1.2kpc).
-
•
The gas is efficiently driven inwards by the nuclear bar, overcoming the oILR barrier of the slow pattern (towards r=25′′, leading to =25′′): it falls inwards spiraling from , crossing R and forming an ultracompact source inside the iILR of the fast pattern (at r=2.5′′, giving =200pc). The strength and unresolved size of the central source are in excellent agreement with the observations.
-
•
The goodness of the fit for the outer disk (spiral+large scale bar) is maintained.
-
•
Sakamoto et al, 1995 found that the contribution of the nuclear bar to the overall potential is dominant in the inner 2 kpc region, and that the gaseous spiral structure is mainly driven by the nuclear bar. The rotation curve fitted in our simulations (vcir) shows a declining slope from the center up to r=2 kpc. This is an additional argument supporting the idea that the nuclear bar is dynamically decoupled from the outer bar and that both entities evolve independently. The high precession frequency -/2 in the inner 2 kpc also suggests the onset of a fast mode for the ND.
-
•
Fig 11 shows the superposition of particle orbits seen from the fast frame with the simulated gas response. Nearly close orbits near R shows the characteristic epicyclic shape. Epicycles extend over a broad region (500–800 pc wide in radius), and intersect with the ellipsoidal orbits near the oILR of the slow pattern. Orbit crowding in the region shared by the two families of orbits explain the efficiency of the inwards gas transport. Moreover, the structure of orbits sustaining the spiral gaseous wave show that there is no net upstream or downstream flow of gas all along the spiral arms. This, together with the derived high-extinction towards the CO maxima, explains why H maxima appears either upstream or downstream the CO arms showing no regular distribution, contrarily to the predicted gas behaviour in the single slow pattern scenario.
-
•
There is weak evidence of leading spiral arm structure in our simulations. The onset of a leading arm instability appears, as theoretically predicted, close to the crossing of the ILR of the fast mode (towards r2-3′′) but it is washed out rapidly to form the ultracompact source C. Note however that the leading arms would form at a much smaller radius than reported by K95 (they assume a slower pattern for the ND).
7 Summary and Conclusions
Simulations of the H2 cloud hydrodynamics in the double barred system M100 have shown that the ensemble of observations (optical, infrared, HI and CO maps) are best explained by a two independent bars scenario. The primary stellar bar (of 4.5 kpc radius) and the outer spiral structure share a common pattern speed of =23 kms-1kpc-1 which places corotation at R=8-9 kpc, i.e. beyond the bar end-points though well inside the optical disk. Although the nuclear stellar bar is mostly aligned with the primary bar (within 20∘) it has been shown to lead a fast pattern rotating at =160 kms-1kpc-1, having corotation at R=1.2 kpc radius. Both modes are dynamically decoupled and they show overlapping of their major resonances: corotation of the fast mode falls well within the ILR region of the slow mode.
The present model explains the efficient gas transport towards the nucleus, suggested by the interferometer observations, as a consequence of secular evolution driven by the stellar bar. Molecular gas crosses the ILR region of the slow pattern, spiraling inwards and forming a trailing spiral structure and an ultracompact source encircled by the ILR of the fast pattern (R=2.5′′). Alternative solutions are unable to account for the CO observations. In particular, in the slow pattern solution gas is stopped at the ILR barrier and forms a nuclear ring outside the ND extent. No central gas condensation is formed either. The fast pattern solution proposed by K95 (=70 kms-1kpc-1) worsens the fit for the outer bar+spiral structure found by GB94. In addition, two independent methods based on the morphology of the residual velocity field for the gas (S95) and the identification of spurs in optical pictures (e.g. Elmegreen et al 1992) confirm the value of R reported above.
We conclude that the gas response derived from the CO interferometer map, and the relation between the different stellar (K image) and gaseous tracers of the ND (H) are best explained by the two pattern model. In particular, it explains the high CO concentration in the central part. This gas concentration could be eventually the cause of the nuclear bar destruction in this fastly evolving galaxy (see Norman et al 1996).
Acknowledgements. This work has been partially supported by the Spanish CICYT under grant number PB96-0104. We thank J. Knapen for providing us with the H I, H and K-band images used in this paper.
References
- [1988] Arsenault R., Boulesteix J, Georgelin Y., Roy J.R., 1988, A&A, 200, 29
- [1989] Arsenault R., 1989, A&A, 217, 66
- [1990] Arsenault R., Roy J.R., Boulesteix J., 1990, A&A, 234, 23
- [1992] Athanassoula E., 1992, MNRAS, 259, 345
- [1992] Canzian B, 1992, PhD, Caltech Astronomy Department (USA)
- [1982] Casoli F., Combes F., 1982, A&A, 110, 287
- [1990] Cepa J., Beckman J.E., 1990, A&AS, 83, 211
- [1987] Cernicharo J., Guélin M., 1987, A&A, 176, 299
- [1985] Combes F., Gerin M., 1985, A&A, 150, 327
- [1994] Combes F., 1994. In: Schlossman I. (ed). Mass Transfer Induced Activity in Galaxies. Lexington Proceedings.
- [] Dutrey, A., Ungerechts, H. 1995–1996, IRAM PdB Interferometer and 30-m Radiotelescope Flux Measurements Reports 11–13, IRAM document
- [1992] Elmegreen B.G., Elmegreen D.M., Montenegro L., 1992, ApJS, 79, 37.
- [1993] Friedli D., Martinet L., 1993, A&A, 277, 27
- [1993] Friedli D., Benz W., 1993, A&A, 268, 65
- [1995] Friedli D., Benz W., 1995, A&A, 301, 649
- [1994] García-Burillo S., Sempere M.J., Combes F., 1994, A&A, 287, 419, GB94
- [1993b] García-Burillo S., Combes F., Gerin M., 1993b, A&A, 274, 148
- [] Guilloteau, S. and Forveille, T. 1989, Grenoble Image and Line Data Analysis System, IRAM & Groupe d’Astrophysique, Observatoire de Grenoble document
- [] Kennicutt R.C., 1989, ApJ, 344, 685
- [1995] Knapen J.H.,Beckman J.E., et al., Heller, C.H., Sholsman I., de Jong R.S., 1995, ApJ, 454, 623 K95
- [1996] Knapen J.H., Beckman J.E., Cepa, J., Nakai N., 1996, A&A, 308, 27
- [] Lucas, R. 1992, Continuum and Line Interferometer Calibration, IRAM document
- [1997] Masset F., Tagger M., 1997, A&A, 322, 442
- [] Neri, R., Kahane, C., Lucas, R., Bujarrabal, V., Loup, C., 1997, in preparation
- [] Norman, C.A., Sellwood, J.A., Hasan, H., 1996, ApJ, 462, 114
- [1986] Pierce J.P., 1986, AJ, 92, 285
- [1995] Rand R.J., 1995, AJ, 109, 2444
- [1995] Rauscher B.J., 1995, AJ, 109, 1608
- [1995] Sakamoto K., Okumura S., Minezaki T., et al., 1995, AJ, 110, 2075
- [1995] Sempere M.J., García–Burillo S., Combes F., Knapen J.H., 1995, A&A, 296, 45, S95
- [1997] Sempere M.J., García–Burillo S., 1997, A&A, 325, 769 paper I
- [1995] Shaw M., Axon D., Probst R., Gatley I., 1995, MNRAS, 274, 369
- [1988] Strong A.W., Bloemen J.B.G.M., Dame T.M., et al., 1988, A&A, 207, 1
- [1987] Tagger M., Sygnet J.F., Athannassoula E., Pellat R., 1987, ApJL, 318, 43
- [1964] Toomre A., 1964, ApJ, 139, 1217
- [1991] Vaucouleurs G. de, Vaucouleurs A. de, Corwin H.G., et al., 1991, Third Reference Catalogue of Bright Galaxies. Springer Verlag, New York.
- [] Vogel, S.N., Wright, M.C.H., Plambeck, R.L., Welch, W.J., 1984, ApJ, 283, 655
- [1981] Weiler K.W., van der Hulst J.M., Sramek R.A., Panagia N., 1981, ApJ, 243, L151
- [] Wild, W., 1995, The 30m Manual: A Handbook for the 30m Telescope, IRAM document