Metallicity distribution of bulge globular clusters in M 31
Abstract
This paper presents 3600—5400 Å integrated spectra of 19 globular clusters (or candidates) projected on the central regions of M 31, ′ (1.2 kpc). We check the cluster nature of these objects, and derive their ages, metallicities and reddenings. From the initial sample, 16 objects turn out to be true star clusters, two are Galactic dwarf stars, and one is a high redshift background galaxy. Only two clusters are found to be super metal-rich, suggesting that this phenomenon is not very common. For some clusters, we cannot rule out the possibility that they are of intermediate age; this requires confirmation by observations at the calcium triplet. We also present the metallicity histogram of this central bulge sample and discuss possible scenarios to explain its properties.
Key Words.:
Galaxies: formation — Galaxies: individual: M 31 — Galaxies: star clusters1 Introduction
Globular clusters in the Galaxy and in the Local Group play a fundamental role in connecting studies of individual stars and integrated properties of star clusters.
In this respect, studies of star clusters in the Andromeda galaxy (M 31) are particularly suitable. The proximity and inclination of this giant spiral allow one to study in detail each of its constituent sub-systems, halo, disk, and bulge even near the galaxy center.
M 31 has been already extensively surveyed for globular clusters e.g., Vetesnik (1962), Sargent et al. (1977) and the Bologna group catalogue by Battistini et al. (1987). The brightest clusters have been explored by means of integrated spectroscopy, which makes it possible to determine some of their fundamental parameters, such as metallicity, age and reddening, as well as to confirm their true nature as globular clusters (e.g. Burstein et al. 1984, Tripicco 1989, Huchra, Brodie & Kent 1991, Jablonka, Alloin & Bica 1992, Bica et al. 1992, and Huchra et al. 1996). A number of studies have concentrated on identifying clusters near the center of M31, e.g., Alloin, Pelat & Bijaoui (1976), Aurière, Coupinot & Hecquet (1992) and Battistini et al. (1993).
In the present paper, we concentrate on the central 10′ by 10′ region of M 31 and derive velocities, metallicities, ages and reddenings of the confirmed star clusters. This work is a first attempt at getting a picture of the properties of globular clusters in the inner bulge of a spiral galaxy (other than our own), which in turn must help constrain models of galaxy formation and evolution. One of our principal goals is to determine how frequent the occurrence of super metal-rich globular clusters can be. Bulge central regions, locations of intense star formation, appear to be one of the best places to find them.
The methods employed in the present work, i.e. comparison with template cluster spectra and grids of spectral properties as a function of age and metallicity, have been developed and extensively used to study star clusters in our Galaxy (e.g. Bica & Alloin 1986a,b), the Magellanic Clouds (e.g. Santos et al. 1995a), M 31 itself (Jablonka et al. 1992), and more recently NGC 5128 (Jablonka et al. 1996).
This paper is organised as follows: Section 2 gives a description of the sample; Section 3 details observations and reductions; Section 4 deals with the radial velocity measurements; Section 5 presents measurements of equivalent widths and results for cluster parameters; a discussion of the results is given in Section 6. Finally, we summarise our conclusions in Section 7.
2 Description of the sample
| NB | (H91) | (TP) | V | Class | Other names | ||
|---|---|---|---|---|---|---|---|
| ∘ ′ ′′ | mag | ||||||
| 1 | 0 39 47.1 | 41 03 13 | -31130 | -34535 | 15.79 | A | V 80, G 169, Bo 107 |
| 2 | 0 39 42.0 | 41 02 48 | -31050 | -24622 | 16.54 | A | V 78, G 158, Bo 96 |
| 3 | 0 39 45.6 | 41 01 31 | -32322 | -33111 | 15.20 | A | V 75, G 165, Bo 103 |
| 4 | 0 39 49.1 | 41 01 16 | -28634 | -20025 | 16.33 | A | V 77, G 174, Bo 112 |
| 5 | 0 39 45.8 | 41 00 59 | +12042 | 17.40 | A | Bo 104 | |
| 6 | 0 39 51.4 | 40 58 08 | +19162 | 16.38 | A | Bo 118 | |
| 7 | 0 39 50.3 | 40 57 36 | -49729 | -58933 | 16.05 | A | V 67, G 177, Bo 115 |
| 8 | 0 39 50.2 | 40 56 18 | -19656 | 17.13 | A | G 175, Bo 114 | |
| 9 | 0 39 46.9 | 40 55 52 | -9043 | -9831 | 16.14 | A | V 61, G 168, Bo 106 |
| 10 | 0 39 57.2 | 40 58 57 | -7522 | 14.71 | A | Bo 124 | |
| 11 | 0 40 00.3 | 40 58 15 | -48325 | -44517 | 14.47 | A | G 185, Bo 127 |
| 12 | 0 39 59.6 | 40 56 17 | -19335 | 17.09 | A | V 66, G 184, Bo 126 | |
| 13 | 0 40 07.5 | 40 57 37 | -47722 | 16.52 | A | V 71, G 190, Bo 134 | |
| 14 | 0 39 52.0 | 41 01 09 | -31130 | 17.27 | B | Bo 119 | |
| 17 | 0 39 50.3 | 41 01 05 | -56151 | 18.26 | A | ||
| 21 | 0 39 53.8 | 40 59 32 | -77340 | 17.69 | B | ||
| 22∗ | 0 39 42.2 | 41 03 31 | -20897 | 18.41 | C | ||
| 32∗ | 0 39 42.9 | 41 00 43 | -17060 | 18.82 | C | ||
| 38∗∗ | 0 39 53.4 | 40 57 01 | 43 84781 | C |
-
H91 = Huchra et al. (1991); TP = This paper. The remaining information is from Battistini et al. (1993). (*) - found to be a Galactic star (Sect. 4); (**) - found to be a high redshift galaxy (Sect. 4).


We selected objects in the inner region of M 31, either previously confirmed star clusters or candidate clusters, from the recent list published by Battistini et al. (1993). Objects in their list with probability class to be globular clusters of A, B and C were considered in the present study, with priority given to the brightest and reddest ones. We optimised the positioning and orientation of the slits in the masks in order to maximise the number of clusters observed in a single exposure and ended up with 24 different objects. Usable spectra have been acquired for 19 of them, among which 12 have never been observed spectroscopically. We list some useful information about our sample in Table 1.
The distribution of the objects on the sky is shown in Figure 1. The objects span a region roughly 5’ x 9’ (1.1 x 2.0 kpc assuming a true distance modulus of (m-Mo)=24.43; Freedman & Madore 1990) just to the west and south of the nucleus. The position of the M 31 nucleus and the orientation of the major axis are also shown in the figure.
Table 1 contains, by columns: (1) - object number according to Battistini et al. (1993); (2) and (3) - right ascension and declination (B1950); (4) - radial velocity given by Huchra et al. (1991); (5) - radial velocity measured from our spectra (Sect. 3); (6) V magnitude (Battistini et al. 1993); (7) - Bologna group probability class for the object to be a globular cluster: A - very high, C - low; and (8) - designations in other catalogues: V = Vetesnik (1962), G = Sargent et al. (1977), and Bo = Battistini et al. (1987). Some clusters have additional designations which are given in Battistini et al. (1993).
3 The observations
The observations were carried out with the 4.2m William Herschel Telescope on La Palma with the LDSS-2 multi-slit spectrograph for which appropriate masks were designed with the LEXT program. A slit width of 1.5′′ was used, and slit lengths varied between 10′′— 60′′. Four fiducial stars were used for field acquisition. Two masks have been created with 24 objects (Mask 1) and 18 objects (Mask 2) respectively; 9 objects were in common between the two masks.
Spectroscopy of our two masks was obtained on October 19, 1995, using a TEK CCD detector with m pixels. The image scale is 0.59′′/pixel and the field is 10′ 10′. For each mask, we acquired exposures with the 2.4Å /pixel “high” dispersion grism, centered on 4200Å. The total wavelength range is 3300—6100Å, see Table 2 for further details. The standard stars BD +28∘4211, Feige 110 and G191B2B (Stone 1977, Oke 1974) were observed through a wide-slit for flux calibration. Finally, CuAr arcs were taken throughout the night for wavelength calibration.
3.1 Data reduction
We adapted the Multired tool developed by Olivier Le Fèvre and ran it under IRAF (Le Fèvre et al. 1995). Multired allows the simultaneous reduction of spectra in a given mask. It makes use of the IRAF ccdred and longslit packages, in the usual way. Although flat field frames were taken, they could not be used due to some technical problems. Consequently, we limited our analyses to the 3600—5400 Å range, where the Signal/Noise ratio is higher, and where the spectral distribution is not disturbed by border effects. The final spectral resolution, as measured from the comparison arcs, is 7Å.
The cluster G 185 (NB 11) has a small companion 4′′ to the North-West (Couture et al. 1995), which was not included in our aperture.
The object NB 38, which in Table 1 was Bologna class C, turns out to be a high redshift galaxy, with . The observed spectrum of this galaxy, not corrected for redshift, is shown on the top panel of Figure 2. A simple calculation shows that a typical galaxy placed at the measured redshift would indeed exhibit a size comparable to M31 genuine globular clusters. Its observation points however towards a rather low extinction in M31 along this line of sight. NB 22, also a class C object, is a dwarf Galactic star as shown in the bottom panel of Figure 2. We compare this spectrum with the stellar template of spectral type M0/M1 V by Santos et al. (1995b). The agreement is excellent, which indicates that NB 22 is a foreground dwarf Galactic star. We also tested giant stars, but spectral features, continuum distribution and luminosity arguments rule out this possibility. The object NB 32 (Bologna class C) is also a Galactic dwarf star of spectral type G 2/G 3 (middle panel), as indicated by the comparison with the corresponding template from Santos et al. (1995b).
| Mask 1 | Mask 2 | ||
|---|---|---|---|
| Number of objects | 24 | 18 | |
| Dispersion (Å) | 2.4 | 2.4 | |
| Resolution (Å) | 6 | 6 | |
| Wavelength Coverage (Å) | 3200—6100 | 3200—6100 | |
| Total exposure time (sec) | 7200 | 7200 | |
| Individual exposures (sec) | 41800 | 600+1200+31800 | |
4 Radial velocities
The method we employed for the radial velocity determinations is the cross-correlation of object against template spectra (Tonry & Davis 1979). We formed a cross-correlation template using the 7 clusters with known velocities from Huchra et al. (1991). These 7 cluster spectra were continuum-normalised, shifted to zero velocity and co-added using IRAF routines. In this resulting spectrum, we checked strong absorption features (e.g. Ca II H and K, H Balmer lines and CH G-band) to ensure that this template is indeed at zero velocity. As well, we cross-correlated each of the 7 input spectra against the template, and found a mean difference of 7 with a standard deviation of 60 between the input and measured velocities.
Using the IRAF routine xcsao within the rvsao package, the spectra of the objects have been cross-correlated with the zero-velocity template, and the results are shown in column 5 of Table 1. The uncertainties given in the Table are one sigma errors. There is good agreement in the velocity values for the 7 globular clusters in common with Huchra et al. (1991). The blueshifts indicate membership to M 31. The 2 objects somewhat redshifted, NB 5 and NB 6, can be considered as belonging to the tail of the velocity distribution of M 31 clusters (e.g. Huchra et al. 1991).


| Window | Absorber | Limits | G 169 | G 158 | G 165 | G 174 | Bo 104 | Bo 118 | G 177 | G 175 | G 168 | Bo 124 | G 185 | G 184 | G 190 | Bo 119 | |
|---|---|---|---|---|---|---|---|---|---|---|---|---|---|---|---|---|---|
| (Å) | NB 1 | NB 2 | NB 3 | NB 4 | NB 5 | NB 6 | NB 7 | NB 8 | NB 9 | NB 10 | NB 11 | NB 12 | NB 13 | NB 14 | NB 21 | ||
| 2 | CN, H9 | 3814-3862 | 9.3 | 19.3 | 19.8 | 25.5 | 7.9 | 8.5 | 22.9 | 9.3 | 13.2: | 17.5 | 11.6 | 8.6 | 11.4 | 10.9 | 5.3 |
| 3 | CN, H8 | 3862-3908 | 7.1 | 15.0 | 13.8 | 18.8 | 8.6 | 7.7 | 14.4 | 4.6 | 13.3: | 11.8 | 8.1 | 8.6 | 7.9 | 7.7 | 6.1 |
| 4 | Ca II K | 3908-3952 | 11.9 | 20.9 | 18.8 | 23.1 | 13.2 | 10.6 | 19.8 | 8.0 | 12.9 | 17.3 | 13.7 | 9.7 | 15.3 | 14.1 | 10.2 |
| 5 | Ca II H,H | 3952-3988 | 10.6 | 15.3 | 14.1 | 16.3 | 12.1 | 10.2 | 13.5 | 10.3 | 15.4 | 13.6 | 11.3 | 10.1 | 11.6 | 9.4 | 8.5 |
| 9 | H | 4082-4124 | 2.8 | 3.2 | 3.3 | 5.3 | 4.1: | 4.3 | 4.4 | 5.5 | 5.0: | 4.3 | 2.2 | 4.6 | 2.7 | 2.2 | 3.5 |
| 10 | Fe I | 4124-4150 | 1.2 | 3.5 | 3.4 | 6.0 | 0.8: | 1.2 | 5.2 | 0.3: | 0.8: | 3.5 | 2.9 | 1.2: | 1.7 | 2.0 | 1.3 |
| 11 | CN | 4150-4214 | 4.2 | 10.3 | 11.6 | 17.8 | 3.2: | 4.7 | 15.3 | 1.4: | 8.9 | 11.5 | 7.6 | 2.6 | 4.2 | 5.6 | 5.6 |
| 12 | Ca I | 4214-4244 | 1.9 | 4.5 | 4.5 | 6.1 | 3.1: | 2.6 | 5.2 | 1.6 | 3.4 | 4.3 | 2.9 | 2.2 | 2.2 | 3.9 | 2.5 |
| 13 | Fe I | 4244-4284 | 2.7 | 6.3 | 6.4 | 7.2 | 3.8: | 3.4 | 7.2 | 2.7 | 7.2 | 5.3 | 3.8 | 2.9 | 4.2 | 5.7 | 3.8 |
| 14 | CH G | 4284-4318 | 5.9 | 9.9 | 9.8 | 10.7 | 6.2 | 5.7 | 9.8 | 4.3 | 9.8 | 8.6 | 6.5 | 5.7 | 7.2 | 8.5 | 6.3 |
| 15 | H | 4318-4364 | 4.7 | 4.2 | 6.2 | 4.9 | 4.4 | 5.6 | 4.7 | 8.0 | 7.8 | 5.3 | 4.8 | 5.0 | 5.1 | 6.6 | 6.4 |
| 16 | Fe I | 4364-4420 | 3.6 | 6.8 | 7.8 | 8.0 | 4.0: | 4.4 | 8.6 | 3.1 | 7.7 | 6.4 | 5.5 | 3.7 | 6.2 | 5.7 | 3.8 |
| 27 | H | 4846-4884 | 3.8 | 3.5 | 3.7 | 3.3 | 2.7: | 4.0 | 4.1 | 4.8 | 4.5 | 3.7 | 3.4 | 3.8 | 4.3 | 5.4 | 4.0 |
| 31 | Fe I | 4998-5064 | 2.3 | 5.2 | 6.6 | 8.4 | 2.1: | 2.7 | 5.0 | 4.0 | 6.8 | 4.8 | 3.8 | 1.4: | — | 4.2 | 4.8: |
| 32 | Fe I, C2 | 5064-5130 | 2.6 | 5.1 | 6.5 | 9.8 | 4.3: | 3.1 | 9.9 | 3.1 | 5.6 | 5.0 | 4.1 | 1.7: | — | 1.8 | 1.2: |
| 33 | MgH, C2 | 5130-5156 | 1.6 | 2.9 | 3.3 | 5.1 | 2.5: | 1.5 | 4.6 | 1.1 | 2.5 | 2.7 | 2.0 | 1.3: | — | 1.8 | 2.5: |
| 34 | Mg I, MgH | 5156-5196 | 4.2 | 8.0 | 8.0 | 11.9 | 5.3: | 4.0 | 11.0 | 2.7 | 7.3 | 7.0 | 5.3 | 2.7: | — | 4.8 | 6.0: |
| 35 | MgH | 5196-5244 | 2.6 | 4.6 | 5.0 | 6.4 | 4.0: | 2.4 | 6.6 | 2.0 | 4.0 | 4.4 | 2.7 | — | — | 3.4 | 4.0: |
| 36 | Fe I | 5244-5314 | 2.4 | 4.0 | 4.5 | 5.6 | 2.4: | 2.6 | 6.3 | 1.5 | 3.2 | 4.6 | 3.3 | — | — | 3.4 | 2.6: |
5 Cluster parameters
Figure 3 shows the resulting calibrated spectra rebinned to the rest frame and roughly arranged according to continuum slope. Notice that some clusters are quite red but do not present strong metallic absorption lines, which suggests significant reddenings. Also, metallic features show a wide range of strengths indicating a range in metallicities.
The equivalent widths (EWs) of the spectral absorption features were measured according to the window limits and continuum levels defined by Bica & Alloin (1986a,b, 1988). The results are shown in Table 3 where we give the window number, main absorbers, window limits and provide the resulting EWs for the sample objects. The objects NB 22 and NB 32 (Galactic dwarf stars) and NB 38 (a galaxy) are not included in the analysis. Also, the faintest star cluster in the sample, NB 17 (Table 1), has been excluded because the Signal/Noise ratio of its spectrum is too low for the present purpose (Fig. 3). Typical equivalent width errors arise mainly from uncertainties in the continuum levels, and they imply a 5% error for strong features as Ca II K, and a 10—15% error for the weaker ones.
Two objects, G 177 and G 158, are in common with Jablonka et al. (1992). A comparison of EWs between the two works shows a very good agreement for G 177, within 5% for the strong absorption features, and 10—20% for the weak ones. On the other hand, the values differ significantly for G 158 in the sense that they are smaller in the present spectrum. We suspect contamination or instrumental problems in the Jablonka et al. (1992) spectrum of G158. Despite this, we confirm a high metallicity (see below) and establish its nature as an old globular cluster rather than a possible intermediate-age cluster (Bica et al. 1992).
The emission lines [OIII]λ4959,5007 and [OII]λ3727, superimposed on the spectrum of G 177 (Figure 3), deserve special mention. In the spectrum of Jablonka et al. (1992), in spite of the lower resolution, the [OIII]λ5007 line can be recognised, together with H which fills in the stellar absorption, appearing in emission. In the present spectrum we measured a ratio ([OII]λ3727/[OIII]λ5007)=. This observed ratio implies photoionisation, and any reddening correction would further confirm this mechanism instead of shocks (Baldwin, Phillips & Terlevich 1981). An inspection of the region of G 177 in the Hodge (1981) M 31 Atlas does not show any prominent H II region associated with the M 31 inner disk. A possible explanation for this emission might be diffuse gas ionised by hot post-AGB stars of this very metal-rich globular cluster itself, similar to the scenario proposed by Binette et al. (1994) to explain gas emission associated with very metal-rich old populations in the central regions of galaxies. In fact, in the UV, some moderately metal-rich Galactic globular clusters have a flux excess shortward of 2000 Å (Bonatto, Bica & Alloin 1995 and references therein). An alternative to this hypothesis is the presence of planetary nebula in the cluster.
5.1 Ages and metallicities from Bica & Alloin’s (1986b) grid
In order to determine ages and metallicities we first use a grid of star cluster spectral properties from Bica & Alloin (1986b). This grid connects EWs with age and . Following Jablonka et al. (1992), we use a minimisation procedure which compares the EWs of the present observed clusters (Table 3) with those of the grid. Although age and metallicity are given in relatively large steps in the grid, this method allows one to test the possibility that the star cluster is younger than classical globular clusters. The results for metallicity and ages are given, respectively in columns 2 and 3 of Table 4.
For some clusters, the age/metallicity solution is not unique within the errors in EWs. Indeed, old metal-poor globular clusters and intermediate-age star clusters are nearly indistinguishable in the blue-violet region, e.g. Bica & Alloin (1986a,b) and Bica, Alloin & Schmitt (1994). The blue Horizontal Branch in metal-poor globular clusters mimics the relatively high main sequence and turnoff region of intermediate-age clusters (1—5 Gyrs), producing similar spectral distributions and enhanced Balmer absorption. In such cases, it is necessary to observe the clusters in the near-IR, particularly at the Ca II triplet in order to check for possible dilution effects in the blue-violet (Bica & Alloin 1987). The region of the M 31 bulge might also contain intermediate-age clusters from the inner disk.
| Name | age (Gyr) | Template | (Å) | |||||
|---|---|---|---|---|---|---|---|---|
| grid | grid | metals | (*) | H91 | CM94 | |||
| NB 1=G 169 | 1.0 | G 3 | 0.050.04 | 31.4 | 1.10 | 1.18 | 1.35 | |
| NB 2=G 158 | 0.0 | G 1 | 0.100.05 | 62.2 | 0.03 | |||
| NB 3=G 165 | 0.0 | G 1 | 0.040.04 | 62.3 | 0.04 | 0.56 | ||
| NB 4=G 174 | 0.6 | G 1† | 0.040.04 | 78.9 | 0.55 | 0.29 | 0.13 | |
| NB 5=Bo 104 | 1.0 | G 3 | 0.000.03 | 34.3 | 0.98 | |||
| NB 6=Bo 118 | 1.0 | G 3 | 0.250.03 | 32.6 | 1.05 | |||
| NB 7=G 177 | 0.4 | G 1† | 0.040.02 | 71.1 | 0.31 | 0.15 | 0.32 | |
| NB 8=G 175 | 1.0/1.5 | 1—5 or ? | I 1/I 2 or G 3/G 4? | 0.350.05 | 21.4 | 1.53 | 1.16 | |
| NB 9=G 168 | 0.0/0.5 | G 1/G 2 | 0.170.07 | 46.6 | 0.48 | 1.13 | ||
| NB 10=Bo 124 | 0.0 | G 1 | 0.150.02 | 56.9 | 0.14 | |||
| NB 11=G 185 | 0.5 | G 2 | 0.020.02 | 42.9 | 0.63 | 1.08 | 1.19 | |
| NB 12=G 184 | 1.5/1.0 | G 3/G 4 | 0.120.02 | 22.3 | 1.50 | 0.91 | ||
| NB 13=G 190 | 0.5 | G 2 | 0.020.03 | 41.0 | 0.71 | 1.96 | ||
| NB 14=Bo 119 | 0.5 | G 2 | 0.020.03 | 45.5 | 0.53 | |||
| NB 21 | 1.0 | G 3 | 0.030.03 | 33.5 | 1.01 |
-
H91 = Huchra et al. (1991); CM94 = Cohen & Matthews (1994). (*) this metallicity is based on a relation for globular clusters (Sect. 5.3). : this cluster is more metal-rich than the template G 1, which was used for the reddening determination.
The top panel of Figure 4 illustrates clearly the problem of intermediate-age/old metal-poor degeneracy. We display an average of the intermediate-age templates I 1 and I 2 (1 to 3 Gyrs) from Bica (1988), which includes Galactic open clusters and LMC clusters, and the templates G 5 and G 3, which are averages of Galactic globular clusters with and , respectively. Notice the resemblance in Balmer lines and metallic features, as well as in continuum distribution. We also show the M 31 clusters Bo 118 and G 175 to illustrate the difficulty in classifying unambiguously these objects, especially G 175, because of its unusually strong Balmer lines. In Table 4 we point this out explicitly for G 175, and it must be kept in mind that a wider spectral range should be observed in order to establish the nature of all objects with -. The occurrence of intermediate-age clusters with metallicity cannot be ruled out in a scenario of cannibalism (Section 6.3). In fact, intermediate-age clusters with this metallicity, such as NGC 419 in the SMC (Bica & Alloin 1986a), could have been accreted.
Assuming that G 175 and Bo 118 are indeed globular clusters, they would show intrinsic differences compared with Galactic globular clusters. At a given metallicity, these two clusters have exceedingly strong Balmer absorption, as previously reported by Burstein et al. (1984). This can be verified with the help of EWs of metallic features (Table 3) and relative strengths of Balmer to nearby metallic features, such as Ca II K vs H+H, and G band vs H. Bo 118 has EWs of metallic features like those of the template G 3 (-), but metallic/Balmer line ratios like those of G 4 (-). G 175 is further shifted with respect to average properties of Galactic globular clusters, in the sense that metallic features are like those of G 3/G 4, and the metallic/Balmer ratios are more similar to those of the G 5 template (). This would suggest a more populated blue-Horizontal Branch in M 31 clusters at metallicities comparable to Galactic globular clusters. We point out that in our Galaxy there exists a considerable dispersion in the Horizontal Branch properties of globular clusters at a given metallicity, the second parameter phenomenon, at least in the halo (e.g. Zinn 1980).
5.2 Reddening from templates
Ideally, the best spectroscopic method to determine reddening for star clusters is to have available reddening-free template spectra of similar properties, and to use a wavelength baseline as wide as possible, as in the study of globular clusters in NGC 5128 by Jablonka et al. (1996). Although the present wavelength range is limited, it is still useful to constrain the reddening values.
We used the globular cluster templates G 5 to G 1, ranging from to nearly-solar metallicity as reference spectra (Bica 1988). In the case of G 1, the Bica (1988) template has been complemented with the M 31 globular clusters of comparable metallicity G 222 and G 170 (Jablonka et al. 1992) in order to further improve the Signal/Noise ratio. For completeness, we also included the I 1/I 2 template, since for some clusters in Table 4, this possibility cannot be ruled out (Sect. 5.1). However, we point out that the reddening is not affected since, in the present spectral domain, the spectral distributions of I 1/I 2 and the old metal-poor globular cluster templates are very similar; this is illustrated in the top panel of Figure 4 where we also include an example of reddening determination. In the bottom panel we show an example of a reddening-corrected metal-rich M 31 globular cluster (Bo 124) compared to the G 1 template.
The template adopted in each case is given in column 4 of Table 4, and the resulting in column 5.
According to Burstein & Heiles (1984), the foreground (Milky Way) reddening in the direction of M 31 is . The results for the M 31 cluster sample by Jablonka et al. (1992) suggested a somewhat lower value . In the present study, the lowest values and corresponding uncertainties (Table 4) are compatible with the latter value. For 6 other clusters we derive values significantly in excess of this limit, which indicates considerable internal reddening arising probably in dust clouds in the inner disk of M 31.
5.3 A more detailed ranking of metallicities
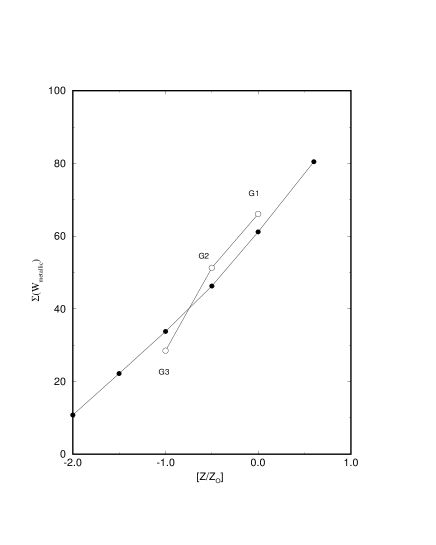
A more precise ranking of clusters by metallicity may be obtained by summing the EWs of metallic features, as did Jablonka et al. (1996). In the present paper we adopt the following absorption windows: Ca II K (#4), Fe I (#10), CN (#11), Ca I (#12), Fe I (#13), CH G (#14) and Fe I (#16). These features are not affected by Balmer lines and are available for all sample clusters (Table 3). The resulting sum of the equivalent widths () is given in column 6 of Table 4. The calibration of with for old clusters in the grid by Bica & Alloin (1986b), is displayed in Figure 5. We also include in this figure a relation of for the templates G 1, G 2 and G 3, in which they are assumed to have metallicities and , respectively, similar to that applied to NGC 5128 globular clusters by Jablonka et al. (1996). Both approaches provide similar results.
Applying the Bica & Alloin (1986b) calibration to the M 31 clusters (assumed to be genuine globular clusters), we obtain the values listed in column 7 of Table 4. Applying the same relation to G 1, G 2 and G 3, we obtain and , respectively.
A fundamental problem in stellar populations is the abundance calibration of the metal-rich end. For the clusters in common with the spectroscopic study by Huchra et al. (1991), we show their values in column 8 of Table 4. In general, the same ranking is found, but the Huchra et al. metallicities are systematically lower. This question of calibration has been recently been addressed by means of high dispersion spectra of individual stars (Barbuy et al. 1992, 1997), deep colour magnitude diagrams (Ortolani et al. 1995), and integrated spectra (Santos et al. 1995b), in the case of the key nearly-solar metallicity globular clusters NGC 6553 and NGC 6528 (which belong to the G 1 template). The iron abundance in such clusters appears to be somewhat under solar (), whereas [-elements/Fe] are enhanced, resulting in an overall metallicity . In this sense, the present calibration, which includes -elements, tends to give higher values but is fundamentally compatible with the based scale employed by Huchra et al. (1991).
We also include in Table 4 (column 9) metallicity estimates from integrated photometry by Cohen & Matthews (1994, hereafter CM94). A comparison of the latter values with those of the present study (column 7) shows a systematic difference in the sense that CM94 values are lower. However, the two most metal-rich clusters G 177 and G 174 have spectral absorptions indistinguishable from those of the most metal-rich galaxy nuclei (Section 6.3). The values estimated by CM94 for these clusters would imply sub-solar metallicities for the nuclei of giant galaxies. Concerning the metallicity ranking, the agreement is good between the two studies, with the exception of G 175, G 184 and G 190. G 175 and G 184 are considerably reddened (Table 4), and the higher metallicity values in CM94 can be explained by the fact that they adopted a constant reddening for their cluster sample. G 190 would be a very metal-poor cluster according to their value. However, the spectral features (Figure 3) are clearly those of a metal-rich cluster; in particular the G band is strong and the Balmer lines are weak.
6 Discussion
6.1 Metallicity distribution in the bulge
Assuming that all objects are indeed old globular clusters, we show in Figure 6 the histogram using column 7 of Table 4. The sample is small, but some interesting features are present. The distribution is basically Gaussian with an average and intrinsic , for this central bulge sample in M 31. Recently Barbuy, Bica & Ortolani (1997) have studied in detail the sample of 16 Galactic globular clusters projected within a radius of 5∘ of the Galactic center, based on colour magnitude diagrams; they have obtained with . Thus, these Galactic and M 31 bulge globular cluster samples have similar metallicity distribution. The Baade’s Window sample of K giants studied by McWilliam & Rich (1994) has with . Consequently, both the bulge globular cluster samples in our Galaxy and in M 31 seem to be, on the average, dex less metal-rich than the bulge stars in our Galaxy (however we caution that the globular cluster samples are small).
Possible explanations for this difference between globular clusters and stars are related to projection effects and/or intrinsic properties. Some interloping halo clusters are expected in the observed lines of sight of M 31 and Galactic central clusters, which might be contaminating the samples. Alternatively, these differences might reflect different chemical enrichment histories. However, samples of bulge clusters are still small and this domain of investigation is still at its early stages.

Super metal-rich globular clusters are apparently not a very common phenomenon, since the only examples in our sample are G 174 and G 177. For more definite results, it would be important to increase the spatial coverage of the observations to the other quadrants (Fig. 1).
6.2 Spatial dependence of velocity, reddening and metallicity
We present in Figure 7 the spatial dependence of metallicity, reddening and radial velocity for the star cluster sample, respectively from columns 7 and 5 of Table 4, and an average of columns 4 and 5 of Table 1. The sample is small and spatially restricted to one side of the nucleus (Figure 1), but conclusions can still be drawn.
Clusters of different metallicities are well-mixed. The most reddened clusters appear superimposed on the galaxy major axis, since there the disk absorption would be more important. Finally, the velocity distribution suggests a spatial mixing of clusters which would be in agreement with the velocity dispersion of a bulge. The velocity dispersion of our 16 confirmed clusters is 255 km/sec (unweighted). To be able to say anything about possible rotation, it would be necessary to observe the clusters in the other quadrants.

6.3 Comparison with the most metal-rich galaxy spectra

It is important to compare single stellar population (star cluster) spectral properties with those of composite stellar populations (galaxies), in view of stellar population synthesis. Bica & Alloin (1986a,b and 1987) and Bica (1988) called attention to the fact that the spectral properties of the nearly-solar metallicity globular clusters like NGC 6528, NGC 6553 and NGC 6440, were almost comparable to those of giant elliptical galaxies. More recently, Jablonka et al. (1992) pointed out that the M 31 bulge globular cluster G 177 (also in the present sample) was as strong-lined as the giant ellipticals. In the present sample, there is a cluster which is even more strong-lined, G 174, whose spectrum is compared in Figure 8 to that of the M 31 semi-stellar nucleus (Bica, Alloin & Schmidt 1990), that of the most metal-rich giant elliptical nuclei (the E 1 template in Bica 1988), and finally, a less metal-rich one, of galaxy nuclei of somewhat less luminous ellipticals (the E 3 template in Bica 1988).
The globular cluster G 174 is clearly more strong-lined than E 3, and is similar to those of the most metal-rich known stellar populations, i.e. E 1 and the semi-stellar nucleus of M 31. Notice in particular the comparable strengths of the blue CN band ( 4150Å) which are among the most sensitive metallicity indicators, remaining unsaturated in the high metallicity range. As a consequence, G 174 appears to have been formed from the same parent gas as the semi-stellar nucleus, and so it possibly represents the highest chemical enrichment that galaxies can attain.
7 Concluding remarks
We have carried out spectroscopy of a sample of 19 objects projected on the bulge of M 31: 16 were confirmed as star clusters, 2 are Galactic dwarf stars, and 1 is a high redshift background galaxy. The objects confirmed as star clusters had been classified as Bologna classes A and B, whereas the 3 non-clusters were of the low probability class C.
We derived radial velocities, metallicities, ages and reddenings for our sample clusters. In some cases, especially G 175, there remains an ambiguity between intermediate and old cluster ages, due to the limited wavelength range observed. Two clusters are found to be super metal-rich, G 174 and G 177. Their features are comparable to those in the most metal-rich stellar populations, i.e., nuclei of giant ellipticals and the semi-stellar nucleus of M 31 itself. The metallicity distribution of the sample is compatible with the distribution of globulars in the bulge of our Galaxy. Although small, both the M 31 and the Galaxy globular cluster samples seem to have an excess of metal-poor objects with respect to the stars in the Galactic bulge. Some interloping halo globular clusters might be present in both cluster samples. Alternatively, this might be due to different formation histories.
In the future, it will be important to observe clusters surrounding the nucleus in the other quadrants, in order to increase the statistical significance of the properties analyzed. In particular this would make it possible to check for the existence of rotation in the cluster system, as well as to identify new super metal-rich clusters, imposing constraints on chemical evolution models, especially at the high metallicity end.
Acknowledgements.
T.B. thanks the staff at the La Palma Observatory for hospitality and observational support; E.B. and C.B. acknowledge financial support from the Brazilian institutions CNPq and FINEP.References
- (1) Alloin D., Pelat D. & Bijaoui A., 1976, A&A, 50, 127
- (2) Aurière M., Coupinot G. & Hecquet J., 1992, A&A, 256, 95
- (3) Baldwin J.A., Phillips M.M. & Terlevich R., 1981, PASP, 93, 5
- (4) Barbuy B., Castro S., Ortolani S. & Bica E., 1992, A&A, 259, 607
- (5) Barbuy B., Bica E. & Ortolani S., 1997, A&A, in press
- (6) Barbuy B., Ortolani S., Bica E., Renzini A. & Guarnieri M.D., 1997, Fundamental Stellar Parameters: Confrontation Between Observation and Theory, eds. J. Davis, A. Booth & T. Bedding, Kluwer Acad. Publ., in press
- (7) Battistini P., Bònoli F., Braccesi A., Federici L., Fusi Pecci F., Marano B. & Borngen F. 1987, A&AS, 67, 447
- (8) Battistini P., Bònoli F., Casavecchia M., Ciotti L., Federici L. & Fusi Pecci F., 1993, A&A, 272, 77
- (9) Bica E. & Alloin D., 1986a, A&A, 162, 21
- (10) Bica E. & Alloin D., 1986b, A&AS, 66, 171
- (11) Bica E. & Alloin D., 1988, Towards understanding galaxies at large redshifts, Eds. R. G. Kron & A. Renzini, Kluwer Academic Publ., 77
- (12) Bica E., 1988, A&A, 195, 76
- (13) Bica E. & Alloin D., 1987, A&A, 186, 49
- (14) Bica E., Alloin D. & Schmidt A.A., 1990, A&A, 228, 23
- (15) Bica E., Jablonka P., Santos J.F.C., Jr, Alloin D. & Dottori H., 1992, A&A, 260, 109
- (16) Bica E., Alloin D. & Schmitt H., 1994, A&A, 283, 805
- (17) Binette L., Magris C., Stasiǹska G. & Bruzual G., 1994, A&A, 292, 13
- (18) Bonatto C., Bica E. & Alloin D., 1995, A&AS, 112, 71
- (19) Burstein D., Faber S., Gaskell C. & Krumm N., 1984, ApJ, 287, 586
- (20) Cohen J.G. & Matthews K., 1994, AJ, 108, 128
- (21) Couture J., Racine R., Harris W.E. & Holland S., 1995, AJ, 109, 2050
- (22) Freedman W.F. & Madore B.F., 1990, ApJ, 365, 186
- (23) Hodge P.W., 1981, Atlas of the Andromeda Galaxy, Univ. of Washington Press, Seattle
- (24) Huchra J.P., Brodie J.P. & Kent S. 1991, ApJ, 370, 495
- (25) Huchra J.P., Brodie J.P., Caldwell N., Christians C. & Schommer R., 1996, ApJS, 102, 29 1997, AJ, 113, 634
- (26) Jablonka P., Alloin D. & Bica E., 1992, A&A, 260, 97
- (27) Jablonka P., Bica E., Pelat D. & Alloin D. 1996, A&A, 307, 385
- (28) Le Fèvre O., Crampton D., Lilly S.J., Hammer F., Tresse L., 1995, ApJ, 455, 60
- (29) McWilliam A. & Rich R.M., 1994, ApJS, 91, 749
- (30) Oke J.B., 1974, ApJS, 27, 21
- (31) Ortolani S., Renzini A., Gilmozzi R., Marconi G., Barbuy B., Bica E. & Rich R.M., 1995, Nature, 377, 701
- (32) Santos J.F.C. Jr, Bica E., Clariá J.J., Piatti A.E., Girardi L.A. & Dottori H. 1995a, MNRAS, 276, 1155
- (33) Santos J.F.C. Jr, Bica E., Dottori H., Ortolani S. & Barbuy B., 1995b, A&A, 303, 753
- (34) Sargent W.L.W., Kowal C.T., Hartwick F.D.A. & van den Bergh S., 1977, AJ, 82, 947
- (35) Stone R.P.S., 1977, ApJ, 218, 767
- (36) Tonry J. & Davis M., 1979, AJ, 84, 1511
- (37) Tripicco M.J., 1989, AJ, 97, 735
- (38) Vetesnik M., 1962, Bull. Astr. Inst. Czech, 13, 180