The rich cluster of galaxies ABCG 85. III. Analyzing the ABCG 85/87/89 complex. ††thanks: Based on ROSAT Archive data and on observations collected at the European Southern Observatory, La Silla, Chile
Abstract
We present a combined X-ray and optical analysis of the ABCG 85/87/89 complex of clusters of galaxies, based on the ROSAT PSPC image, optical photometric catalogues (Slezak et al. 1998), and an optical redshift catalogue (Durret et al. 1998). From this combined data set, we find striking alignments at all scales at PA160∘. At small scales, the cD galaxy in ABCG 85 and the brightest galaxies in the cluster are aligned along this PA. At a larger scale, X-ray emission defines a comparable PA south-southeast of ABCG 85 towards ABCG 87, with a patchy X-ray structure very different from the regular shape of the optical galaxy distribution in ABCG 87. The galaxy velocities in the ABCG 87 region show the existence of subgroups, which all have an X-ray counterpart, and seem to be falling onto ABCG 85 along a filament almost perpendicular to the plane of the sky.
To the west of ABCG 85, ABCG 89 appears as a significant galaxy density enhancement, but is barely detected at X-ray wavelengths. The galaxy velocities reveal that in fact this is not a cluster but two groups with very different velocities superimposed along the line of sight. These two groups appear to be located in intersecting sheets on opposite sides of a large bubble.
These data and their interpretation reinforce the cosmological scenario in which matter, including galaxies, groups and gas, falls onto the cluster along a filament.
Key Words.:
Galaxies: clusters: general; Clusters: individual: ABCG 85; X-rays: galaxies1 Introduction
One of the major changes in our understanding of our universe has been the realization of the rich and complex structures which are apparent in the large scale distribution of galaxies. From both redshift surveys and projected galaxy distributions, the appearance of galaxy voids and supercluster filaments has become clear. The large scale structure also is an important constraint for different cosmological scenarios. On smaller scales, investigations of the relationships between nearby galaxy clusters suggest that clusters retain information about the large scale structures from which they form (e.g., van Haarlem & van de Weygaert 1993; West et al. 1995, West 1997; Colberg et al. 1997). The frequency of substructure may also provide constraints on (Richstone et al. 1992, Mohr et al. 1995, Buote & Xu 1997; see also Kauffmann & White 1993).
As part of a survey for substructure, we have studied the large scale mass distribution around the richness class 1 cluster ABCG 85 (Abell et al. 1989), using X-ray and optical observations. As a bright, luminous, relatively nearby cluster, ABCG 85 has been studied extensively. At a redshift of , the angular scale for ABCG 85 corresponds to kpc arcmin-1 (we assume H0= 50 km sec-1 Mpc-1 throughout). ABCG 85 contains a cD galaxy close to its center. The cluster X-ray characteristics include a peaked emission profile, harboring a cooling flow, emission from individual cluster member galaxies, an X-ray emitting subcluster south of the cluster center (hereafter the south blob), a superposed foreground group of galaxies (to the west-northwest), as well as additional foreground and background structures detected from the optical spectroscopic observations (see Jones et al. 1979, Pislar et al. 1997, Lima-Neto et al. 1997, Slezak et al. 1998, Durret et al. 1998, and in preparation for detailed discussions of the X-ray and optical observations).
In this contribution, we report on the X-ray and optical properties of a larger region around ABCG 85 than has been considered in previous studies, and in particular include the nearby clusters ABCG 87 and ABCG 89. We find that ABCG 85 itself exhibits preferential alignments on scales from 100 kpc to Mpc (in projection on the sky). In particular, the cluster cD galaxy is elongated along the same position angle as a large filamentary structure in X-rays roughly coinciding with the optical position of ABCG 87. Located to the east of ABCG 85 is ABCG 89, not detected as an extended X-ray source. We also address why ABCG 87 appears different in the optical and X-ray and why ABCG 89 appears as a cluster in the optical observations and not in X-rays.
Based on these results, we discuss the ABCG 85/87/89 complex and describe the alignments and/or structures in the context of a large scale structure formation scenario such as that proposed by West et al. (1995; see also van Haarlem & van de Weygaert 1993 and Colberg et al. 1997). In Sect. 2 we present the X-ray imaging analysis and galaxy distributions. Sect. 3 discusses in detail the galaxy velocity distribution. A model is proposed in Sect. 4 and discussed in Sect. 5.
2 X-ray Imaging Analysis and Galaxy Distribution
2.1 ROSAT PSPC X-ray Observations of ABCG 85
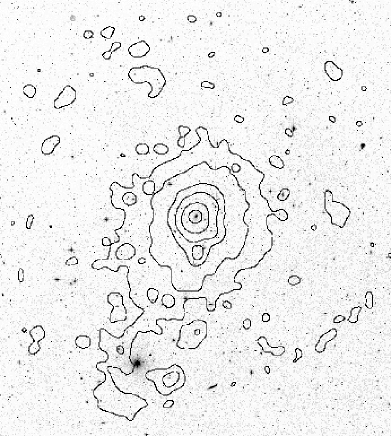
We have analyzed the ROSAT PSPC observations of ABCG 85 using an image in the energy band 0.5-2.0 keV binned into 15 arcsecond pixels and flat fielded. Figure 1 shows the resulting ROSAT PSPC image of the radius field centered on ABCG 85, smoothed with a Gaussian to enhance the signal to noise ratio at large off-angle distances. The image clearly shows emission peaked on the cD at the cluster center, a second region of extended emission (the south blob) approximately south of ABCG 85 (720 kpc, projected on the sky), as well as point sources scattered over the PSPC field of view (FOV). In addition to these features, there is an excess of emission towards the south south-east, extending almost to the edge of the FOV. The emission to the southeast is concentrated in a narrow range of position angles, approximately between 135∘ and 180∘ (counter clockwise from north); the positions and net counts of individual sources from this region are listed in Table 1. We also generated an image following the Snowden et al. (1994; see also Snowden 1995) prescription which slightly reduces the field of view but shows the same features in the overlapping regions.
| ID | Net | ||
|---|---|---|---|
| (J2000.0) | counts | ||
| 1 | 0h 42mn 25s | -9∘48’ | 47.7 |
| 2 | 0h 42mn 56s | -10∘00’ | 48.1 |
| 3 | 0h 43mn 51s | -9∘51’ | 46.0 |
| 4 | 0h 43mn 51s | -10∘06’ | 47.4 |
As shown in Table 1, the sources are all of comparable intensity. If we assume a typical source contains 45 net counts, we find a flux of ergs cm-2 s-1 (using a Galactic column density of cm-2 and a spectrum characterized by a temperature of 1.4 keV) for an exposure time of 9.8 ksec. At the distance of ABCG 85, this corresponds to a luminosity of ergs s-1. These luminosities are typical of those of small groups of galaxies (e.g., Henry et al. 1995, Pildis et al. 1995, Ponman et al. 1996).
The azimuthal distribution computed by binning the counts in the PSPC image in 45∘ sectors over the radial range from 27.5 to 55.0 arcminutes (110-220 pixels) centered on the peak of the surface brightness distribution, shows a clear excess of approximately 500 cts (2750 compared to 2250 cts) compared to the mean at other azimuths. The smaller scale sources contain only approximately 50% of this total excess, indicating additional flux on larger scales (clearly seen in Figs. 2 and 3, see below). This excess emission (excluding the four concentrations in Table 1) has a flux corresponding to ergs cm-2 s-1, assuming it has the same spectral properties as we assumed for the individual sources above. While our assumption for the sources may be reasonable, since their luminosities are equivalent to those of groups, the excess flux could be characterized by a significantly cooler temperature if it lies in still weaker potentials than typical of small groups.


We generated an image of the excess X-ray emission to the south-east of ABCG 85. We built a synthetic image for the whole cluster, using the azimuthal profile of the northern half of ABCG 85, which was then subtracted from the original data (and normalized by dividing by the symmetric model). The result is displayed as a contour map in Fig. 2. The surface brightness enhancement which initially extends to the south from the center of A85, shifts in angle towards the southeast.
A wavelet transform analysis, which allows extraction of emission at different spatial scales, gives comparable results (Fig. 3).
2.2 The distribution of galaxies in the ABCG 85 Region
Slezak et al. (1998) compiled two photometric catalogues, one of 11862 galaxies in a field, and one of 4232 galaxies in a 1 degree radius region centered on the cluster to a limiting magnitude of b; the latter is 95% complete to b.
By using the first and second moments of the distribution of galaxy positions, we calculated the ellipticity and the major axis position angle of the galaxy distribution; the ellipticity is e=0.82 and the major axis is along PA160∘. This alignment is also illustrated by the brightest cluster galaxies (11 galaxies brighter than R=15 and having redshifts belonging to the cluster) which are distributed in a narrow band with PA135∘. We also note that the cD galaxy itself is elongated with PA152∘.

We used the optical photometric catalogues of Slezak et al. to investigate the structure corresponding to the X-ray emission. A kernel map (Silverman 1986) showing the smoothed galaxy number density is displayed in Fig. 4. This figure shows the alignment at PA160∘ of the contours extending to the south east from the center of ABCG 85. The prominent azimuthally symmetric peak located southeast of the cD galaxy at the position of ABCG 87 also defines the same 160∘ PA. Another structure is seen at the optical position of ABCG 89. A comparison of the X-ray and optical images (Figs. 2, 3 and 4) is instructive. All the features found in the optical at PA160∘ are seen in X-rays, with emission extending from ABCG 85 southeast toward ABCG 87.
Thus both the X-ray emission and the optical galaxies show an excess of matter in a large region southeast of ABCG 85. Nearly half of the X-ray emission arises from a few sources, reminiscent of groups of galaxies.
We find that galaxies with velocities smaller than the cluster bi-weight (BWT; Beers et al. 1990) mean ( km s-1) and smaller than the velocity of the central cD ( km s-1) are concentrated in two regions along the southern filamentary extension (see Fig. 3). These galaxies have velocities in the 14500-16100 km s-1 range and also lie at the same position angle as the previously mentioned structures.
A major difference in the X-ray and optical maps is in the appearance of the region directly to the east of ABCG 85. No extended X-ray emission is found corresponding to the prominent galaxy concentration at the location of ABCG 89. Also, the X-ray appearance at the position of ABCG 87 is not consistent with the presence of a regular, relaxed system, as is suggested by the optical. The X-ray structure is elongated and shows more substructure/clumpiness. On the contrary, a relaxed system would show X-ray emission having less ellipticity than found in the optical (see e.g. Fabricant et al. 1984).
We now investigate the three dimensional galaxy distribution (space and velocity) to clarify the differences and similarities seen in the X-ray and optical.
3 Galaxy velocity distribution
We use the extensive spectroscopic catalogues of galaxies in this region to analyse several fields around each cluster with the goal of determining the three dimensional structure of the ABCG 85/87/89 complex. The catalogue by Durret et al. (1998) includes 551 galaxy velocities in the direction of ABCG 85; among these, 305 galaxies lie in the velocity range 13000–20000 km s-1, which are assumed to belong to ABCG 85. We also used five galaxy velocities for ABCG 87 from the ENACS catalogue (Katgert et al. 1997).
To analyse the distribution of velocities, we use a wavelet reconstruction as described in Fadda et al. (1997). This method provides velocity density profiles. The calculation of significance for features derived in the wavelet reconstruction is described in their paper. Mathematically, it is possible to perform analyses to very small velocity scales; however, the features found may not be significant. We will therefore use only the largest scales. Notice that even if we are not able to be very confident in each peak for each sample, the fact that the same velocity feature is observed in adjacent zones, using independent velocity samples, argues in favour of its true existence.
| Name | Radius | Number | ||
| (J2000.0) | (”) | of | ||
| galaxies | ||||
| A85 (Sc) | 0h 41mn 51.9s | -9∘18’ 17” | 850 | 123 |
| A89 | 0h 43mn 08.0s | -9∘26’ 35” | 550 | 43 |
| A87 | 0h 43mn 00.0s | -9∘49’ 00” | 850 | 60 |
| C89 | 0h 40mn 38.0s | -9∘09’ 59” | 850 | 43 |
| C87 | 0h 40mn 40.0s | -8∘47’ 34” | 850 | 40 |
| C1 | 0h 40mn 44.3s | -9∘41’ 37” | 1000 | 40 |
| C2 | 0h 42mn 59.5s | -8∘54’ 47” | 900 | 44 |
3.1 Velocity subsamples
We defined seven subsamples of galaxies chosen in circular regions on the sky (see Table 2 and Fig. 5). One is located at the center of the cluster ABCG 85 (named Sc) and two (named A89 and A87) are located at the positions of ABCG 89 and ABCG 87 as indicated by the NED database. Two control subsamples are chosen at the symmetrical positions of A 87 and A 89 relative to the ABCG 85 center: C87 is symmetric to A87, and C89 to A89. To these five samples, we add two comparison samples: C1 between A87 and C89 and C2 symmetric to C1 relative to the ABCG 85 center (see Fig. 5). The radii of all these circles have been chosen in each case to avoid superposition of possible structures, while obtaining a significant number of velocities in each sample.

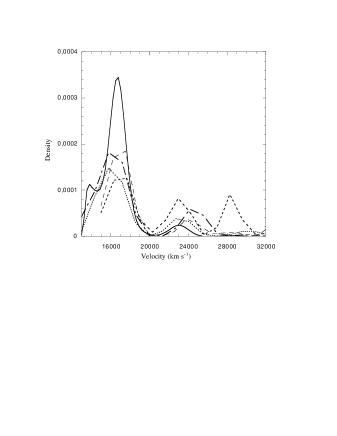
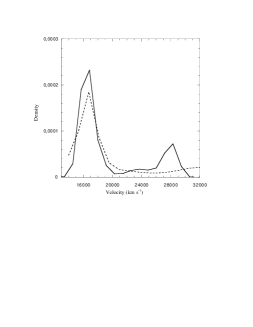
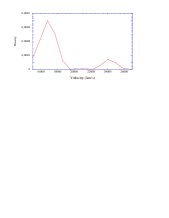
Velocity clustering is observed between 13000 km s-1 and 32000 km s-1, as illustrated in Fig. 6. The velocity distributions for the control samples C1 and C2 are displayed in Fig. 7. The most prominent feature centered at about 17000 km s-1 corresponds to the ABCG 85 cluster. In Fig. 6, a second feature is seen at about 23000 km s-1.
3.2 The 20000 - 32000 km s-1 velocity range
3.2.1 A galaxy sheet between 20000 km s-1 and 26000 km s-1
The peak observed between 20000 km s-1 and 26000 km s-1 (Fig. 6) is particularly strong in the region of A89 (Figs. 6 and 8); this peak (hereafter ABCG 89b) has a velocity dispersion km s-1. Such a value is too large for a single relaxed group, thus suggesting either substructure or contamination by other structures. As Fig. 6 shows, the maximum between 20000 and 26000 km s-1 is not at the same velocity for all the samples. In particular, the peaks for the control samples C87 and C89 are higher: 24000 km s-1 for C87 and 25000 km s-1 for C89.
The clustering of velocities, together with the variation of the peak velocity, suggest the presence of a sheet of galaxies inclined with respect to the plane of sky. This sheet is not visible in the two control samples C1 and C2.
3.2.2 A structure at km s-1: ABCG 89c
A second peak is observed in the A89 velocity distribution at about 28500 km s-1 (see Figs. 6 and 8). An enhancement is also found at this velocity in the C1 control sample (Fig. 7), but no peak is present in the five other velocity samples in Fig. 6. This high redshift component of A89 has a velocity dispersion of = km s-1, typical of a galaxy group or small cluster. Obviously ABCG 89 is not a simple cluster, but rather a complicated superposition of structures.
3.3 The 13000 - 20000 km s-1 velocity range
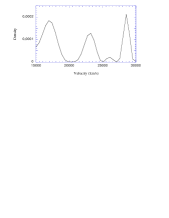
The velocity distributions in this range are displayed in Figs. 8, 9, 10, 11 and 12 for the A89, Sc, A87, C87 and C89 samples respectively.
We have analysed the distribution at various scales. However, due to the inhomogeneous number of galaxy velocities in the various samples distributed in various velocity intervals, the scales differ, depending on the number of galaxies in each sample.

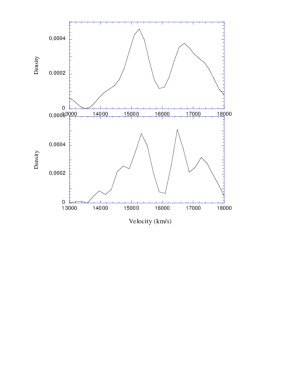
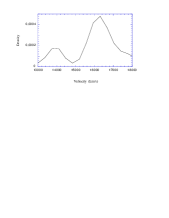
3.3.1 A structure at km s-1: the “Foreground Group”
A peak in the velocity distribution at 14000 km s-1 is observed for Sc (Fig. 9, top and bottom panels), A87 (Fig. 10, bottom panel) and the comparison sample C89 (Fig.12). This peak corresponds to the “Foreground Group” detected by using the Serna & Gerbal (1996) hierarchical method and identified on the X-ray image with the excess to the west of ABCG 85 (Durret et al. 1996).
3.3.2 Structures in the [15000-19000 km s-1] range
In velocity space for the Sc and C89 samples, a dip at km s-1 follows the “Foreground Group” (see Figs. 9 and 12). Notice that the galaxy samples A89, C87 and C1 contain no galaxy velocities smaller than km s-1, while this is not the case for the A87 sample (Fig. 10); in all these samples, most of the galaxy velocities lie between 15000 and 19000 km s-1.
In the case of Sc (top panel in Fig. 9), A89, C89, C87 and for the two control samples C1 and C2, a maximum is observed at km s-1. These velocity distributions are clearly not Gaussian for any of the samples.
At a smaller scale, in the case of Sc, the velocity density breaks into a two-maxima density distribution (Fig. 9, bottom panel) with a first maximum at km s-1 followed by a dip (the “Dip” in the following) at km s-1, then a second maximum at km s-1 followed by a shoulder at km s-1. It is interesting to notice that the velocity of this second maximum is very close to that of the cD galaxy.
Even if the relative levels of peaks and dips are not the same for both samples, the succession of features in the Sc velocity density distribution is very similar to that in the density profile of A87 (Fig. 10, top panel): a first maximum followed by the “Dip” then a second maximum.
In several samples we observe a similar succession of maxima and minima, such as the 14000 km s-1 maximum, a small dip at 15000 km s-1, the “Dip” at 16100 km s-1, and a maximum at km s-1 (Figs. 9, 10 and 12). A peak (at km s-1) corresponds in Fig. 10 (bottom panel) to the shoulder noted in the Sc sample (Fig. 9, bottom panel).
4 Three Dimensional Structure of the ABCG 85 Complex
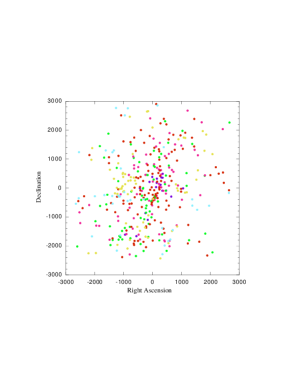
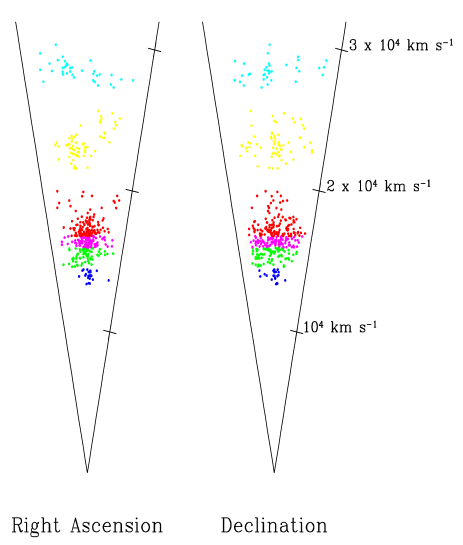
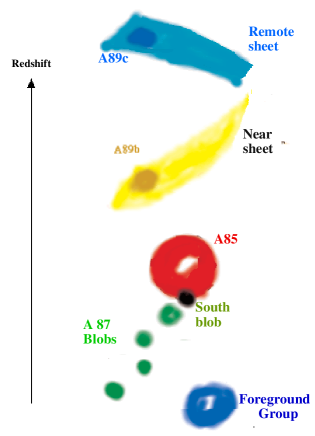
Figure 13 shows the distribution in the plane of the sky of galaxies with measured velocities, colour coded for various velocity ranges. This figure illustrates the difficulty in untangling structures projected on the plane of the sky, even if they have very different velocities. We can note however that two structures are visible: a condensation of “yellow galaxies” in the region of ABCG 89 (but galaxies in this velocity range also can be found elsewhere), and “dark blue galaxies” corresponding to the “Foreground Group”. Besides, there seems to be an enhancement of galaxies aligned along PA160∘.
We show two cone diagrams for the velocity distribution, which are displayed in Fig. 14. Both panels show evidence for various substructures along the line of sight. The bulk of the galaxies (the purple and red points in the figures) correspond to ABCG 85.
In the left panel of Fig. 14, the “Foreground Group” is clearly visible (dark blue points), and it is apparent from Fig. 13 that this group is quite compact and concentrated (in projection) towards the center-west of the cluster.
The ABCG 87 cluster itself, or rather the region south-east of ABCG 85, appears to be composed of several subgroups with velocities somewhat lower than the median cluster velocity (green points). These subgroups, defined in velocity space, have X-ray counterparts (Fig. 2). In Fig. 15 we place each subgroup at its X-ray position and represent it in the right ascension-velocity plane (the velocities are in fact the various peaks observed in Fig. 10), we observe a filament pointing towards ABCG 85. This suggests that a stream of material is falling onto the main core of ABCG 85. The south blob (the extended X-ray feature south of the cD) would then be the meeting point (see Fig. 2) and corresponds to a hot region in the ASCA temperature map (Markevitch et al. 1998).
The two structures with the largest velocities (yellow and cyan points) seem to trace two sheets of galaxies (referred to as the near and remote sheets in Fig. 15). Both structures are inclined along the line of sight, and appear to intersect. These two sheets may lie on the surface of a large bubble which intersects our field of view.
Note also the coalignment, along the line of sight, of the Foreground Group, ABCG 85, A89b, and A89c. This could indicate the presence of a second filament directly along the line of sight. Furthermore, the two filaments could be concentrations in a sheet. Notice the existence of a dozen galaxies with velocities slightly higher than that for most of the ABCG 85 galaxies which indicate a lower density region of the line of sight filament.
5 Discussion
We presented a three dimensional model of the complex ABCG 85/87/89 region. We find a general extension observed toward the south-east along PA∘ both in X-rays and in optical photometric observations:
- In X-rays, the elongated structure extends to the edge of the ROSAT PSPC field of view; the X-ray appearance includes several individual group-like systems lying up to about 4 Mpc (in projection) from the center of the cluster (see Fig. 1) as well as very elongated diffuse emission;
- from the optical photometric catalogue, ABCG 85 is elongated towards the ABCG 87 cluster (see Fig. 4). The PA∘ is characteristic for ABCG 85: the direction of the major axis, the brightest galaxies in ABCG 85, and even the major axis of the central cD galaxy itself are elongated along the same direction.
East of ABCG 85 lies ABCG 89 which is not bright in X-rays. Our velocity data reveal that ABCG 89 is not a cluster, but the superposition on the sky of two groups well separated in velocity space. These two groups (to which we refer as A89b & A89c in Fig. 15) are located in intersecting sheets on opposite sides of a large bubble.
We have shown that ABCG 87 is not a rich cluster, but is resolved into individual groups possibly falling onto ABCG 85. These groups are organized as a filament almost perpendicular to the plane of the sky. The superposition of these groups gives the appearance of a single optical cluster, while in X-rays, several groups are still visible: This is probably due to the fact that the emissivity in X-rays is proportional to the density squared, therefore enhancing the contrast, compared to optical imaging.
ABCG 85 itself is probably not fully relaxed, even if it appears smooth and symmetric; the distribution of velocities is obviously not gaussian and probably multi-modal.
In his scenario for the Coma cluster, West (1997) links the orientations of Coma to the filament in which Coma is embedded. He suggests that matter, including galaxies, groups and gas, falls onto the cluster along this filament. The case of ABCG 85 reinforces this cosmological scenario because we actually observe the infall of material (a filament of groups of galaxies and gas) onto ABCG 85. This result is consistent with the X-ray temperature map derived from ASCA data by Markevitch et al. (1998), which shows a temperature enhancement in a region south of ABCG 85 and roughly perpendicular to the general direction of 160∘ along which the various structures are aligned. Such a temperature increase could be interpreted as shock heating due to the compression of the X-ray gas by infalling matter. The fact that there also appears to be a radio relic, also roughly perpendicular to the 160∘ direction, in this zone (Bagchi et al. 1998) also supports recent merger activity, since relativisitic electrons can be produced during a merger.
Remarkably, the ABCG 85/87 filament is coaligned with a much larger structure including from northwest to southeast: ABCG 70, ABCG 85 and 89, ABCG 87, ABCG 91, the NGC 255 group and ABCG 106 (Fig. 1 in Slezak et al. 1998). Such a structure extends over more than 5∘ on the sky, corresponding to a linear distance of 28 Mpc at the redshift of ABCG 85 (z=0.0555). This is obviously a lower limit, since the filament may be inclined to the line of sight. Although this projected value is smaller than that found for example for the Perseus Pisces structure (50 Mpc, Haynes & Giovanelli 1986), it is nevertheless much larger than typical cluster sizes. Unfortunately, there are only very few redshifts available for this large structure outside the ABCG 85/87/89 complex. Further optical observations are required to confirm the cohesiveness of this remarkable filamentary structure.
Acknowledgements.
We are very grateful to A. Biviano, D. Fadda and E. Slezak for making their software available to us. W. Forman and C. Jones thank the IAP for its hospitality and acknowledge support from the Smithsonian Institution and NASA contract NAS8-39073.References
- (1) Abell G.O., Corwin Jr H.G., Olowin R.P. 1989, ApJS 70, 1
- (2) Bagchi J., Pislar V., Lima-Neto G.B. 1998, MNRAS in press
- (3) Beers T.C., Flynn K., Gebhardt K. 1990, AJ 100, 32
- (4) Buote D.A., Xu G. 1997, MNRAS 284, 439
- (5) Colberg J.M., White S.D.M., Jenkins A., Pearce F.R. 1997, submitted to MNRAS, astro-ph/9711040
- (6) Durret F., Felenbok P., Gerbal D. et al. 1996, Proc. Conf. “The early Universe with the VLT”, April 1-4 1996, Garching, Ed. J. Bergeron, Springer, p.386
- (7) Durret F., Felenbok P., Lobo C., Slezak E. 1998, A&AS in press, astro-ph/9709298
- (8) Fabricant D., Rybicki G., Gorenstein P. 1984, ApJ 286, 186
- (9) Fadda D., Slezak E., Bijaoui A. 1997, A&A in press, astro-ph/9704096
- (10) Haynes M.P., Giovanelli R. 1986, ApJ 306, L55
- (11) Henry J.P., Gioia I.M., Huchra J.P. et al. 1995, ApJ 449, 422
- (12) Jones C., Mandel E., Schwarz J. et al. 1979, ApJ 234, L21
- (13) Katgert P., Mazure A., den Hartog R. et al. 1997, A&A in press
- (14) Kauffmann G., White S.D.M. 1993, MNRAS 261, 921
- (15) Lima Neto G.B., Pislar V., Durret F., Gerbal D., Slezak E. 1997, A&A 327, 81
- (16) Markevitch M., Forman W., Sarazin C., Vikhlinin A. 1998, submitted to ApJ, astro-ph/9711289
- (17) Mohr J.J., Evrard A.E., Fabricant D.G., Geller M.J. 1995, ApJ 447, 8
- (18) Pildis R.A., Bregman J.N., Evrard A.E. 1995, ApJ 443, 514
- (19) Pislar V., Durret F., Gerbal D., Lima Neto G.B., Slezak E. 1997, A&A 322, 53
- (20) Ponman T.J., Bourner P.D.J., Ebeling H., Böhringer H. 1996, MNRAS 283, 690
- (21) Richstone D., Loeb A., Turner E.L. 1992, ApJ 393, 477
- (22) Serna A., Gerbal D. 1996, A&A 309, 65
- (23) Silverman B.W. 1986, Density Estimation for Statistics and Data Analysis, Chapman & Hall, London
- (24) Slezak E., Durret F., Guibert J., Lobo C. 1998, A&AS in press, astro-ph/9710103
- (25) Snowden S.L. 1995, Cookbook for analysis procedures for Rosat XRT/PSPC observations of extended objects and diffuse background (Greenbelt: NASA USRSDC)
- (26) Snowden S.L., McMammon D., Burrows D.N., Mendenhall J.A. 1994, ApJ 424, 714
- (27) van Haarlem M., van de Weygaert R., 1993, ApJ 418, 544
- (28) West M.J. 1997, Proc. Workshop “A new vision of an old cluster: untangling Coma Berenices”, Marseille June 17-20 1997, Eds. Mazure et al.
- (29) West M.J., Jones C., Forman W. 1995, ApJL, 451, L5.