Dynamics of the radio galaxy 3C 449
Abstract
We present ROSAT PSPC observations of the twin-jet radio galaxy 3C 449. The soft X-ray emission from this object is dominated by an extended halo with a scale comparable to that of the radio source. The asymmetry of the X-ray emission is reflected in that of the radio lobes, providing evidence that the behaviour of the jets is strongly influenced by the external medium. A region of reduced X-ray surface brightness coincident with the southern radio lobe of 3C 449 suggests that the radio source has displaced thermal plasma from the X-ray-emitting halo. However, the minimum pressure in the radio lobe is considerably lower than our estimates of the pressure in the external medium. We discuss the implications for the dynamics of the radio source.
keywords:
galaxies: individual: 3C 449 – galaxies: jets – galaxies: active – X-rays: galaxies1 Introduction
3C 449 (B2 2229+39) is a well-known FRI radio galaxy (Fanaroff & Riley 1974) at a redshift of 0.0171. Its symmetrical inner jets have been well studied in the radio (Perley, Willis & Scott 1979; Cornwell & Perley 1984). On larger scales, the southern jet flares into a lobe, while the northern jet continues to be collimated until it fades into the noise (Birkinshaw, Laing & Peacock 1981; Jägers 1987; Andernach et al. 1992; Leahy, Bridle & Strom 1997). 3C 449’s host galaxy, UGC 12064, has a close bright companion (e.g. Balcells et al. 1992) and models have been proposed in which the orbital motion of the host is responsible for the symmetrical oscillations in the jets (e.g. Lupton & Gott 1982; Hardee, Cooper & Clarke 1994).
UGC 12064 appears in the optical to lie in a poor cluster (Zw 2231.2+3732), and the extended optical halo surrounding it and its companion allows it to be classed as a cD galaxy (Wyndham 1966). Miley et al. (1983) used the Einstein IPC to show that it is a weak, extended X-ray source, and the rotation measure gradients in the jet are thought to be produced by the hot gas responsible for the X-ray emission (Cornwell & Perley 1984). In this paper we present new, sensitive observations of 3C 449 with the ROSAT PSPC, which allow us to map in detail the hot gas halo surrounding the source.
Throughout we use a cosmology in which km s-1 Mpc-1, . At the distance of 3C 449, 1 arcsec corresponds to 0.485 kpc.
2 Observations and data analysis
3C 449 was observed for 10 ks with the ROSAT PSPC between 1993 Jan 04 and 1993 Jan 10 as part of a programme to study the X-ray emission from a sample of radio galaxies drawn from the B2 radio survey as likely candidates for the parent population of BL Lac objects (Worrall & Birkinshaw 1994). We analysed the data with the Post-Reduction Off-line Software (PROS). After filtering to remove time intervals with abnormally high particle background, we were left with 9.15 ks of good data.
An extended source was detected with net counts in a 10-arcmin-radius circle about the pointing centre, corresponding to a count rate of s-1 over the PSPC energy range (0.1–2.5 keV). The background count rate was estimated from an annulus between 10.8 and 16.7 arcmin from the pointing centre; source and background regions were corrected for the effects of vignetting using the 1-keV parametrisation of the vignetting function. A number of point X-ray sources, and one extended source, believed to be background sources, were excluded from the source and background regions. The closest of these, 8.6 arcmin W of the source, is coincident with a foreground star; there is no bright optical object coincident with the others, though a source 15 arcmin to the SE is coincident with a weak radio source.
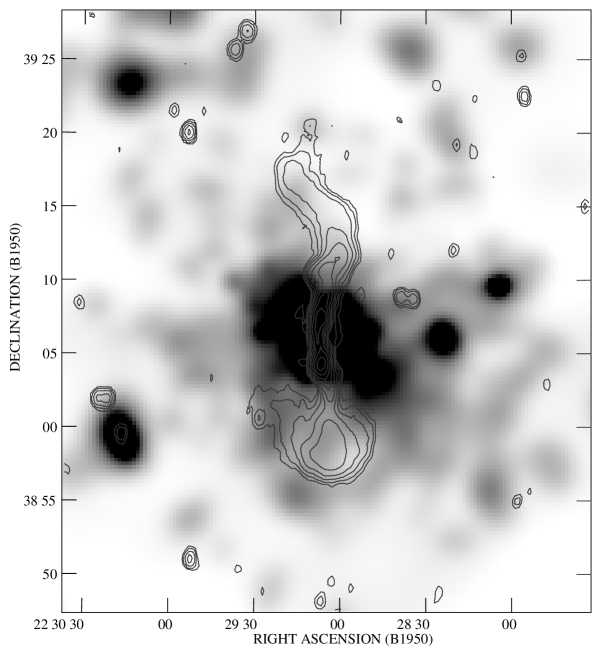
Fig. 1 shows the extended X-ray structure of the source. Extended object and X-ray background analysis software due to S. Snowden (Snowden 1997) was used to model and subtract non-cosmic background components and correct for exposure and vignetting. The resulting 0.4-2 keV image was then adaptively smoothed as described elsewhere (Worrall, Birkinshaw & Cameron 1995; Worrall et al. in prep.). The central peak in X-ray brightness corresponds to the position of the radio core of 3C 449 to within 9 arcsec, consistent within the absolute position errors of ROSAT. The central regions around the peak are clumpy and elongated in position angle on scales of up to 10 arcmin (300 kpc). The reason for this elongation is not clear; there are no bright associated galaxies coincident with it on sky-survey plates. The X-ray emission on larger scales is asymmetrical, being significantly more extended to the south and west than it is to the north and east.
Spectral fits to the data were carried out in the energy range 0.2–1.9 keV (SASS channels 6–29 inclusive), for consistency with earlier work and because this is the energy band over which the PSPC point-response function can be modelled accurately. A thermal model is a better fit to the data than a power law, as expected from the extended nature of the X-ray emission. The best-fitting single thermal model at the redshift of the host galaxy has abundances 100 per cent solar, keV, galactic cm-2, with errors being for two interesting parameters. This value of is consistent with the value interpolated from the results of Stark et al. (1992), cm-2, at the level; fixing galactic at this value and allowing intrinsic to vary gives a best-fit model with 50 per cent solar abundances and keV, with negligible intrinsic absorption. More complicated models, such as a two-component thermal model or a thermal model plus power law, do not improve the fit to the data; there is also no significant difference in the temperatures fitted to the inner and outer regions of the source consistent with little variation of the gas temperature across the source. The count rate and spectrum imply a 0.2–1.9 keV luminosity of W; the source is thus comparable to the brightest sources studied by Worrall & Birkinshaw (1994).
Although the source is not azimuthally symmetrical, radial profile fitting allows its size to be roughly characterised. We therefore extracted a background-subtracted radial profile as described by Worrall & Birkinshaw (1994), and determined the best-fitting model consisting of a -model (Sarazin 1986) and an unresolved component. The best-fitting models have low ; with the best-fit model had a core radius of 35 arcsec, with a central gas density m-3. The radial profile and best-fit model are plotted in Fig. 2. The unresolved component contained per cent of the counts; any nuclear component is therefore weak in comparison to the extended emission, as suggested by the spectral-model fits. The particular value of chosen does not strongly affect the results discussed in the remainder of the paper. Models with formally require a cutoff radius to prevent the gas mass becoming infinite, but, as noted by Birkinshaw & Worrall (1993), the effect on the model emission measure distribution is small over the region in which the X-ray-emitting gas is detected.
3 Radio-X-ray comparison
Fig. 3 shows the 608-MHz WSRT map of Leahy et al. (1997) overlaid on a grey-scale representation of the image of Fig. 1. The southern lobe appears to be embedded in X-ray emitting material, while the northern plume is clear of it after the bend at 5 arcmin (150 kpc) from the core. This may be interpreted as evidence for interaction between the outflow from the radio source and the ambient medium; the differences between the southern lobe and northern plume are then attributed to the different external environments, with the higher inferred densities to the south being sufficient to confine the outflow and form a lobe.
Further evidence suggesting that the radio emission is interacting with the X-ray-emitting medium (rather than just being projected on to it) comes from an apparent local surface-brightness minimum in the X-ray emission coincident with the southern lobe; this suggests that the pressure from the relativistic particles in the lobe has displaced the thermal plasma, which now seems to be forming a rim around it. We emphasise, however, that the individual features forming the southern edge of the rim are detected, on maps smoothed with a Gaussian with arcmin, at the 3– level only; further observations are needed to confirm the nature of these features. (We discuss the significance of features in smoothed X-ray images in Appendix A.) Fig. 4 shows the edge-brightened nature of this rim; the background-corrected surface brightness drops by more than a factor of 2 between edge and minimum, although the cut of Fig. 4 passes through an off-centre blob of X-ray emission. When mean count rates are measured from the vignetting-corrected 0.1-2.5 keV data in the deficit region (defined using the radio contours as a guide) and the ‘rim’ (defined as a region extending 2-3 arcmin out from the deficit region, but excluding the bright central regions of the source), the mean count rate (source and background) in the rim [ counts arcsec-2 s-1] exceeds that in the deficit region [ counts arcsec-2 s-1] at the level, so we regard the deficit of X-ray emission as significant. Similar X-ray deficits associated with radio lobes have been seen in the cluster-centre galaxy NGC 1275 by Böhringer et al. (1993) and in the powerful FRII radio galaxy Cygnus A (Carilli, Perley & Harris 1994). We cannot rule out the possibility that the radio lobe coincides with the X-ray minimum purely by chance, but the coincidence in size between the radio lobe and the spacing of the ‘rim’ features is certainly suggestive.
The inner and outer regions of 3C 449 have different rotation measures (RM); Cornwell & Perley (1984) measure -210 rad m-2 near the source centre while Andernach et al. (1992) find RM rad m-2 in the outer lobes. The bulk of the RM is probably contributed by our Galaxy; nearby sources have average RM rad m-2, though the situation is complicated by a foreground HII region which crosses 3C 449 (Andernach et al.). If the difference between the central and outer regions of 3C 449 is due to the cluster gas, then it can be produced with uniform magnetic fields in the X-ray emitting gas of roughly 10 pT.
4 Discussion: dynamics of the radio source
If the radio-emitting material has displaced thermal plasma then we expect pressures to be comparable in the southern lobe and surrounding gas. Figure 5 shows the pressure predicted by the best-fitting -model (with , core radius 35 arcsec and keV) as a function of distance from the source centre, together with minimum pressures at various points in the radio source. It can be seen that if the radio source is in the plane of the sky the minimum pressures are lower than the inferred hot gas pressure at all points in the source, with the discrepancy being greatest (a factor of 20) at the far ends of the object. Similar results are obtained by using other models for the ambient gas: for example, if the southern region of the X-ray source is modelled as a uniform spherical shell with inner radius 4.5 arcmin and outer radius 6.2 arcmin (Fig. 4), neglecting the off-centre blob of emission which may be a foreground or background feature, the thermal pressure is Pa, slightly higher than the value predicted by the -model.
Underpressuring of the radio lobes with respect to the X-ray-emitting plasma has been observed in other low-power sources (Morganti et al. 1988; Killeen, Bicknell & Ekers 1988; Feretti, Perola & Fanti 1992; Böhringer et al. 1993; Worrall et al. 1995). We can attempt to resolve the discrepancy by considering projection effects on the radio source, by considering dynamical pressure balance, by allowing relativistic protons to make a significant contribution to the energy density, by considering situations where the energy densities are far from equipartition, or by allowing internal thermal material. These possibilities will be discussed in turn.
The assumption that the source is in the plane of the sky may be incorrect. If the source makes an angle to the line of sight both the measured distance from the centre and the length used in minimum-energy calculation are underestimated by a factor ; the minimum pressure in a given component drops as a result by a factor of roughly . Because of this, small angles to the line of sight () are necessary to achieve pressure balance even in the inner regions of the source where the pressures are most nearly matched. This is implausible both because of the observed symmetry of the jets (the degree of symmetry seen in high-resolution VLA radio maps would require velocities in the jets at 5 kpc from the core of , compared with the estimated velocities of at that distance from the core in similar objects: Hardcastle et al. 1996, 1997; Laing 1996) and because of the implausibly large true linear sizes ( Mpc) they would imply for the radio source. This is unlikely to provide a solution to the problem, therefore. If we use the velocities inferred from observations of other sources, the angle to the line of sight is predicted from the jet sidedness to be .
Pressure balance could in principle be dynamical if the lobe were expanding; if we postulate a spherically symmetric wind, driven by the jet, impinging on the external medium, then the problem is similar to that of the hot spots of classical double radio sources, and the non-relativistic equation of pressure balance in the frame of the edge of the lobe is
where is the outward velocity of the lobe’s edge. This can be rewritten in terms of the internal sound speed and Mach number of the wind:
(where is the internal adiabatic index) from which it can be seen that no subsonic solution exists if and . For a purely relativistic internal plasma , so a relativistic wind would be required for pressure balance, and we would expect to see effects of beaming on the surface brightness of the lobe. If cold denser material were mixed into the plasma (e.g. entrained material, discussed below) then would drop and and would rise, making lower wind speeds possible. The energetics of this process, though demanding, are not completely inconsistent with the power that could be supplied by the jet. It is harder to apply this explanation to the underpressuring in the inner regions of the source.
The minimum pressure of the radio plasma is a weak function of the ratio between the number of radiating and non-radiating relativistic particles in the plasma, going roughly as . A large contribution from relativistic protons () is necessary before the internal and external pressures in the outer regions of the source become similar. A plasma filling factor of less than has the same effect. Neither of these situations can be ruled out. Filamentary structures seen in radio maps of the best-studied objects at high resolution may indicate filling factors of this order when projection effects are taken into account. In the inner jets, where the pressure discrepancy is less, a more moderate contribution from protons () or a larger filling factor () is sufficient to achieve pressure balance.
The electron and magnetic field energy densities may be far from equipartition. The equipartition -field in the southern lobe, treated as a uniform sphere with , is approximately 0.14 nT; to achieve the required pressures, the -field must be either 0.9 nT (a factor of 6 above equipartition) or 30 pT (a factor of 5 below equipartition). In the latter case, the flux in X-rays from inverse-Compton scattering of the cosmic background radiation (calculated using the code of Hardcastle, Birkinshaw & Worrall 1998) would be significant and detectable with our observations, so this possibility can be neglected and only a high -field is consistent with observation. However, Feigelson et al. (1995) report on X-ray observations of Fornax A which are consistent with a lobe magnetic field slightly weaker than equipartition (with , ) in that object. Again, in the inner jets, the problem is less severe; the -field must be about a factor 4 above equipartition, or a factor 3 below it.
The jets will entrain material as they pass through the galaxy (e.g. Bicknell 1994 and references therein), and the entrained gas will provide a contribution to the internal pressure. The fact that the discrepancy between internal and external pressures increases with distance from the galaxy is consistent with this model, since we would expect the amount of entrained material to increase in this way. But the fact that there is a deficit in X-ray emission in the S lobe suggests that there is little hot ( keV) gas in this region, and so that there is little contribution to the internal pressure from hot gas. Cold gas would not be observed in X-rays but would contribute less to . The observed depolarization between and 21 cm, (DP; Jägers 1987) in the centre of the lobe suggests that the internal thermal electron density m-3, using the simple models of Cioffi & Jones (1980), which is less than the inferred external particle density at this radius ( m-3). Depolarization, at least in the inner regions of the source, can be attributed entirely to rotation measure gradients across it (Cornwell & Perley 1984). However, field reversals can hide large quantities of thermal material (Laing 1984), so it is possible that thermal material at temperatures significantly different from 1 keV contributes to the internal pressure; the fact that the 608-MHz polarization is much higher at the edges of the lobe than at the centre is certainly suggestive of internal depolarization.
If the radio source is genuinely underpressured with respect to the hot gas, the association between the radio lobe and the X-ray void must be considered coincidental, in the sense that the lobe has simply filled a pre-existing region of low gas density. This is not completely out of the question, since the collapse time of such a region is comparable to , where is the size of the region and is the sound speed in the X-ray gas; this time is a few years, comparable to the lifetime of the radio source. The hypothesis is consistent with the generally unrelaxed appearance of the X-ray emission. The problem again is to account for the underpressuring in the inner regions, where the collapse times are much shorter.
5 Conclusion
We have presented evidence that the large-scale structure of 3C 449 is being determined by the distribution of the hot intergalactic plasma.
The radio lobes are significantly underpressured if the radio-emitting plasma is electron/positron with filling factor unity and the magnetic field and particles are in energy equipartition. It is then hard to understand how the southern lobe can be associated with a deficit of X-ray emission. This problem, which seems to be common in low-power radio sources, may be resolved in a number of ways; the most plausible seem to be a dominant contribution to the particle energy density from relativistic or thermal (entrained) protons or a plasma filling factor much less than unity.
ACKNOWLEDGEMENTS
Support from PPARC grant GR/K98582 and NASA grant NAG 5-1882 is gratefully acknowledged. We are grateful to Larry Rudnick for providing us with his 5-GHz VLA map of 3C 449 and to the referee, Dr Leahy, for drawing the polarization in the maps of Jägers (1987) to our attention, for discussion of the statistics in Appendix A, and for a number of other helpful comments.
References
- [] Andernach H., Feretti L., Giovannini G., Klein U., Rosetti E., Schnaubelt J., 1992, A&AS, 93, 331
- [] Balcells M., Morganti R., Oosterloo T., Pérez-Fournon I., González-Serrano J.I., 1995, A&A, 302, 665
- [] Bicknell G.V., 1994, ApJ, 422, 542
- [] Birkinshaw M., Laing R.A., Peacock J.A., 1981, MNRAS, 197, 253
- [] Birkinshaw M., Worrall D.M., 1993, ApJ, 412, 568
- [] Böhringer H., Voges W., Fabian A.C., Edge A.C., Neumann D.M., 1993, MNRAS, 264, L25
- [] Carilli C.L., Perley R.A., Harris D.E., 1994, MNRAS, 270, 173
- [] Cioffi D.F., Jones T.W., 1980, AJ, 85, 368
- [] Cornwell T., Perley R., 1984, in Bridle A.H., Eilek J.A., eds, Physics of Energy Transport in Radio Galaxies, NRAO Workshop no. 9, NRAO, Green Bank, West Virginia, p. 39
- [] Fanaroff B.L., Riley J.M., 1974, MNRAS, 167, 31P
- [] Feigelson E.D., Laurent-Muehleisen S.A., Kollgaard R.I., Fomalont E., 1995, ApJ, 449, L149
- [] Feretti L., Perola G.C., Fanti R., 1992, A&A, 265, 9
- [] Hardcastle M.J., Alexander P., Pooley G.G., Riley J.M., 1996, MNRAS, 278, 273
- [] Hardcastle M.J., Alexander P., Pooley G.G., Riley J.M., 1997, MNRAS, 288, L1
- [] Hardcastle M.J., Birkinshaw M., Worrall D.M., 1998, to appear in MNRAS (astro-ph/9709228)
- [] Hardee P.E., Cooper M.A., Clarke D.A., 1994, ApJ, 424, 126
- [] Jägers W.J., 1987, A&AS, 71, 75
- [] Killeen N.E.B., Bicknell G.V., Ekers R.D., 1988, ApJ, 325, 180
- [] Laing R.A., 1984, in Bridle A.H., Eilek J.A., eds, Physics of Energy Transport in Radio Galaxies, NRAO Workshop no. 9, NRAO, Green Bank, West Virginia, p. 90
- [] Laing R.A., 1996, in Hardee P.E., Bridle A.H., Zensus J.A., eds, Energy Transport in Radio Galaxies and Quasars, ASP Conference Series vol. 100, San Francisco, p. 241
- [] Leahy J.P., Bridle A.H., Strom R.G., 1997, Internet WWW page, at URL: http://www.jb.man.ac.uk/atlas/
- [] Lupton R.H., Gott J.R., 1982, ApJ, 255, 408
- [] Miley G.K., Norman C., Silk J., Fabbiano G., 1983, A&A, 122, 330
- [] Morganti R., Fanti R., Gioia I.M., Harris D.E., Parma P., de Ruiter H., 1988, A&A, 189, 11
- [] Perley R.A., Willis A.G., Scott J.S., 1979, Nat, 281, 437
- [] Sarazin C.L., 1986, Rev. Mod. Phys. , 58, 1
- [] Snowden S., 1997, Internet WWW page, at URL ftp://legacy.gsfc.nasa.gov/rosat/software/fortran/sxrb/README
- [] Stark A.A., Gammie C.F., Wilson R.W., Bally J., Linke R.A., Heiles C., Hurwitz M., 1992, ApJS, 79, 77
- [] Worrall D.M., Birkinshaw M., 1994, ApJ, 427, 134
- [] Worrall D.M., Birkinshaw M., Cameron R.A., 1995, ApJ, 449, 93
- [] Wyndham J.D., 1966, ApJ, 144, 459
Appendix A Uncertainties in smoothed X-ray images
It is often necessary to convolve X-ray images with one or more smoothing Gaussians in order to analyse extended structure. The disadvantage of this procedure is that it renders a calculation of the significance of detected structure or of the uncertainties on measured quantities more difficult. Here we outline a means of overcoming the problem.
When a two-dimensional array of Poisson noise, with mean counts per pixel, is convolved with a Gaussian () it is tempting, but incorrect, to treat the Gaussian as a single bin of size and apply Poisson statistics (with a mean of ) to calculate the significance of the results. This approach badly overestimates the spread of the cumulative probability distribution (CPD), and so overestimates the errors, because it treats the value of each pixel in the convolved array as the uniformly weighted sum of a small, finite number of single pixels containing Poisson-distributed values, rather than as the Gaussian-weighted sum of a large (formally infinite) number of such pixels.
A more rigorous treatment produces a better answer. Let the number of counts in a pixel in a smoothed image, , be the weighted sum of the contributions from the pixels in the original image, ; , where are the weights. If the expected number of counts per pixel in the unsmoothed image was , then ; clearly we require . The variance of , is given by ; for Poisson-distributed , . If the smoothing function is a 2-D Gaussian adequately sampled by the pixels, then we can write , where the condition requires that ; then
so that the standard deviation of the distribution is . This result differs by a factor of only from that derived from the naive approach discussed above. In the limit that , this calculation therefore allows an accurate calculation of the significance of a detection; the Central Limit Theorem guarantees that the cumulative probability distribution (CPD) approaches normality, so that the statistics can be treated as Gaussian, and the large means that the assumption of a well-sampled convolving function is valid. However, when , these assumptions are not applicable and application of the result systematically underestimates the true errors.
Because of this problem, the most general approach, and the one we have adopted in this paper, is to use numerical (Monte Carlo) methods to determine the correct CPD. The simplest numerical route to the CPD involves generating a large number of arrays of pixels containing Poisson noise with the correct mean number of counts per pixel , convolving with the Gaussian of interest, and generating an approximate CPD from the results. This can then be used to find the number of counts per convolved pixel corresponding to the 1, 2 and 3- probability levels of a normal distribution. Results from this procedure are plotted in Fig. A6. As expected, the CPD converges on a normal distribution as the Gaussian size tends to infinity and/or for large ; consequently, the standard deviation of the smoothed dataset is a good estimator of significance level. However, in the more usual case in X-ray astronomy where the Gaussian has a of a few pixels and the noise is far from normally distributed, and the standard deviation of the convolved array is not a good estimator of the 68 per cent confidence (‘’) level; Monte Carlo methods then seem to be required. The approach can easily be extended to calculating the CPD of a binned array of smoothed Poisson noise, and automatically takes account of the fact that nearby pixels are not independent after smoothing. This method was used to find the error bars in Fig. 4.