Evidence for Merging in the Centaurus Cluster
Abstract
We present a two dimensional map of the gas temperature distribution in the Centaurus cluster, based on ASCA observations derived using a novel approach to account for the energy dependent point spread function. Along with a cool region, centered on NGC4696, asymmetric temperature variations of moderate amplitude are detected. The hottest region roughly coincides with the position of the second brightest galaxy NGC4709, known to be the dominant galaxy of one of the subgroups in the Centaurus cluster. ROSAT images show faint surface brightness emission also centered on this galaxy. The imaging and spectral results suggest that a subcluster, centered on NGC4709 is merging with the main cluster centered on NGC4696, in agreement with the earlier suggestion by Lucey et al. (1986) that these two systems are located at the same distance despite their different line-of-sight velocities.
Subject headings:
galaxies: clusters: individual (Centaurus) — X-rays: general — large-scale structure of universe1. INTRODUCTION
The Centaurus cluster is a nearby (mean velocity of the dominant component is about 3000 km s-1, e.g. Lucey, Currie, & Dickens 1986) X-ray bright cluster with a 2–10 keV luminosity of ergs s-1 (Jones & Forman 1978). The cluster X–ray emission is strongly peaked on the cD galaxy NGC4696, indicating a cooling flow with a moderate mass deposition rate of 30–50 (e.g. Matilsky, Jones & Forman 1985; Allen & Fabian 1994; White, Jones & Forman 1997).
The cluster was intensively studied in X-rays with imaging instruments by Einstein (Matilsky, Jones & Forman 1985), ROSAT (Allen & Fabian 1994), and ASCA (Fukazawa et al. 1994). Rather smooth X-ray isophotes, having a slightly elliptical shape (Allen & Fabian 1994), and the presence of a cooling flow suggest that the Centaurus cluster is a relatively relaxed system. However, measurements of line-of-sight velocities indicate the presence of two distinct components (Lucey et al. 1986), one centered on NGC4696 and another dominated by NGC4709, but having a factor of 2.5 fewer galaxies. These two components, denoted as Cen 30 and Cen 45, have mean velocities and dispersions of km s-1, km s-1 and km s-1, km s-1 respectively (Lucey et al. 1986). Although this may be the simple projection of two spatially separated groups, Lucey et al. (1986) argued, on the basis of comparison of luminosity functions, color–magnitude relations and galaxian-radius distributions, that both components are in fact located at the same distance. This would imply that the main cluster, Cen 30, is in the process of accreting the smaller group, Cen 45, at the present time. We show below that the ASCA observations provide strong support that the Centaurus cluster is undergoing a merger.
The structure of the paper is as follows: Section 2 briefly describes the X–ray observations and data reduction procedure. In Section 3 we discuss results of the analysis and present arguments in favor of an ongoing merger of the Cen 30 and Cen 45 subclusters. Section 4 summarizes the results.
2. DATA ANALYSIS
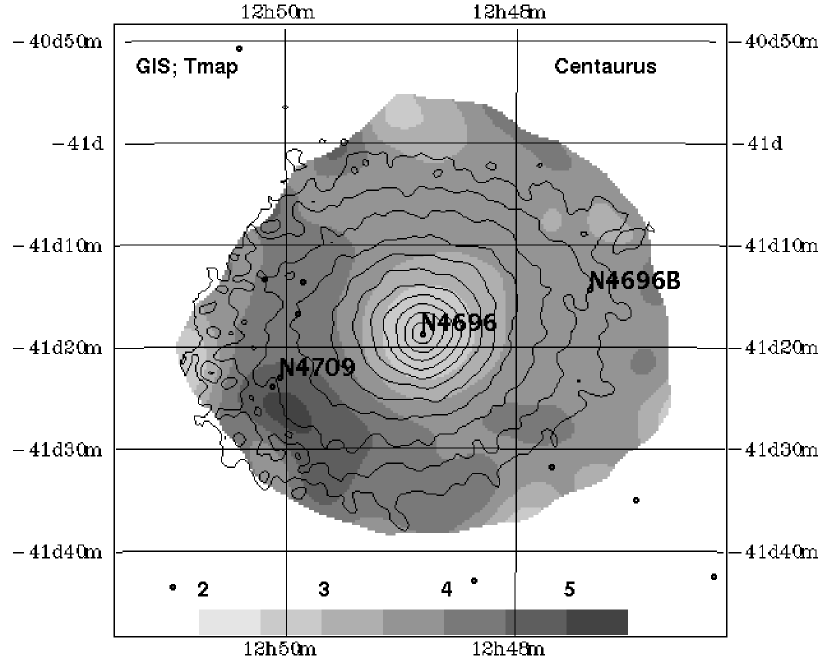
For the analysis presented below, we used three observations of the Centaurus cluster taken with ASCA on 1993 June 30, July 5 and 1995 July 19. These three observations have two slightly different pointing directions and together cover the region extending from the SE to the NW. Primarily GIS data were used for the analysis, which has a larger field of view and more stable characteristics over 1993–1995, compared to the ASCA SIS. Standard screening has been applied to the ASCA data with recommended values, forming a cleaned data set which was used for all the analysis. Similar screening criteria have been applied to publicly available observations of “blank fields”, which were used for background subtraction. The effective area was calculated using the most recent version of the efficiency curves (xrt_ea_v2_0.fits). A contour map of the resulting background subtracted, vignetting corrected, GIS image in the 0.5–2 keV energy band is shown in Fig. 1 (Plate 1). The circle coinciding with the peak of the surface brightness corresponds to the dominant galaxy NGC4696.
To reconstruct the projected (two dimensional) gas temperature distribution, we used the approach described in Churazov et al. (1996). This method provides an efficient characterization of the shape of the spectrum at a given position as a linear combination of template spectra, corresponding to optically thin plasma emission models at two different temperatures. For our analysis, we used the MEKAL model from XSPEC (convolved with the efficiency of the mirror systems and the appropriate ASCA detector) at temperatures of 2 and 8 keV, as template spectra. For both template spectra, the heavy element abundance was set to 0.5 of solar, the absorption column density to , and the redshift to 0.0104. The value of the temperature at a given position is calculated from a simple combination of the best fit weights of the two template models to the spectrum observed at this position. Due to the linear nature of the method no actual fitting is required and, hence, the method is computationally fast. Although the limitations of this method are significant (e.g., simple spectral forms must be assumed a priori), this approach does provide a convenient method to examine two dimensional spatial variations in gas temperature. Note that for a single temperature spectrum, the accuracy of the method is sufficient (for temperatures above 2 keV) as shown by the simulations in Churazov et al. (1996).
The extended, energy dependent wings of the ASCA mirrors are known to cause significant systematic errors in spectral analyses of extended sources, usually leading to spurious temperature increases at large radii from the cluster center where the scattered emission from the cluster center contributes significantly to the total emission. We developed an approach to correct for the effects of the PSF (for a detailed description including a more rigorous derivation see Gilfanov et al. 1998) which relies on the existence of a compact core in the ASCA PSF. For the PSF model, we use publicly available GIS images of Cygnus X–1 observed with different positional offsets. The method is based on the assumption that the ASCA PSF () can be represented as the sum of two components:
| (1) |
where corresponds to the rather compact “core” of the PSF and corresponds to the extended (large spatial scale) wings of the PSF, in such a way that , i.e., the wings of the PSF contain only a small fraction of the photons (we assume here that by definition ). The convolution of the true sky image () with the PSF can be rewritten as
| (2) |
where is the observed detector image. Provided that is sufficiently compact, the first term in the above sum, , would provide a resonable approximation to the sky image , since it is the convolution of the true sky image with a relatively compact function. From (2) it follows that
| (3) |
Utilizing the fact that , one can obtain an approximate solution, for , by substituting the measured detector image for in the right side of equation (3)
| (4) |
One can see that the two last terms in the above equation can be dropped, assuming that the cluster image is “smooth” and . Thus,
| (5) |
To practically implement this method, we use the following simple choice for and :
where is the distance from the center of the PSF. The accuracy of the approximation in eq. (5) is determined by the fraction of photons contained in the PSF wings, , which in turn depends on the value of – the larger is , the better the approximation. On the other hand, for larger values of , the PSF core defined above becomes less compact and its energy and position dependence becomes more important. The choice of was found to be adequate for clusters with core radii larger than a few arcminutes.
Equation (5) involves a two-dimensional convolution () of the observed detector image (in a given energy band) with , which in turn depends on position and energy. Straightforward convolution is a very time consuming procedure, but a dramatic acceleration can be achieved via a Monte-Carlo approach. For each detected photon, we choose random positions (distributed according to ) and subtract their contribution () from the corresponding positions. The function itself is represented as a one-dimensional cumulative array, i.e. the two-dimensional array (of size ) is represented as a one-dimensional array of size , whose -th element is equal to the sum of all elements from with indices less than . Such a representation of allows one to generate random positions (distributed like ) with just a few arithmetical operations, using the bisection method.
The simplicity of this method makes its implementation computationally fast and it can be performed in each of the 1024 ASCA GIS energy channels (or 512 SIS channels) on a fine () angular grid. On the other hand, to decrease the systematic uncertainty intrinsic to this method, the value of must be sufficiently large. This restricts somewhat the applicability of this approach so that it can be applied most accurately to large, generally nearby clusters. In particular, the method has proven to work fairly well for clusters of galaxies with core radii exceeding several arcmin (see Gilfanov et al. 1998).
The resulting temperature map for the Centaurus cluster is shown in Fig. 1 (Plate 1). The statistical noise increases towards the edges of the map and the spectral measurements are shown only for those regions where the ratio of the upper limit on the temperature to the lower limit is less than a factor of 1.5. One can clearly see a cool region centered on NGC4696 as well as asymmetric variations of temperature. However, we wish to emphasize that these variations are of moderate amplitude with the temperature ranging from 3–3.5 keV to 4–4.5 keV (excluding the cooling flow region). Note that the hottest region to the SE is roughly coincident with the position of NGC4709 which is the dominant galaxy of the Cen 45 subcluster (Lucey et al. 1986).
The same PSF correction method can be applied to spectra accumulated from arbitrary regions. We have chosen a set of regions as shown in Fig. 2 and have accumulated GIS spectra for these regions. Shown in Fig. 2 are the results of fits to the GIS spectra for each region with a single temperature MEKAL model from XSPEC (with fixed redshift of , fixed interstellar absorption of cm-2). The temperature of the gas, the heavy element abundance, and the normalization were free parameters. Note that although the actual shape of the spectrum may be more complex than the model we are considering (in particular in the cooling flow region, see e.g. Fukazawa et al. 1994), for our purpose this simple model provides a useful characterization of the spectral hardness (temperature). Since we are interested primarily in the temperature variations outside cooling flow regions, a single temperature approximation is sufficient. This was further confirmed by values of for the outer regions.
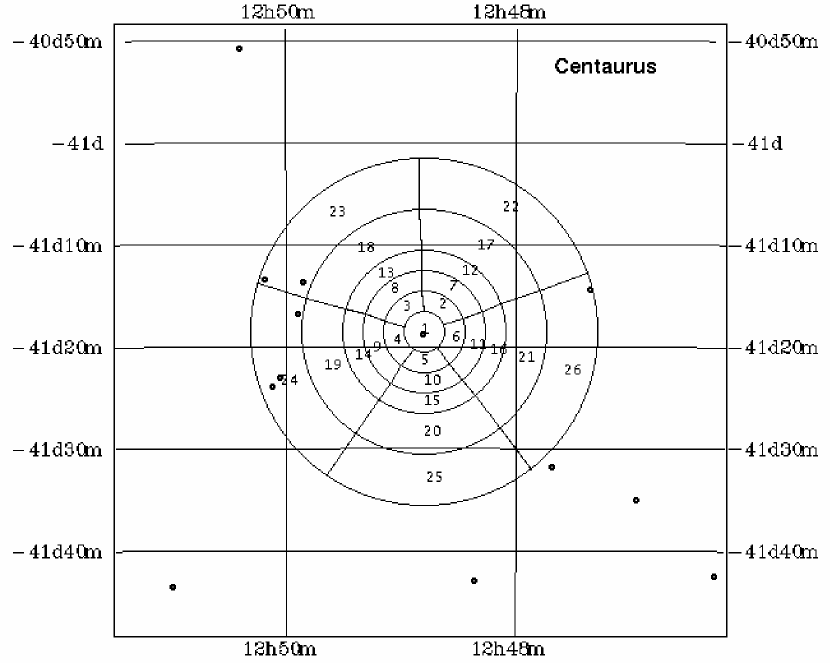

In Fig. 2, dotted lines separate the results obtained for different annuli. NGC4709 falls into region #24 which has a higher temperature than adjacent regions. Inspection of other annuli shows that in general, the temperature is higher in the direction from NGC4696 towards NGC4709. Comparing Fig. 2 with the two dimensional temperature map (Fig. 1) one can see that both methods give consistent results.
3. EVIDENCE FOR MERGING
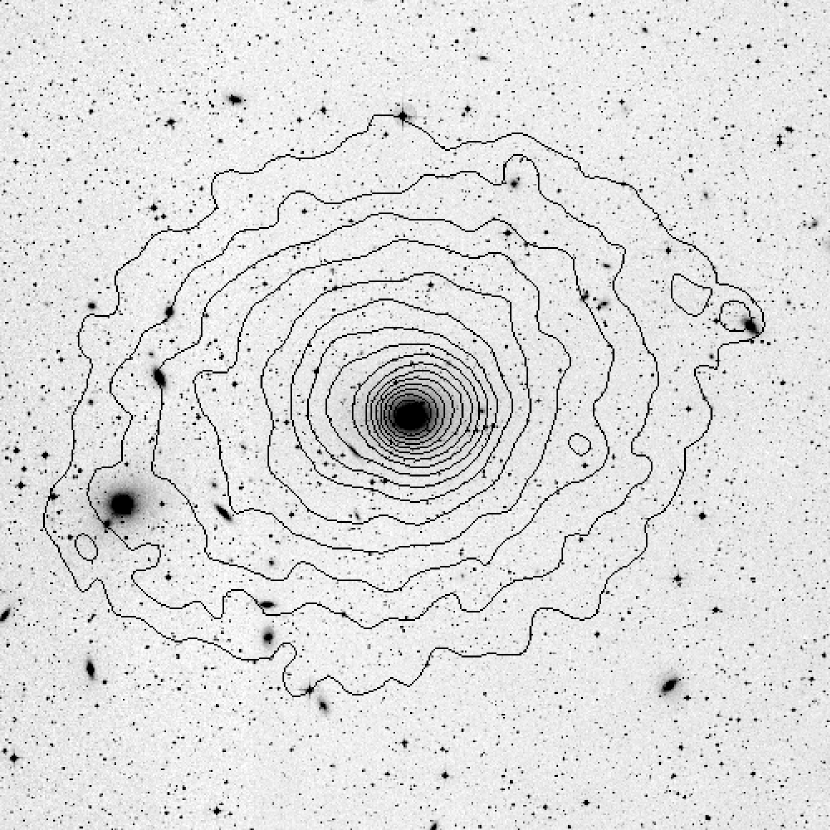
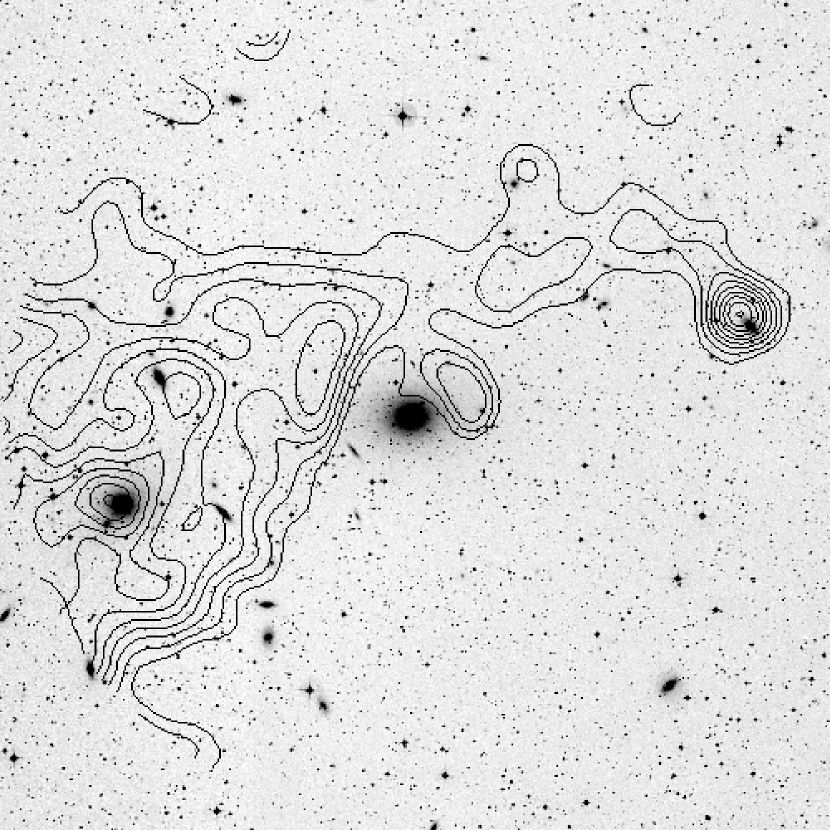
As is discussed by Allen & Fabian (1994), the soft X-ray emission from the Centaurus cluster is slightly elliptical. They also noted that the second brightest galaxy NGC4709 is located along the semimajor axis of the cluster. We co-added three ROSAT PSPC images, RP800607A01, RP800192N00, and RP800607N00, with total exposure time of about 18000 seconds. No cleaning was applied to the data to achieve maximal statistical significance. Exposure maps were generated for each pointing and also coadded. The resulting image (after correction for exposure and smoothing with a Gaussian) is shown in Fig.3. The elongation of the image and the variation of the centroid of the X–ray emission on spatial scales of a few arcminutes are consistent with those reported by Allen & Fabian (1994). To further emphasize the asymmetric structures in the surface brightness distribution, the image () was represented as a sum of “symmetric” () and “asymmetric” () components, where was calculated as the average surface brightness in wide annuli centered at NGC4696. The asymmetric component is equal to the difference between the original image and the symmetric component (). Shown in Fig. 3 is the ratio of the asymmetric to the symmetric components, , smoothed with a Gaussian. This image is, in fact, the relative deviation of the surface brightness from the average value at a given radius. Although such a decomposition of the surface brightness distribution into two components is of course somewhat arbitrary, there are several interesting features apparent in the figure. First, there is excess emission to the west of NGC4696, which is apparently responsible for the variation of the centroid of the X–ray isophotes as found in the analysis of Allen & Fabian (1994). Note that in the raw image, the surface brightness peak coincides nicely with the optical position of NGC4696 (at least better than ). Second, there are two very clear excesses of emission. One lies close to the position of the S0 galaxy NGC4696B (see also Allen & Fabian 1994) and another is centered on NGC4709 (which was not detected by Allen & Fabian (1994) who used cleaned data from only one pointing having a total exposure time of 3311 seconds). From Fig. 3, it is clear that NGC4709 marks the center of extended structure, lying to the east (and south–east) of NGC4696. Given the fact that NGC4709 is the dominant galaxy in the low velocity dispersion subgroup, Cen 45 (see Lucey et al. 1986), this suggests that this extended emission is associated with Cen 45. Of course, the intensity and extent of the structure around NGC4709 depends on the assumed centroid position used for calculation of the “symmetric” component. However, the detection of the excess emission close to NGC4709 is stable against variations of the centroid position for the symmetric component.
Since the Cen 45 group contains a factor of 2.5 fewer galaxies than Cen 30 (Lucey et al. 1986) and a significantly lower velocity dispersion (280 km s-1 compared to 586 km s-1 for the main group), a simple projection of the two subgroups would result in an excess surface brightness around NGC4709 (consistent with the ROSAT data), but a lower temperature in this region (contrary to the ASCA data, see Fig. 1). We suggest that the most straight forward explanation would be to assume that the gas in the region around NGC4709 is heated due to the interaction between the two subgroups. Note that the direction of the line joining NGC4709 and NGC4696 is co-aligned with features at various spatial scales. As noted by Allen & Fabian (1994), the major axes of the elliptical X-ray isophotes around NGC4696 (at arcsec) are aligned towards NGC4709 as are the optical isophotes of NGC4696 itself. At scales up to a few degrees, this same orientation marks the chain of separate groups, identified by Lucey et al. (1986). Thus, it may be that the Centaurus cluster is accreting matter (in rather small increments) along this preferential direction which perhaps marks the filamentary structure at large scales (see e.g. West, Jones, & Forman 1995). At the present time, the subgroup centered on NGC4709 is merging with the main cluster.
Another interesting feature which can be seen in Fig. 3 is an X-ray source close to the position of the S0 galaxy NGC4696B. Allen & Fabian (1994) noted that this X–ray source probably is associated with NGC4696B, which is one of the three brightest galaxies in the field (only NGC4696 and NGC4709 are brighter than NGC4696B in the optical band). However, the X–ray position is offset from the optical center of the galaxy by towards the north–east. Moreover, in Fig. 3 one can see a long and narrow filament which originates close to NGC4696B and extends to the north–east and then to the east. The filament is barely visible in the raw images and appears clearly only after subtraction of the component centered on NGC4696. The significance of the excess at various positions in the feature (defined as the ratio of the signal at a given position to the statistical error associated with the smoothed image) corresponds roughly to 2–3 . Note however that nearby pixels are not independent on the smoothed image.
Of course it is difficult to prove that the observed excess is a single feature. One can speculate however on the the origin of this feature using the same line of arguments as presented by Vikhlinin, Forman, & Jones (1996), who discussed a filament of X–ray emission in Coma. The two simplest scenarios assume that such a feature may be due to cold gas (ram pressure stripped) from NGC4696B, like that observed for M86, or due to a tidally disrupted dark halo from a group of galaxies during its passage through the central part of the Centaurus cluster. Future observations (AXAF, XMM and SPECTRUM–X–GAMMA) may distinguish between these two possibilities: a lower temperature and higher abundance of the excess emission would suggest stripping, while a lack of spectral changes would argue in favor of a perturbation in the gravitational potential.
The shift in the position of the peak of the X–ray emission from NGC4696B to the northeast of the optical position supports the suggestion that the whole feature is somehow associated with NGC4696B. Note also that the major axis of the optical emission of NGC4696B is also aligned in the direction of the tail. Assuming a radius for the feature of 25 kpc, a length 200 kpc, and an enhanced electron density of (required to produce the observed surface brightness increase), the total gas mass of the feature is of the order of . The required stripping rate can be estimated as , where is the galaxy velocity in units of 500 km sec-1. This value is too high for steady mass ejection by this single galaxy, suggesting either that the situation is transient or a group of galaxies is responsible for this gas. Considering that Centaurus is likely to be undergoing repeated mergers with smaller subgroups, we can expect that relatively gas rich galaxies are frequently entering the dense environment of this cluster. The evaporation time (assuming that this is cold gas stripped from NGC4696B) of such a feature due to thermal conduction would be short ( years) and one would have to assume that thermal conduction is suppressed below Spitzer’s value, which is not unlikely (see e.g. Pistinner, Levinson, & Eichler 1996). As discussed by Soker et al. (1991), stripped cool gas from cluster galaxies may fall to the bottom of the potential well and provide strong density fluctuations in the cooling flow region which are required to trigger thermal instabilities. It is interesting that the assumption that the observed filament arises from cool gas stripped from NGC4696B may indicate a rather high infall velocity for the cool gas. Indeed, if the bending of the tail towards NGC4696 is due to infall of the gas in the cluster potential, then the infall velocity should be comparable to the velocity of NGC4696B. The infall velocity of an overdense blob of radius cannot exceed its terminal velocity (e.g. Nulsen 1986), where is the Keplerian velocity and is the distance from the cluster center. If most of the mass in the feature is in X–ray emitting gas, then
| (6) |
The term is the surface brightness enhancement towards the feature, which is roughly 0.2–0.3, while . Therefore, . Infall of the blob at this velocity may be consistent with the curvature of the feature, if the velocity of NGC4696B is not much higher than . Such a high infall velocity would result in the tail, arising from stripped gas (which is visible in the images, i.e. is not much less than unity), having one end lying near the cluster center. However, the tail may be disrupted as it moves through the cluster gas (e.g. Nulsen 1996), effectively decreasing the terminal velocity of the infalling gas as it fragments into smaller blobs. Considering typical parameters for cooling flow clusters, Soker et al. (1991) found an infall velocity for stable blobs of roughly 60 km s-1, assuming a magnetic field of . Such low infall velocities would mean that the shape of the tail is just a reflection of the projection of the galaxy trajectory (which therefore must have passed through the very center of the Centaurus cluster).
4. DISCUSSION
Despite of the large difference ( km s-1) in the velocities of the Cen 30 and Cen 45 groups, Lucey et al. (1986) presented strong arguments that these two groups are located at the same distance. Luminosity functions, color–magnitude relations and galaxian-radius distributions support the assumption of a common distance and disagree with the contention that Cen 45 is significantly more distant than Cen 30, in accordance with their line-of-sight velocities. Dressler (1995) came to the same conclusion studying surface brightness fluctuations of several galaxies from both groups. These results imply that the smaller Cen 45 group is merging with the dominant Cen 30 group. The analysis of X–ray data further supports this scenario. Indeed, if one were observing the projection of two independent clusters, we would expect the overlapping region to have a lower temperature due to the predicted lower temperature of the smaller group Cen 45. Instead, we find that the temperature is highest in the region close to the dominant galaxy of the Cen 45 group, which we interpret as heating due to the interaction of the two subgroups. Note however that the presence of the cooling flow around NGC4696 restricts our ability to correctly estimate the extent of the hot region. We might also expect that when a poor group is entering a dense cluster environment for the first time, the relatively cold gas will be stripped due to the high ram pressure. The marginally significant filament near NGC4696B, seen in the ROSAT PSPC images, might be explained as the result of such an interaction.
Recently Stein, Jerjen, & Federspiel (1997) found, in the ∘circle around NGC4696, a very large velocity dispersion for Cen 30 ( km s-1) and a very low dispersion for Cen 45 ( km s-1). The assumption that the main cluster has a velocity dispersion of 933 km s-1 would make the so–called -problem very extreme. This parameter (which characterizes the ratio of energy per unit mass for galaxies to that in the gas) can be estimated from the X–ray surface brightness distribution, , or calculated from the observed velocity dispersion and gas temperature, . The slope of the PSPC surface brightness profile implies values of 0.4–0.45. However, 1.4 for 4 keV and 933 km s-1. Even though these values for disagree for many clusters, for Centaurus this disagreement is far larger than usual. An alternative and more likely explanation for the large velocity dispersion is that a large scale filament, which defines the preferential direction of accretion onto the cluster, lies close to the line of sight. This would explain the high observed velocity difference of the infalling group and would also account for the large velocity dispersion observed by Stein, Jerjen, & Federspiel (1997). The presence of a large scale filament crossing the center of Cen 30 also would naturally explain the alignments already mentioned above. Thus, accretion along a filament, lying mostly along the line of sight, but also partially along the direction defined by the centers of Cen 30 and Cen 45, would explain the common alignments of 1) the major axis of NGC4696, 2) the filament emanating from NGC4696B and 3) the nearby chain of groups (Lucey et al. 1986).
The effects of large scale filaments are seen around other clusters. For example, observations of A1689 suggest the presence of a large scale filament directly along the line of sight (Daines et al. 1998). In A1689, the three brightest galaxies in the direction of the cluster lie within of the cluster center, only one has a velocity equal to the cluster mean while the other two have velocity differences of +4767 km s-1and -2686 km s-1, far too large to be explained by the velocity dispersion of a relaxed keV temperature cluster. The nearby cluster A85 also shows the common alignment of several galaxy concentrations/subclusters with the major axis of the central cD galaxy (Durret et al. 1997). The X-ray temperature map for A85 (Markevitch et al. 1998) shows a hot region, suggestive of a shock produced by one of the infalling subclusters.
Large scale filaments and their effects on clusters also are found in recent numerical simulations which have adequate resolution. Colberg et al. (1998) showed that clusters accrete matter from a few preferred directions, defined by filamentary structures, and that the accretion persists over cosmologically long times. Thus, it should not be surprising to see common alignments between central galaxy major axes, infalling subclusters, surrounding groups, and, even on the scale of neighboring clusters (West et al. 1995). With the availability of cluster temperature maps, the X-ray observations allow us to differentiate between superpositions (chance alignments) and true mergers where shock heating occurs. Hence, as shown in this paper for Centaurus, we can now study the details of the merger process which provide strong evidence for accretion along preferred directions as predicted by numerical simulations of hierarchical structure formation.
References
- Allen & Fabian (1994) Allen S.W., Fabian A.C., 1994 MNRAS, 269, 409
- Churazov et al. (1996) Churazov E., Gilfanov M., Jones C., Forman W., 1996 ApJ, 471, 673
- (3) Colberg, J., White, S.D.M., Jenkins, A., & Pearce, F.R., 1998, submitted to MNRAS (astro-ph/9711041).
- (4) Daines, S., Jones, C., Forman, W. Tyson, A. 1998, submitted to ApJ
- Dressler (1995) Dressler A., 1995, Mount Stromlo and Siding Spring Observatories, Heron Island Workshop on Peculiar Velocities in the Universe
- (6) Durret, F., Forman, W., Gerbal, D., Jones, C., and Vikhlinin, A., 1998, submitted to A&A.
- Fukazawa et al. (1994) Fukazawa Y. et al., 1994 PASJ, 46, L55
- Gilfanov et al. (1998) Gilfanov M., Churazov E., Jones C., Forman W., 1998 (in preparation)
- Jones & Forman (1978) Jones C., Forman W., 1978 ApJ, 224, 1
- Lucey et al. (1986) Lucey J.R., Currie M.J. and Dickens R.J., 1986 MNRAS, 222, 427
- Markevitch et al. (1998) Markevitch, M., Forman, W., Sarazin, C., and Vikhlinin, A. 1998, submitted to ApJ
- Matilsky, Jones, & Forman (1985) Matilsky T., Jones C., Forman W., 1985 ApJ, 291, 621
- Navarro, Frenk & White (1995) Navarro J., Frenk C., White S., 1995, MNRAS, 275, 720
- Nulsen (1986) Nulsen P., 1986, MNRAS, 221, 377
- Pistinner (1996) Pistinner S., Levinson, A., Eichler, D. 1996, ApJL, 467, 162
- Soker et al. (1991) Soker N, Bregman J., Sarazin C., 1991 ApJ, 368, 341
- Stein, Jerjen, & Federspiel (1997) Stein P., Jerjen H. and Federspiel M., 1997, astro–ph/9707211
- Vikhlinin, Forman, & Jones (1996) Vikhlinin A., Forman W., Jones C, 1996 ApJ, 474, L7
- West, Jones, & Forman (1995) West M., Jones C., Forman W., 1995 ApJ, 451, L5
- White et al. (1991) White D.A., Fabian A.C., Jones C., Forman W., Stern C, 1991 ApJ, 375, 35
- White, Jones & Forman (1997) White, D., Jones, C., & Forman, W. 1997 MNRAS, 292, 419