Gamma-Ray Burst Spectra and Time Histories From 2 to 400 keV
Abstract
The Gamma-Ray burst detector on Ginga consisted of a proportional counter to observe the x-rays and a scintillation counter to observe the gamma-rays. It was ideally suited to study the x-rays associated with gamma-ray bursts (GRBs). Ginga detected GRBs and 22 of them had sufficient statistics to determine spectra from 2 to 400 keV. Although the Ginga and BATSE trigger criteria were very similar, the distribution of spectral parameters was different. Ginga observed bend energies in the spectra down to 2 keV and had a larger fraction of bursts with low energy power law indexes greater than zero. The average ratio of energy in the x-ray band (2 to 10 keV) compared to the gamma-ray band (50 to 300 keV) was 24%. Some events had more energy in the x-ray band than in the gamma-ray band. One Ginga event had a period of time preceding the gamma rays that was effectively pure x-ray emission. This x-ray “preactivity” might be due to the penchant for the GRB time structure to be broader at lower energy rather than a different physical process. The x-rays tend to rise and fall slower than the gamma rays but they both tend to peak at about the same time. This argues against models involving the injection of relativistic electrons that cool by synchrotron radiation.
1 INTRODUCTION
Gamma-ray bursts (GRBs) are aptly name, most of their power is usually emitted in the 100 keV to 1 MeV energy range. Early results indicated that only a few percent of the energy of a Gamma-Ray burst (GRB) occurs in the 2-to-10 keV x-ray range [1, 2], although the X-ray emission might outlast the main GRB event in some bursts (so called X-ray tails). Based on these intriguing results, the gamma-ray burst detector (GBD) flown aboard the Ginga satellite was specifically designed to investigate burst spectra in the X-ray regime [3]. Ginga was launched in February of 1987, and the GBD was operational from March, 1987, until the reentry of the spacecraft in October, 1991.
More recently, the BeppoSax satellite has observed several bursts in both x-rays and gamma-rays [4, 5, 6] and has discovered soft x-ray afterglows [7]. This latter discovery has opened the way for the long-sought GRB counterparts, including one with a measured redshift [8].
Here, we summarize x-ray results from the Ginga experiment.
2 INSTRUMENTAL DETAILS
The GBD aboard Ginga consisted of a proportional counter (PC) sensitive to photons in the 2-to-25 keV range and a scintillation counter (SC) recording photons with energies between 15-to-400 keV. Each detector had an cm2 effective area. The PC and SC provided 16 and 32 channel spectra, respectively, over their indicated energy ranges. The detectors were uncollimated except for the presence of shielding to reduce backside illumination and the mechanical support for the PC window. The field of view was effectively steradian for both the PC and the SC.
Each detector produced both spectral and time history-data for GRBs. Photons within the energy range of each detector were accumulated into time samples. The hardware ensured that the time samples for both detectors started and stopped at the same time. This facilitates measuring the relative timing between the x-rays and gamma-rays. The temporal resolution of the time-history data depended on the telemetry mode. An on-board trigger system checked the time histories for a significant increase ( on either 1/8, 1/4, or 1 s time scales). Upon such a trigger, special high resolution temporal data (called “Memory Read Out” [MRO]) would be produced. The MRO data has time resolution of 0.03125 s. The PC MRO time history extends from 32 s before the trigger to 96 s after the trigger. The SC MRO time history extends from 16 s before the trigger to 48 s after the trigger. During the period when both detectors have MRO time histories, the MRO samples were in phase with each other. In addition to the MRO data, “Real Time” data were often continuously available. Three different telemetry modes resulted in PC and SC time histories with either 0.125, 1.0, or 4.0 s time resolution.
In burst mode, the GBD recorded spectral data from the PC and SC at 0.5 s intervals for 16 s before the burst trigger time and for 48 s after the trigger. The PC and SC had 16 and 32 energy channels, respectively. The MRO data were used for many of the spectral fits described here. In the event that MRO data were not available for a burst, we utilized the spectral data from the “real time” telemetry modes. For these bursts, spectral data were available with either 2, 16, or 64 s accumulations. For the longer accumulations, spectral studies were not generally feasible. See [3] and [9] for more information concerning the instrument.
The Ginga GBD was in operation from March 1987 to October 1991. During this time -ray bursts were identified [10, 11]. From this group, a sample of 22 events with statistically significant spectral data were analyzed [9]. These events occurred within the forward, steradian field of view of the detectors (front-side events). Front-side events are easily identified because they have consistent fluxes in the energy range observed by both instruments (15 to 25 keV). Excluded bursts usually show strong rolloffs below 25 keV and spectral fits with an absorption component due to aluminum (a principal spacecraft material) are consistent with this interpretation.
Because the incidence angle was known for just four of the events, we had to assume an incidence angle for the remaining events. We selected 37 degrees for the incidence angle when the angle was unknown. This is a typical angle considering that the mechanical support for the window on the PC acts as a collimator limiting the field of view to an opening angle of degrees. Extensive simulations [9] demonstrated that our conclusions were not affected by the uncertainty in the incidence angle.
We have adopted the spectral model employed by [12] because of its relative simplicity and ability to accurately characterize a wide range of spectral continua. In addition, this choice facilitates direct comparison of our results with those obtained from bursts seen by the Burst and Transient Source Experiment (BATSE). This model has the form
if
and
if
Here, is an overall scale factor, is the low-energy spectral index, is the high-energy spectral index, and is the exponential cutoff or bend energy. The model parameters are adjusted iteratively until a minimum in is obtained.
3 X-RAY CHARACTERISTICS OF
GINGA BURSTS
Of particular interest is the behavior of the Ginga sample at x-ray energies. About 40% of the bursts in the sample show a positive spectral number index below 20 keV (i.e., ), with the suggestion of rolloff toward lower energies in a few of the bursts ( as large as ) [9]. Unfortunately, the lack of data below 1 keV, and the often weak signal below 5-to-10 keV precludes establishing the physical process (photoelectric absorption, self-absorption) that may be involved in specific bursts. Observations of the low-energy asymptote can place serious constraints on several GRB models, most notably the synchrotron shock model which predicts that should be between -3/2 and -1/2 [13]. Crider et al. [14] uses examples from BATSE to argue that some GRB violate these limits during some time-resolved samples. We find violations of these limits in the time-integrated events.
In our sample of bursts, we find that can be both less than zero and greater than zero. Negative ’s are often seen in time-integrated BATSE spectra. Positive ’s for which the spectrum rolls over at low energies are usually only seen in time-resolved BATSE spectra [14].
Our distribution of parameters () is broader than that found by BATSE. For example, 40% of our events had greater than 0 compared to only 15% of BATSE events, and we had bend energies that occurred as low as 1.7 keV, wheras the lowest BATSE bend energy was 15 keV. The Ginga trigger range (50 to 400 keV) was virtually the same as BATSE’s. Thus, we do not think we are sampling a different population of bursts, yet we get a different range of fit parameters. One possible explanation might be that GRBs have two break energies, one often in the 50 to 500 keV range and the other near 5 keV. Both BATSE and Ginga fit with only a single break energy so BATSE tends to find breaks near the center of its energy range, and we tend to find breaks in our energy range. Without good high energy observations of bursts with low , it is difficult to know whether they also have a high-energy bend.
4 X-RAY EMISSION RELATIVE TO GAMMA-RAY EMISSION
Early measurements of the x-rays associated with gamma-rays were fortuitous observations by collimated x-ray detectors that just happen to catch a GRB in their field of view. From a few events it appeared that the amount of energy in x-rays was only a few percent (Laros et al., 1984 [1]) confirming that GRBs were, indeed, a gamma-ray phenomena. The Ginga experiment was designed with a wide field of view to detect a sufficient number of events to determine the range of x-ray characteristics. Early reports from Ginga events indicated that sometimes a much larger fraction of the emitted energy was contained in the x-rays. For example, by comparing the signal in the proportional counter (roughly 2 to 25 keV) to that of the scintillator (roughly 15 to 400 keV), we reported an x-ray to gamma-ray emission ratio up to 46% (Yoshida et al., 1989 [15]). Such a ratio depends on the bandpass for which it is evaluated. Using the best fit and from [9], one can find the ratio of emission for a typical x-ray bandpass (2 to 10 keV) compared to the BATSE energy range (50 to 300 keV). The ratio is defined to be . Figure 1 presents the distribution for the 22 events analyzed in [9]. Although the ratio is often a few percent, for some events the ratio is near (or larger than) unity. Some GRBs actually have more energy in the x-ray bandpass than the gamma-ray bandpass. The simple average of the 22 values is 24%. This large value arises because of the few events with nearly equal energy in the x-ray and gamma-ray bandpass. However, even the logarithmic average is 7%.
5 X-RAY PREACTIVITY OR PULSE SPREADING?
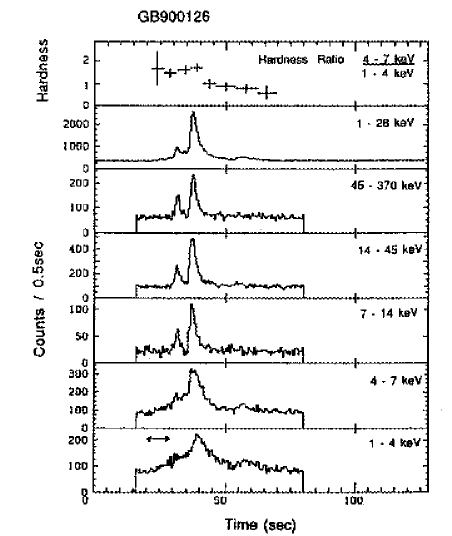
It is common for the x-ray emission to last longer than the gamma-ray emission [4, 5, 6, 15, 16, 17]. There is one clear example of x-ray activity preceding the GRB [16]. Figure 2 presents the time history of GB900126 in several energy bands. From top to bottom, one sees an x-ray hardness ratio, the count rate in the PC (1-to-28 keV, 0.03125 s resolution), and five time histories based on the PC and SC pulse height analysis (PHA) data (0.5 s resolution). The horizontal arrow in the bottom panel indicates the period that is effectively pure x-rays. During the period marked by the arrow, there is no detectable emission above 7 keV, but there is significant emission below 7 keV (see Murakami et al. [16]).
It would be misleading to refer to the x-ray phase as a “precursor” because it is not a separate peak. “Preactivity” gives the connotation of a separate cause for the emission although not necessarily as distinct as “precursor” might imply. However, the x-ray phase in Figure 2 could be due to the penchant for peaks to be wider at low energy. Figure 3 shows the average autocorrelation of GRB time histories in four energy bands. At higher energy, the autocorrelation is wider. This spreading of the time structure with energy is also seen in the average rise and fall times of individual pulses [18]. On average, the peak temporal width scales as . The spreading in Figure 2 is larger but that could reflect that some bursts have larger spreading than the average.
Perhaps there is not a separate cause for the x-ray emission, but rather, the physics responsible for the spreading as a function of energy causes the x-rays to appear to turn on before the gamma-rays.
The physics responsible for the spreading is unclear. Kazanas, Titarchuk, & Hua (1998) [19] have suggested two processes, synchrotron cooling of injected relativistic electrons and Compton downscattering of injected photons. Synchrotron cooling of ejected electrons can produce a time structure that scales as . However, such cooling should cause the emission at lower energy to peak later. In most GRBs, the rise and the fall are slower at low energy (causing the spreading) but the peak of the emission is not delayed substantially. In the calculations of Kazanas, Titarchuk, & Hua, the low energy emission (e.q., 25-to-50 keV) starts to rise after the high energy emission (e.q., 300-t0-1000 keV) has completely fallen. Because GRBs never seem to do this, we think it strongly argues against synchrotron cooling as the mechanism that produces the peaks in GRBs.
References
- [1] Laros, J. G., et al., 1984, ApJ, 286, 681.
- [2] Katoh, M., et al., 1984, in High Energy Transients in Astrophysics, AIP Conf. 115, ed. S. E. Woosley (AIP New York), 390.
- [3] Murakami, T., et al., 1989, Publ. Astron. Soc. Jap., 41, 405.
- [4] Piro, L., et al., 1997, A&A, in press, astro-ph/9707215.
- [5] Piro, L., et al., 1998, A&A, in press, astro-ph/9710334.
- [6] Frontera, F., et al., 1998, ApJ, in press, astro-ph/9711279.
- [7] Costa, E., et al., 1997, Nature, 387, 783, astro-ph/9706065.
- [8] Metgzer, M., et al., 1997, Nature, 387, 878.
- [9] Strohmayer, T., et al., 1998, ApJ, in press, astro-ph/9712332.
- [10] Ogasaka, Y., et al., 1991, ApJ, 383, L61.
- [11] Fenimore, E. E., et al., 1993, in AIP Conference Proceeding 280, Compton Gamma-Ray Observatory, ed. M. Friedlander, N. Gehrels, & D. Macomb, (New York:AIP), 917.
- [12] Band, D., et al., 1993, ApJ, 413, 281.
- [13] Katz, J. L., 1994, ApJ, 432, L107.
- [14] Crider, A., et al., 1997, 479, L93.
- [15] Yoshida, A., et al., 1989, PASJ, 41, 509.
- [16] Murakami, T., et al., 1991, Nature, 350, 592.
- [17] Murakami, T., Inoue, H., van Paradijs, J., Fenimore, E., & Yoshida, A., 1992, in Gamma-Ray Bursts, ed. C. Ho, R. I. Epstein & E. E. Fenimore, (Cambridge: Cambridge University Press), 239.
- [18] Fenimore, E. E., et al., 1995, ApJ, 448, L101.
- [19] Kazanas, D., Titarchuk, L. G., & Hua, X.-M., 1998, ApJ, in press, astro-ph/9709180.