The Fundamental Straight Line of Galactic Globular Clusters
Abstract
A detailed analysis of the Fundamental Plane properties of Globular Cluster is performed. If a sample of ordinary King-model clusters is considered, it is found that, in the space (S-space) defined by the parameters (log , log , ), their configuration is similar to a straight line.
It is shown that, with rather simple assumptions, a simultaneous explanation of all the observed correlations between S-space parameters can be provided.
It is suggested that, at earlier times,
Globular Clusters populated a line in the three-dimensional
, i.e their original dynamical structure was fully determined by a
single physical parameter.
PACS: 98.20.G
keywords:
Globular clusters: general;1 INTRODUCTION
The study of self-gravitating stellar systems through the analysis of their distribution into the N-dimensional space of their characteristic parameters has shown to be a very fruitful tool to learn about the formation and dynamical evolution of such objects. The method has been succesfully applied to elliptical galaxies (with the discovery of the so called Fundamental Plane of ellipticals; [Davies et al. (1987)], [Djorgovski & Davis 1987]), to spiral galaxies ([Whitmore 1984]), to galaxy clusters ([Schaeffer et al. 1993]), to globular clusters (Djorgovski 1995; hereafter [D95]) and to all these systems at once ([Burstein et al. 1997]).
In this scenario, the globular clusters (GCs) deserve a particular place because they are very simple systems and we also know by direct observations that, at odds with galaxies, they host a single-age/single-metallicity stellar population and they have not been subjected to chemical self-enrichment.
Furthermore, correlations between GCs observables can shed some light on the processes that led to formation of globulars, a very important issue by itself (see Meylan & Heggie 1997, hereafter [MH97], for a complete review).
[D95] showed that Galactic globulars are displaced on a plane into the three-dimensional space defined by the logarithm of their core radii (, in pc), V-band central surface brightness (, in mag/arcsec2) and logarithm of the velocity dispersion (in km/s) - hereafter S-space - i.e. they constitute a bidimensional manifold in S-space. The corresponding scaling law indicates that GCs cores are virialized systems with constant mass to light ratio (). In these hypotheses, the generic condition sufficient to obtain the observed Fundamental Plane of Globular Cluster (GCFP) is that the scatter induced in the GCFP by non-homology between globulars is smaller than that produced by the dispersion in M/L around a mean value, and by observational errors. This is certainly the most interesting among the three conditions (i.e., virial equilibrium, constancy of M/L and homology; see [Ciotti 1997]) but, for the aim of the present analysis, it can be considered as an observational fact.
[D95] showed also that if a space defined by all the photometric, structural and dynamical parameters is considered - hereafter SE-space -, the dimensionality of the manifold is still not more than 3: that means that many of the involved parameters correlates between each other (see also Djorgovsky & Meylan 1994 ([DM94]), [MH97]). Many of these correlations are not trivial and the origin of most of them is still unclear [DM94]. However Bellazzini et al. (1996; [BVFF]) and Vesperini (1997; [V97]) demonstrated that, for instance, the correlation between integrated cluster magnitude () and the logarithm of the central luminosity density () is very likely to have been settled at the time of GC formation, and that dynamical evolution, either intrinsic or due to the interaction with the host galaxy, is much more efficient in damaging any existing correlation between structural parameters than in settling one such correlation by means of evolutionary or selective disruption effects. These latter studies showed that it is possible to recover informations on the initial dynamical/structural conditions of a GCs system from present-day correlations between SE-space parameters.
In this short note I present a number of hints suggesting that Galactic GCs were formerly displaced on a Straight Line in the S-space, i.e. they formed a one-dimensional manifold in such space. Furthermore I present a simple and general explanation for all the observed mono-variate correlations between S-space parameters, comprehensive of a new, more satisfactory, interpretation of the correlation between cental surface brightness and velocity dispersion.
2 The S-space manifold of King Model globular clusters
[D95] exploited the existence of the Fundamental Plane of Galactic Globular Clusters (GCFP) in the S-space by a) demonstrating that the bi-variate GCFP correlations were significantly better than any of the mono-variate ones intercurring between each couple of the S-space parameters and, b) showing, with the application of Principal Component Analysis methods111Principal Component Analysis (PCA) is a multivariate analysis statistical technique apted to find the true dimensionality of a given dataset in a N-dimensional space of parameters. PCA finds the eigenvectors (principal components) that maximize the variance of data-points in a given space: often the sum of the variances accounted by the first M eigenvectors (with ) equals the whole cosmic variance expected in the dataset (the remaining variance being accounted by the “observational noise” present in the data). That means that data-points lie on a manifold of dimension M in the considered space, i.e. any of the N parameters correlates with a linear combination of M others, i.e. there are N-M couples of parameters that present strong correlations, thus are nearly equivalent for the description of the dataset properties. A brief and clear introduction to PCA can be found in [D95]. For deeper insights see [Murtagh & Heck 1987], that “… the first two principal component of the data ellipsoid account for the of the total sample variance …”. In other words, the amount of sample variance that could be accounted by any further dimension (for example, a third principal component) is significantly less () than the variance that is expected to be introduced into the sample by mere observational errors (which has to be at least , given the current uncertainties in the estimate of the involved observables; see Djorgovski 1993a, hereafter [D93]; see also sec. 3, below).
However, the sample analyzed by [D95] include both normal clusters, whose surface brightness profiles are well fitted by ordinary King models [King 1966], and also clusters presenting a power law cusp at their centers, and consequently classified as probably having passed the core collapse phase of their dynamical evolution (i.e. classified “c” or “c?” by [D93]; see also [DM94], [MH97] and references therein). Most of the globular cluster structural parameters refers to King models and so are somehow ill-defined when applied to Post Core Collapse Clusters (PCC); for instance [D93] is forced to assign a conventional value of cluster concentration (, where is the cluster tidal radius [King 1966] because this parameter is defined by King models. Concerning the S-space parameters, at least one of them is uncertainly defined for PCCs, i.e. core radius (see [BVFF] for a wider discussion). So, inclusion of PCCs into the scatter plots involving S-space parameters may be somehow risky or misleading. Furthermore, even if listed core parameters for PCCs were reliable, these clusters have passed the most evolved phase of their evolution and most of the records of initial conditions has probably been erased during the collapse.
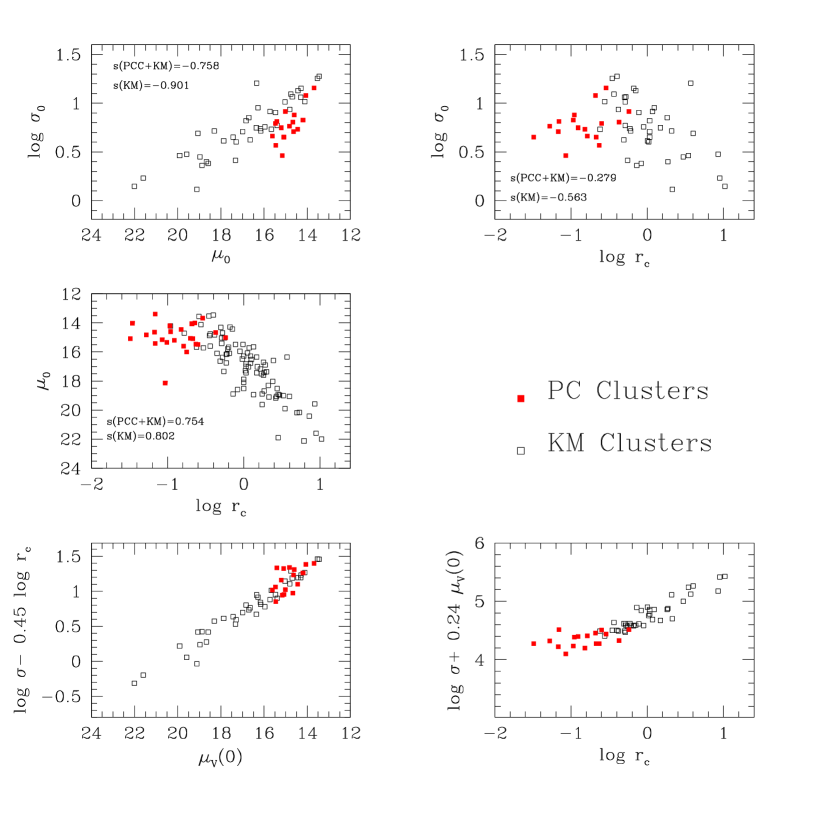
The three mono-variate correlations between the S-space parameters and two GCFP bi-variate correlations, also shown by [D95], are reported in fig. 1. Both the data sources ([D93], [Pryor & Meylan 1993], Trager, Djorgovski & King 1993, hereafter [TDK93]) and the scales of the plot are exactely the same of [D95], but in the present diagrams PCCs are plotted as filled squares while open squares correspond to ordinary King Model Clusters (KMC). The only difference with [D95] is that, in the logvs. plot, I included in the sample all the clusters that have a measure of both of these parameters (also when entry is missing) in the [D93] compilation: this choice, that has been followed all over this work, cannot affect the presented result. The use of a larger sample, at least when this specifical plane is considered, can only increase the statistical significance of the results themselves.
From the inspection of fig. 1, it is readily evident that much of the dispersion in the mono-variate plots is due to PCCs and that, if only KMCs are considered, the mono-variate correlations are strong and significant and, at least for two of them [(vs. log) and (logvs. )], their quality is comparable with that of the corresponding bi-variate ones. Since both logand logare strongly dependent on they cannot be truly independent, so the relatively high dispersion of the data-points into the (logvs. log) plane can also derive from a perverse composition of the observational errors (but see sec. 3.2 for a more satisfactory explanation).
If each parameter of a given N-dimensional space correlates with any of the N-1 others it means that the sample is displaced along a straight line into this space. Though PCA indicates that the statistical dimension of the manifold of KMCs is probably still 2 , the situation is indeed suggesting the existence of a Fundamental Straight Line (FSL) of KMCs. The first eigenvector accounts for of the KMC sample variance while, if PCCs are included in the sample, the variance accounted by the first eigenvector is only . In the upper right panel of fig.1 (logvs. log) there is a point in clear disagreement with the trend shown by the others KMCs, in the corner corresponding to high logand high log: this correspond to NGC 5139 ( Cen) which is known to be a very anomalous cluster from a dynamical point of view ([Meylan 1987], [White & Shawl 1987]) and also peculiar under many other aspects ([MH97], and references therein); on these bases doubt have been casted on its very classification as a globular ([Mateo 1996]). If NGC 5139 is excluded from the KMC sample the amount of variance accounted by the first eigenvectors grows to , i.e. the expected amount of cosmic variance in the dataset, given the current uncertainties in the observables.
Finally if, according to the approach introduced by [BVFF] and [V97], we consider the two subsample composed of KMCs that find themselves inside the Solar Circle [ – Inner Clusters (IC)], and outside this region [ – Outer Clusters (OC)], we find that the dimensionality of the OC sample is unambiguously one, the first eigenvector accounting for of the sample variance, while IC data-points are less clustered along their first eigenvector, which still represent a of the IC sample variance. So there is a marginal evidence that the clusters that are expected to be less affected by dynamical evolution (i.e. OC ones, see [MH97], [BVFF] and [V97]) define the best mono-variate correlations in S-space .
In the following analysis PCCs will be permanently excluded from the sample, and the presented results refer only to KMCs.
2.1 Relations between manifolds in S-space
Simple geometrical considerations show that the eventual FSL defined by KMC, belongs, whithin the errors, to the GCFP. Roughly speaking, the two correlations (vs. log) and (logvs. ) are nearly-edge-on view of the GCFP, while the (logvs. log) correlation is a nearly-face-on view of the same Plane. The main result of the present section is that the surface of the GCFP is not uniformly populated by KMC (the large majority of galactic globulars): the clusters are confined in a rather dispersed but well defined band which represents the correlation between log of the core radii and log of velocity dipersions.
A similar result, regarding the half-light parameters (see [DM94] for definitions), has been very recently suggested by Burstein et al. (1997). They claim that the GC half-light parameters manifold has been reduced to a straight line by selective disruption mechanisms(see [Gnedin & Ostriker 1997], and [Murali & Weinberg 1997]), which depleted those clusters whose radii lie out of a narrow “permitted” range. I will show below that this explanation is unlikely to be the right one in the S-space considered here.
In the present work I did not include half-light parameter in the analysis for a number of reasons, the main one being that I am mainly interested in discriminating between ”evolutionary” vs. ”initial condition” origin for the observed correlations. The bulk of the GC evolution takes place in their core - they are the gravitational engines driving the life of the whole system (see [Spitzer 1987]) - so core parameters are expected to be more sensitive indexes of the dynamical status of the clusters themselves.
3 At the root of S-space correlations
In the following sections I attempt a deep analysis of all the detected S-space correlations, either bi-variate (FP) or mono-variate (FSL), with particular attention to the limitations in our understanding of the underlying physics that can be imposed by the parametrization currently used, i.e. the observables. Finally I show that a very simple structural condition of KMCs provides a simultaneous explanation of all the FSL correlations.
First of all, I want to draw attention to the uncertainties in the observables. The internal errors of the data in the KM sample are between and for and to for log, as specified by [TDK93]whose catalogue is at the origin of the [D93] compilation. logis the most critical quantity: while the typical uncertainty is of the order – , relative errors equal or higher than are not rare, so logerrors can amount to or more.
Even so, statistical uncertainties are not necessarily the major source of concern for the present purposes. In fact:
-
•
measures have been obtained with very different methods: either from individual radial velocities of cluster members or from the Doppler broadening of an integrated light spectrum. The data have very heterogeneous sources and “…no attempt (was made) to remove zero-point differences between the different sets of radial velocities…” ([Pryor & Meylan 1993]). So some additional systematic uncertainty is indeed present in the data.
-
•
Regardless of the method adopted for measuring , the cluster distance, the degree of crowding and the instrumental set up of each observation impose some constraints upon the region of the cluster in which the measure is performed. Individual stellar velocity measures are often possible only outside of the badly crowded cores of many clusters. Integrated light spectra are not affected by this kind of problem, but it is readily evident that, for a fixed instrumental set-up, the contribution of light from outer cluster regions will increase with increasing cluster distance and will also depend on the cluster concentration (C). So, it is not at all guaranteed that each of the measures in the dataset refers to the same quantity and, in particular, to the quantity of interest, i.e. “average velocity dispersion in the core” ([D95]).
-
•
Heterogeneity of sources can significantly affect also the internal consistency of and values. These parameters are derived from radial brightness profiles obtained with very different methods, ranging from concentric aperture photometry to direct star counts. In some cases more than one method was used to track the profile of the same cluster in different radial regions. Though the datasets of [TDK93] and [D93] represent the result of an enormous effort and it is certainly the best result presently achievable in terms of homogeneity and completeness, some undetermined internal inconsistency should still be present, as clearly stated by the same authors.
Given the above considerations, it is somehow surprising that the correlations shown in fig. 1 are nevertheless observed. It should also be noted that the amount of variance introduced in the dataset by global “observational noise” can be significantly greater than estimated taking into account only formal uncertainties of each observable.
3.1 M/L ratio from GCFP correlations
Let me first consider GCFP correlations. The basic conditions necessary to the existence of the observed GCFP correlations are a) the obvious one that GC cores obey the Virial Theorem and b) that M/L ratio222Since all luminosity observables refers to V filter measures, the M/L ratio must be intended as - in solar units - all over this paper, the subscript V having been dropped for brevity be nearly constant (see [D95], [Ciotti 1997]). Using Virial Theorem, the mass of the cluster cores () can be estimated, according to the prescription adopted by [Burstein et al. 1997], with the formula:
| (1) |
where is a constant (here assumed to be equal to , according to [Burstein et al. 1997]) and G is the universal Gravitational constant. Converting to suitable units and in logarithmic form:
| (2) |
with in solar masses, in Km/s-1 and in pc.
The same quantity can be obtained from and , once assumed a fixed M/L ratio, from ([DM94]), where and is a constant (here assumed to be equal to 1; see, for instance [DM94]), through the equation:
| (3) |
that, transformed as above gives:
| (4) |
Eliminating between (1) and (3), (that is imposing that the “dynamical core mass” be equal to the “luminous core mass”) it is found:
| (5) |
or, in another form:
| (6) |
The coefficients of equations (5) and (6), as expected, are in excellent agreement with those of the fits to observed GCFP correlations ([D95]). I have obtained the GCFP relations in a parametric form, with log (M/L) as a parameter, from the simple equality between luminous mass and dynamical mass. However, there is one more implicit assumption, i.e. structural and kinematical homology of GCs ([Ciotti 1997]; see also [D95] for a simple explanation referred to GCs). Some effect of non-homology should necessarily be present since , for instance, density profiles of globulars are observed to differ from one another by more than a simple scale factor ([D95], see also [Spitzer 1987], p. 16), so slight differences in the constant are expected. This condition alone has to produce also cluster-to-cluster differences in the value ([Ciotti 1997]). The very existence of the GCFP demonstrates that non-homology is not a major concern in our case, nevertheless it surely contributes to the dispersion of data-points about the Fundamental Plane (and about FSL too).

Two different edge-on views of the GCFP (the same presented by [D95]) are shown in fig. 2, with the lines corresponding to equations (5) and (6), for different values of the M/L parameter, superimposed to the plot. The line which provide the apparent best fit to the distribution of the data-points corresponds to in both the considered planes . Though in reasonable accord with current (model dependent) estimates (, Pryor & Meylan 1993; see also [Chernoff & Weinberg 1990] for theoretical estimates) this estimate is probably not correct, the zero-point of equations (5) and (6) being affected by many relevant uncertainties. For instance, the assumed value can be significantly different from its true average value; an underestimation of by a factor lead to an underestimation of the M/L ratio by a factor of .
What, on the other hand, is much more robust is the estimate of the spread in M/L: a factor can be viewed as a strong upper limit. Considering the many sources of statistical and systematic error that can contribute to the observed dispersion, one is induced to argue that the real spread is lower (perhaps much lower), and indeed the 1- dispersion is a factor . However the thickness of the GCFP is comparable to that of the Fundamental Plane of Elliptical Galaxies (FPEG). At any given mass the 1- spread of data-points around the GCFP, as measured by the parameter (which measures log M/L; see [Burstein et al. 1997] and references therein), is (see [Ciotti 1997], and references therein for comparisons with FPEG).
Summarizing the results of the above analysis, I have obtained:
-
1.
an estimate of the spread in M/L between clusters;
- 2.
3.2 A unique interpretation for FSL correlations
A natural interpretation for the correlation between and logis that the core luminosity (and core mass, once is assumed) is nearly constant. Such an explanation has been proposed by Djorgovski (1991, 1993b), and it is widely discussed in [DM94].
Equations (2) and (4) can be used independently to express this condition. Self-consistency between the two can be imposed assuming , as shown above. Solving equation (2) with respect to logand equation (4) with respect to the following relations are found:
| (7) |
and
| (8) |
Combining the two equations, a relation between and logcan also be found:
| (9) |
Just using the hypothesis that (and M/L fixed), I have obtained three mono-variate parametric relations between the S-space observables, with log as a parameter.
In fig. 3 the lines corresponding to equations (8) (left panel), (7) (central panel), and (9) (right panel), with different values of the log parameter, are superimposed to the respective FSL correlations. It is immediately evident that the sole (quite broad) condition that be constant within two orders of magnitude is sufficient to impose all the observed correlations.
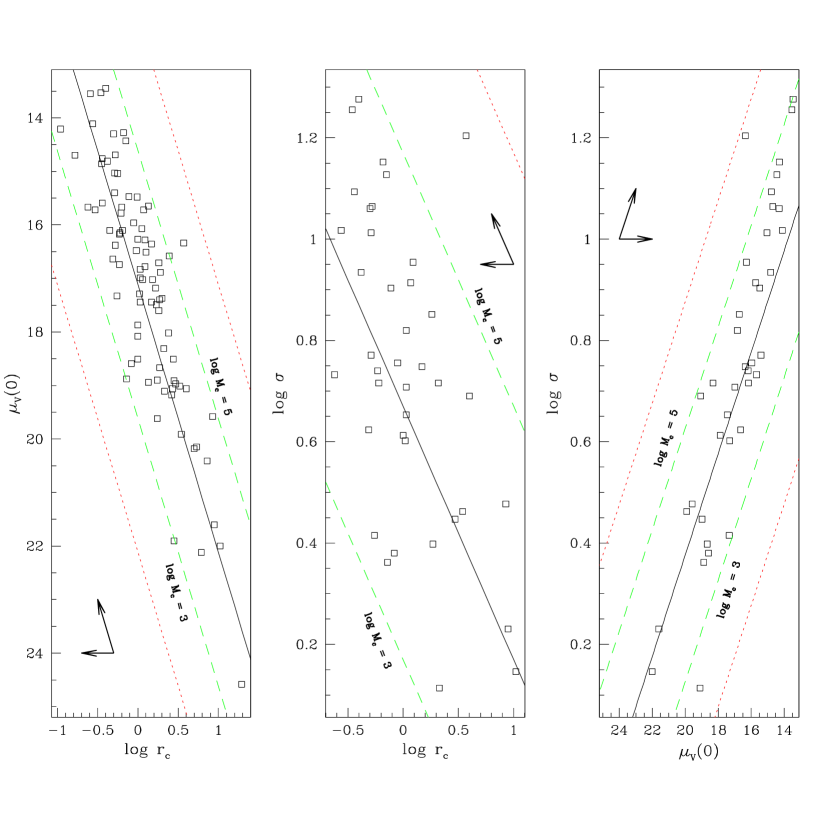
While the actual values of log may suffer from the same uncertainties discussed above for M/L, they can be considered at least indicative. The dotted lines in each panel of fig. 3 represent the conditions log and log , i.e. they approximately confine the region in which globulars are allowed to exist, as King Model clusters. The upper limit roughly correspond to the very strong condition that core mass of a cluster cannot be higher than its total mass, the lower limit is connected whith the decreasing of core mass occurring during the evolution of globulars toward core collapse (Spitzer 1987, [Chernoff & Weinberg 1990], [MH97]). It can be assumed that below a certain threshold of , here arbitrarily assumed to be , the core collapse of the system has already happened.
It is interesting to imagine a hypothetical researcher measuring S-space parameters for a system of - say - 10000 KM globular clusters with nearly constant M/L ratio and with core masses ranging from to . When plotted into the (– log) and (log– ) planes, all of the measured points would be confined between the quoted dotted lines and our imaginary astronomer would be forced to conclude that a strong (though significantly dispersed) correlation is present in both planes; the interpretation of the (– log) correlation would represent a considerable challenge. It would be not be so readily evident that he is observing a mere condition of existence!
Such a tricky situation is due to the following main reasons:
-
1.
The thickness of the (– log) and (log– ) correlation is constrained , in the studied case, by the very existence of the GCFP, i.e. by the condition Whithout this additional constraint the relative constancy of would not be sufficient to settle the observed correlations.
-
2.
The definition of photometric magnitude artificially expand the scale of the axes by a factor 2.5 that is (obviously) missing in the other S-space parameters.
These are also the reasons why the condition encompasses a much broader region into the plane (log– log), which is unaffected by the above constraints.
3.2.1 Physical constraints into the S-space
Now I can shortly turn again to the relations between S-space manifolds, considering the FSL as a true manifold. Though its statistical significance is not rigorously defined, the fact that data-points are distributed along a fat straight line is undoubtely observed. This means that two independent physical constraints are driving the characteristics of the dataset:
-
1.
The most powerful constraint is the constancy of the M/L ratio between globulars within a factor of few. This condition alone (but see the discussion in sec. 3.1) define the GCFP which is a much more statistically significant structure with respect to FSL.
-
2.
Whithin the GCFP, globulars are constrained to lie within a strip corresponding to the constancy of within a factor of . This condition is significantly weaker than that regarding M/L, however each of the mono-variate correlations of fig. 3 would be much more dispersed than what presently observed, if a wider range of were allowed.
4 A deeper insight into the FSL correlations
As said, the position is at the base of the standard interpretation of the (log– ) correlation ([DM94] and references therein). On the other hand a) I am not aware of any discussion of the correlation between logand log(but this is the less significant one and regards only KMCs) and b) the proposed interpretations for the (– log) are different from that presented here ([DM94]). In this section I will shortly comment on point b and add few considerations regarding the effects of the dynamical evolution of globular clusters on the S-space correlations.
4.1 vs. log
[DM94] attempt to interpret the correlation between total luminosity (L) and velocity dispersion claiming that in a primordial phase of GC evolution, dominated by adiabatic mass loss due to stellar evolution, the quantities and were adiabatic invariants ( where M, R and are the characteristic mass, radius and velocity dispersion af the clusters - see also [Djorgovski 1991], and [Djorgovski 1993b]). These conditions should have settled the scaling law : [DM94] invoke differential effects in subsequent evolution as responsible of changing the slope of this relation to the presently observed value, i.e. (see Vesperini 1994 for a critical discussion). Turning to surface brightness, assuming the constancy of and (plus ), the scale relation is derived, similar to the observed one ( including PCC in the sample; [DM94]).
The interpretation proposed here stems, on the other hand, only from two assumptions: and . Both of them have natural empirical support from the GCFP and (log– ) correlations respectively. Furthermore the predicted scale law give a good match with the observed slope of the relation ( from a sample composed solely of KM clusters). I will show below that tiny differences between the observed and predicted slopes can be easily explained with simple arguments well rooted in the standard theory of dynamical evolution of globular clusters.
Since the standard interpretation of the scale law ([DM94]) is strictly coupled with that of the relation, the new explanation of the former cast some doubt on the whole framework proposed by [DM94] for these correlations.
Finally, the proposed scenario allows a considerable economy of hypothesis, showing that the same interpretation succesfully explains three correlations.
4.2 Evolutionary effects
It is widely accepted that dynamical evolution should in general stretch the range of properties of a globular clusters system ([DM94], [MH97] and references therein). So, the first conclusion we can draw inspecting fig. 3 with an “evolutionary perspective” is that the range of covered by Galactic globulars at an early time was narrower than today’s and - consequently - the FSL correlations were surely more significant and stronger in the past333The marginal evidence that the less evolved clusters (OC) are less dispersed around the FSL with respect to more evolved ones (IC, see sec. 2) provide some independent support to this view. This suggests that significant primordial cosmic scatter in just one of the S-space parameters can be at the origin of the range covered by the other two. For instance, assuming and , a range of would immediately produce corresponding ranges of and via relations similar to equations (7) and (8).
Except for episodic phenomena (as disk and bulge shocks or encounters with giant molecular clouds; see [BVFF]) the general trend of the dynamical evolution of globular clusters can be crudely resumed as “ shrinking toward more and more concentrated configurations till the onset of the core collapse” ([MH97], Spitzer 1997). During core contraction, core density (and, consequently, surface brightness) and velocity dispersion increase. Furthermore, it is firmly established that the progressive shrinking is accompanied by continuous decrease of the core mass ([Chernoff & Weinberg 1990], [Cohn 1980], [MH97]).
Based on these simple prescriptions it is possible to find how GCs are expected to move – driven by evolution – in the planes of fig. 3. In each of the three panels a couple of arrows enclose (within the acute angle between them) the possible directions of the evolution vector (EV), i.e. the possible lines along which clusters can move in the plane due to the general evolutionary trend described above.
First of all, it should be noted that, given the likely directions of EVs in each plane, the effect of dynamical evolution on the FSL correlations is not expected to be dramatic. This is particulary true for the (log– ) correlation. In this plane a theoretical estimate of the EV is available: ([Cohn 1980]), corresponding to , i.e. not far from parallel to the line in the considered plane (see also [DM94]).
To attempt further interpretation of possible evolutionary effects it must be recalled that significant correlations occur between total mass (tracked by ) and both and ([DM94]) in the sense that brighter cores and/or higher velocity dispersion are generally associated with more massive clusters.
So, if any (marginal) trend is present within the region of each plane of fig. 3, it appears as follows: the distribution of the points is, in average, farther from the line for cluster with lower total mass. This would be in rough accord with theoretical expectations, since less massive clusters are predicted to evolve faster toward core collapse due to two-body relaxation ([Spitzer 1987]; see also [V97], fig. 5).
5 Summary and Conclusions
The distribution of the Galactic KMCs into the S-space is very similar to a straight line lying onto the Fundamental Plane of Globular Clusters. I have shown that the simple assumptions (supported by observations) and provide a simultaneous explanation for all the three mono-variate correlations present in the data (and also for GCFP correlations). In particular this provides a new and more satisfactory interpretation of the correlation between and log.
Some interesting by-products have also been obtained: a) the thickness of the GCFP and of FPEG at any mass are very similar; b) the range of M/L covered by GCs is constrained to be significantly less than an order of magnitude with a fully model-independent procedure; c) the current definition of observables, coupled with a strong constraint, create a condition in which even if the range of GC would encompass 4 order of magnitude, we would still observe some significant correlation in the planes (log– ) and (– log).
In my opinion, the most far reaching conclusion of the present analysis is that globulars were distributed along a Fundametal Straight Line in S-space at early times. This conclusion provides a very useful constraint for models of globular cluster formation, i.e. globulars were born with nearly the same core mass (or rapidly settled to this status), within a range that was probably much narrower than the one presently observed. Present knowledge of the formation of globular clusters is rather poor (see [Fall & Rees 1985], [Vietri & Pesce 1995], [Harris & Pudritz 1994], [MH97]) and any observational constraint on initial conditions of this system has to be considered very valuable.
George Djorgovski is warmly thanked for having introduced me to the mysteries of Principal Component Analysis. I am indebted to Paolo Montegriffo, Enrico Vesperini, Stefano Sandrelli and Flavio Fusi Pecci for many useful discussions.
Very special thanks are owed to Luca Ciotti for many insightful discussions and a critical reading of draft versions of the manuscript.
Mrs Paola Ballanti is warmly thanked for her professional expertise in english language.
References
- [BVFF] Bellazzini, M., Vesperini, E., Fusi Pecci, F., Ferraro, F.R., 1996, MNRAS, 279, 337 (BVFF)
- [Burstein et al. 1997] Burstein, D., Bender, R., Faber, S.M., Nolthenius, R., 1997, AJ, 114, 1365
- [Chernoff & Weinberg 1990] Chernoff, D., Weinberg, M., 1990, ApJ, 351, 121
- [Cohn 1980] Cohn, H., 1980, ApJ, 242, 765
- [Ciotti 1997] Ciotti, L., 1997, in Galaxy Scaling Relations, 3rd ESO-VLT Workshop, in press, (astro-ph/9612136)
- [Davies et al. (1987)] Davies, R.L., Burstein, D., Dressler, A., Faber, S.M., Lynden-Bell, D., Terlevich, R.J., Wegner, G., 1987, ApJS, 64, 581
- [Djorgovski 1991] Djorgovski, S.G., 1991, in Formation and Evolution of Star Clusters, K. Janes ed., ASP Conf. Series, 13, 112
- [D93] Djorgovski, S.G., 1993a, in Structure and Dynamics of Globular Clusters, S.G. Djorgovski and G. Meylan Eds., ASP Conf. Series, 50, 373 (D93)
- [Djorgovski 1993b] Djorgovski, S.G., 1993b, in The Globular Cluster – Galaxy Connection, G. Smith and J. Brodie eds., ASP Conf. Series, 48, 496
- [D95] Djorgovski, S.G., 1995, ApJ, 438, L29 (D95)
- [Djorgovski & Davis 1987] Djorgovski, S.G., Davis, M., 1987, ApJ, 313,59
- [DM94] Djorgovski, S.G., Meylan, G., 1994, AJ, 108, 1292 (DM94)
- [Fall & Rees 1985] Fall, S.M., Rees, M.J., 1985, ApJ, 298, 18
- [Gnedin & Ostriker 1997] Gnedin, O.Y., Ostriker, J.P., 1997, ApJ, 474, 223
- [Harris & Pudritz 1994] Harris, W.E., Pudritz, R.E., 1994, ApJ, 429, 177
- [King 1966] King, I.R., 1966, AJ, 71, 64
- [Mateo 1996] Mateo, M., 1996, in Formation of the Galactic Halo … Inside and Out, H. Morrison and A. Sarajedini eds., ASP Conf. Series, 92, 434
- [Meylan 1987] Meylan, G., 1987, A&A, 184, 144
- [MH97] Meylan, G., Heggie, D.C., 1997, A&A Rev., 8, 1 (MH97)
- [Murali & Weinberg 1997] Murali, C., Weinberg, M., 1997, MNRAS, 288, 749
- [Murtagh & Heck 1987] Murtagh, F., Heck, A., 1987, Multivariate Data Analisis, Dordrecht, Reidel
- [Pryor & Meylan 1993] Pryor, C., Meylan, G., 1993, in Structure and Dynamics of Globular Clusters, S.G. Djorgovski and G. Meylan Eds., ASP Conf. Series, 50, 357
- [Schaeffer et al. 1993] Schaeffer, R., Maurogordato, S., Cappi, A., Bernardeau, F., 1993, MNRAS, 263, L21
- [Spitzer 1987] Spitzer, L., 1987, Dynamical Evolution of Globular Clusters, Princeton Un. Press, Princeton (NJ)
- [TDK93] Trager, S., Djorgovski, S.G., King, I.R., 1993, in Structure and Dynamics of Globular Clusters, S.G. Djorgovski and G. Meylan Eds., ASP Conf. Series, 50, 347 (TDK93)
- [Vesperini 1994] Vesperini, E., 1994, Ph. D. Thesis, Scuola Normale Superiore di Pisa, Pisa, Italy
- [V97] Vesperini, E., 1997, MNRAS, 287, 915 (V97)
- [Vietri & Pesce 1995] Vietri, M., Pesce, E., 1995, ApJ, 442, 618
- [White & Shawl 1987] White, S.D.M., Shawl, S.J., 1987, ApJ, 317, 246
- [Whitmore 1984] Whitmore, B.C., 1984, ApJ, 278, 61