The Redshift Distribution of Distant Sources from Gravitational Depletion in Clusters
Abstract
Gravitational lensing can be used to analyze the redshift distribution of faint galaxies. In particular the magnification bias modifies locally the galaxy number density of lensed sources observed in lensing clusters. This depletion area probes the redshift distribution of galaxies beyond . In this proceedings I present this new tool to infer the redhsift distribution of faint galaxies.
Institut d’Astrophysique de Paris and Observatoire de Paris DEMIRM, France.
1. Introduction
With the coming of 10 meter
class telescopes equipped with wide field multi-object
spectrographs, deep redshift surveys will be extended to thousands of galaxies
and will permit
to explore in detail the evolution of clustering of galaxies,
the history of star formation up to for galaxies with .
The study of galaxies with magnitudes are also important
for the models of galaxy formation :
we do not know yet whether they are all at large
redshift or if there is a significant fraction of faint nearby dwarfs
galaxies. The knowledge of their redshift distribution is
also necessary for mass reconstruction
using lensing inversion, and can
be a major source of uncertainty in the mass
determination for the most distant lensing clusters
(see Luppino & Kaiser 1997). Bernardeau et al (1997) and Jain &
Seljak (1997) have
emphasized that even the
study the large-scale mass distribution using
weak lensing need the redshift distribution of
the faintest galaxies, because the variance and the skewness of the
magnification strongly depends of the redshift of the lensed background
sources.
Unfortunately, beyond , even 10 meter class telescopes are unable to provide redshifts of a complete sample of galaxies. The possibility of using photometric redshifts which was proposed by the beginning of eighties is now re-investigated in great details. But observations as well as reliability tests are still underway (Connolly et al. 1995. Since they are based on theoretical evolution scenarios of galaxies, their predictions about faintest galaxies are not fully confirmed yet. Furthermore, there is no hope to calibrate the photometric redshifts of the faint samples with spectroscopic data.
An attractive alternative to spectroscopy consists in using of the magnification and distortion effects induced by gravitational lensing on extended objects. In particular, the magnification bias can eventually produces depletion areas in the projected galaxy number density of background sources observed in rich clusters whose size and shape depend on their redshift distribution. In the following section I present the basic principle of the technique and first results.
2. The distribution of faint galaxies from the magnification bias
The projected number density of galaxies through a lensing cluster at radial distance from the cluster center and with magnitude lower than , , results from the competition between the gravitational magnification that increases the detection of individual objects and the deviation of light beam that increases the area and thus decreases the apparent number density. Therefore the amplitude of the magnification bias depends on the slope of the galaxy counts, , as a function of magnitude and on the magnification factor of the lens (Broadhurst et al. 1995):
| (1) |
where is the magnification factor of the lens, the intrinsic number density in a nearby empty field and is the intrinsic count slope:
| (2) |
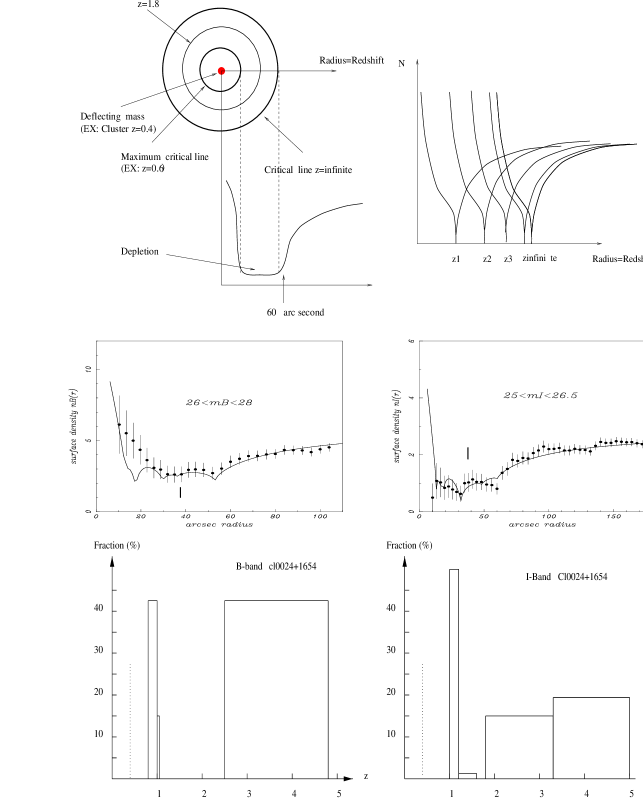
when the slope is higher than the number density increases, whereas below is decreases and the radial distribution shows a typical depletion curve (see Figure 1).
When the slope is lower than , a sharp decrease of the number of galaxies is expected close to the critical radius of the lens corresponding to the redshift of the background sources. For a broad redshift distribution, it can result a shallower depletion between the smallest and the largest critical line which depends on the redshift distribution of the galaxies (Figure 1). Therefore, the analysis of the shape of the depletion curves provide a new way to sort out their redshift distribution. As the lensing inversion, this is a statistical method which can also infer redshift of very faint sources (up to ) but does not need anymore information on the shapes of arclets. However, the need of a good lens modeling is still necessary.
This method was first used by Fort et al (1997) in the cluster Cl0024+1654 to study the faint distant galaxies population in the extreme range of magnitude and . For these selected bins of magnitude they found on their CFHT blank fields that the counts slope was near 0.2, well suited for the study of the effect. After analysis of the shape of the depletion curve (figure 4), of the -selected galaxies were found between and while most of the remaining galaxies appears to be broadly distributed around a redshift of . The selected population present a similar distribution with two maxima, but spread up to a larger redshift range with about 20% above (Figure 1).
This first tentative must be pursued on many lensing clusters in order to provide significant results on the redshift distribution of the faintest distant galaxies. Though it is a very promising approach, it also need to be applied on clusters with simple geometry. Furthermore, the detection procedure demands ultra-deep exposures with subarcsecond seeing.
3. Conclusions
The redshift distribution of galaxies beyond is a crucial
scientific question for galaxy evolution and weak lensing studies for
mass reconstruction.
The depletion curves of galaxy number density produced by
magnification bias is an innovative way which can probe
the redshift distribution of galaxies as faint
as . The first tentative by Fort et al (1997)
demonstrates that depletion curves can be observed in Cl0024+1654 and
A370. However, a good modeling of the lensing clusters is needed in
order to infer the redshift distribution of the lensed sources. This
method is still at its infancy and the first results
are questionable. Hence, it
must be considered jointly with other techniques like
photometric redshifts or lensing inversion (Kneib et al 1994, 1996).
Whatever
the method, how can we be sure that these redshifts obtained
from non-standard and indirect techniques are
correct ?
Preliminary deep spectroscopic and
multicolor photometric surveys of
arclets show that the faintest galaxies seem to have a redshift
distribution like the ones predicted by Fort et al (Pelló, private
communication). But this
key issue demands ultra-deep CCD spectroscopic exposures with
the VLTs. This should be in the future a major challenge
for the gravitational telescopes.
Acknowledgments
I thank F. Bernardeau, B. Fort, R. Ellis, R. Pelló, P. Schneider and L. Van Waerbeke for stimulating discussions. This work was supported by the Programme National de Cosmologie.
References
F. Bernardeau, L. van Waerbeke, Y. Mellier, 1997, A&A 322, 1.
T. J. Broadhurst, A. N. Taylor, J. Peacock, 1995, ApJ 438, 49.
A. Connolly, I. Csabai, A. S. Szalay, D. C. Koo, R. G. Kron, J. A. Munn 1995, AJ 110, 2655.
B. Fort, Y. Mellier, M. Dantel-Fort 1997, A&A 321, 353.
B. Jain, U. Seljak 1997, ApJ 484, 560.
J.-P. Kneib, G. Mathez, B. Fort, Y. Mellier, G. Soucail, P.-Y. Longaretti 1994, A&A 286, 701.
J.-P. Kneib, R. S. Ellis, I. Smail, W. J. Couch, R. M. Sharples 1996, ApJ 471, 643.
G. Luppino, N. Kaiser 1997, ApJ 475, 20.