RXTE Observation of the X-ray burster 1E1724-3045
Abstract
We report on the Rossi X-ray Timing Explorer Proportional Counter Array (PCA) observation of the X-ray burster 1E1724–3045 located in the globular cluster Terzan 2. The observation lasted for about 100 kiloseconds and spanned from November 4th to 8th, 1996. The PCA source count rate in the 2-20 keV range was about 470 cts/s. No large spectral variations were observed within our observation as inferred from color-color and hardness-intensity diagram analysis. The persistent X-ray emission shows a high level of noise variability, the so-called High Frequency Noise (HFN) with a fractional Root Mean Squared (RMS) of 25% in the Hz range. The strong HFN together with the hardness of its X-ray spectrum suggest that 1E1724–3045 is an “Atoll” source which was in its “Island” state during the observation. The Fourier Power Density Spectra (PDS) can be modeled in terms of the sum of two “shot noise” components for which the shots have a single-side exponential shape (i.e. instantaneous rise and exponential decay). The characteristic shot decay timescales inferred from the best fitting of the PDS are and 16 msec respectively. The two components contribute similarly to the total RMS ( 15%). The PDS contains also a third component: a broad and asymmetric peaked noise feature centered at 0.8 Hz. This Quasi Periodic Oscillation-like (QPO) feature contributes at the level of 10% to the total RMS. Neither the shot timescales nor the QPO frequency vary with energy. On the other hand, the integrated RMS of all three components shows a positive correlation with energy up to at least 40 keV. In addition, in the 2–20 keV energy band where the signal to noise ratio is the highest, we found evidence for a high frequency component which shows up in the PDS above 100 Hz. In terms of the shot noise model, a Lorentzian fit of this last component implies a shot decay timescale of ms.
We also show that 1E1724–3045 has striking timing similarities with the black hole candidate GRO J0422+32 (Nova Persei 1992). Our observation demonstrates that a low frequency QPO simultaneously with a high level of RMS is not a timing signature unique to black holes. This extends the growing list of similarities between Atoll sources and black hole systems.
1 Introduction
An X-ray burst from a region including the globular cluster Terzan 2 was first observed by OSO-8 Swank et al. (1977). A weak persistent X-ray source was also found by OSO-8, and Grindlay Grindlay (1978) showed that both the position of this source and a revised position of the Uhuru source 4U1722-30 Forman et al. (1978) were consistent with that of the cluster. Later Grindlay et al. Grindlay et al. (1980) using the EINSTEIN HRI instrument positioned the X-ray burst source inside the core of Terzan 2. Its name then became 1E1724–3045. Basically reliable spectral observations (EXOSAT and TTM) show that the source has a rather hard power law spectrum (photon index around 2) in the 1-20 keV range with an X-ray flux ranging from 3 to ergs s-1 cm-2. There is also an indication from EINSTEIN data that at higher flux level ( ergs s-1 cm-2, i.e. in its high state), the X-ray spectrum softens and is better described by a Bremsstrahlung model with a temperature of keV Barret et al. (1998).
Estimates of the cluster distance range from 5.2 to 7.7 kpc Ortolani et al. (1997). These values are consistent with the one derived from a type I X-ray burst that showed photospheric expansion Grindlay et al. (1980); Tanaka (1981). Adopting 7 kpc, the 1-20 keV low state luminosity of the source lies around ergs s-1 indicating that 1E1724–3045 belongs to the class of low luminosity systems.
As for the timing properties of the persistent X-ray emission of the source, very little is known. However, during an EXOSAT observation performed with the medium energy (ME) experiment, a QPO at 0.092 Hz was found (pulsed fraction %, Full Width Half Maximum of Hz). In addition low-frequency noise and the second harmonic were observed Belli et al. (1986). Note however that the presence of the QPOs reported in the IAU circular was not confirmed in a proceedings paper by the same authors Belli et al. (1985).
Besides its X-ray properties, 1E1724–3045 is remarkable by the fact that it is a source of persistent, though variable, hard X-ray emission ( keV) as observed with SIGMA Barret et al. (1991); Goldwurm et al. (1993). 1E1724–3045 is in fact the first, and one of the only X-ray bursters (i.e. weakly magnetized neutron star) showing such a persistent emission with a spectrum extending up to keV Vargas et al. (1996); Tavani and Barret (1997).
We proposed 1E1724–3045 as a target for a Rossi X-ray Timing Explorer observation for two main reasons: First we wanted to characterize the rapid variability of the source in order to check whether, as expected, 1E1724–3045 is an Atoll source. Second we wished to detail the continuum energy spectrum simultaneously from X-rays to hard X-rays.
The main focus of this paper is the study of the rapid variability of the source in the frequency range to a few tens of Hz. The search for high frequency QPOs (above Hz) will appear elsewhere. Similarly the spectral analysis of the combined PCA and HEXTE data is the subject of a forthcoming paper Barret et al. (1998). The present paper is organized as follows: In section 2, we present the correlated temporal and spectral analysis using light curves, color-color and hardness-intensity diagrams. In section 3, we present the results of the rapid variability study, including the detailed modeling of the PDS. In section 4, we discuss on the possible origins of the fast timing variability of the source, emphasize the similarities between black hole and neutron star systems, and address the issue about the nature of the low frequency QPO observed.
2 Light curves, color-color and hardness intensity diagrams
2.1 The PCA observation
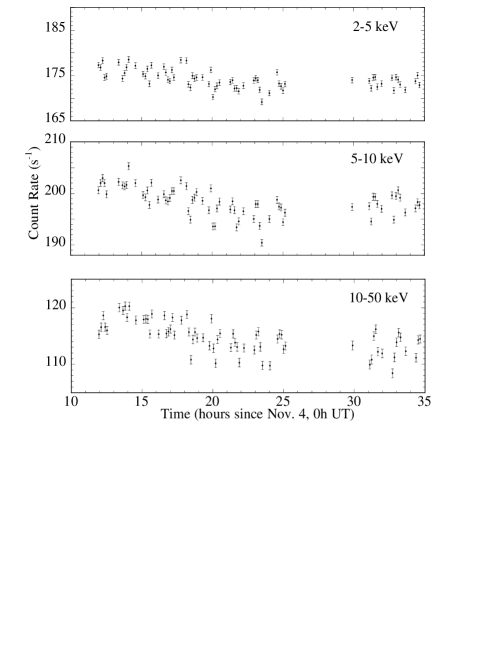
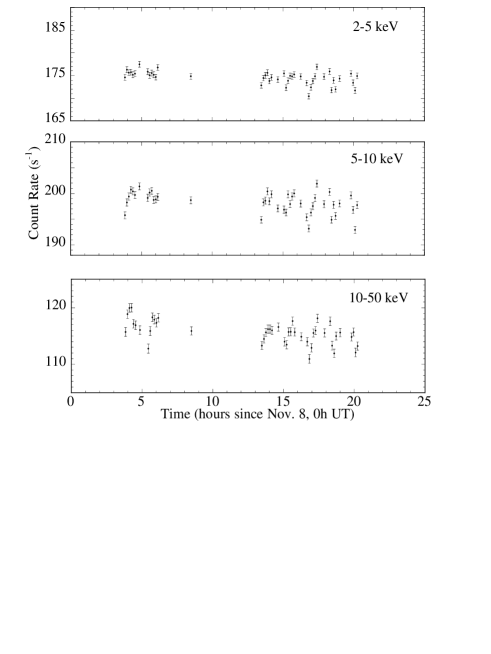
The RXTE observation took place between November, 4th and 8th, 1996 for a total exposure time of about 100 kiloseconds. The good data filtered for elevation greater than 10 degrees (as recommended) can be split in two parts; the first covers from November 4th at 11:54:08 (UT) to November 5th at 10:51:44 (UT) and the second from November 8th at 00:30:24 (UT) to 23:35:44 (UT).
The Proportional Counter Array consists of 5 nearly identical large area proportional counter units (PCU 0 to 4) corresponding to a total collecting area of cm2 Jahoda et al. (1996). For safety reasons, PCUs are switched on and off in the course of an observation; mostly PCUs 3 and 4. As all the PCUs have different energy responses, the absence of a single one can simulate spectral variations in color-color and hardness-intensity diagrams. Therefore to avoid this, in this section we consider only data recorded when the five PCU units are all working; this corresponds to a net exposure time of kiloseconds (elevation greater than 10∘). There is also an X-ray burst in the middle of the observation; the analysis of which will be reported elsewhere. Data recorded around this burst are not included here (3 orbits of good data are not considered in the present analysis).
We use the standard 2 data to build light curves, color-color and hardness-intensity diagrams. For the rapid variability, we use the 16 s Science Event data provided in 64 energy channels covering the entire PCA energy range. Significant flux from the source is detected up to keV (see Fig. 4).
2.2 Light curves, color-color and hardness-intensity diagrams
We have first generated background subtracted light curves for the entire observation taking the latest versions of the background models provided at the RXTE Guest Observer Facilities (GOF) 111We use the release 1.5 of pcabackest.. The light curves of 1E1724–3045 in the energy bands 2–5, 5–10 and 10–50 keV are shown in Fig. 1 for a binning time of 512 seconds.
As can be seen no large temporal variations were observed during the observation. However during the first part, its intensity slowly decreased in all three energy bands. The mean background subtracted count rate is cts s-1 which corresponds to about 40 mCrab in the 2-50 keV band222We assume that the Crab produces 2600 cts s-1 per PCU Jahoda et al. (1996).
Following Hasinger and Van der Klis Hasinger and Van Der Klis (1989) we have generated color-color diagrams using three energy bands: 2-5, 5-10, and 10-50 keV. The color-color diagram computed for a binning time of 128 seconds is shown in Fig. 2. The position of the source in the diagram indicates a rather hard spectrum. The clustering of points in the diagram indicates that the source spectrum did not change significantly during the observation.

Although the source count rate does not differ by more than 10% along the observation, we have computed two hardness-intensity diagrams, again for a binning time of 128 seconds (see Fig 3). There is a weak correlation between both the soft and hard colours and the count rate. The source moves erratically within the defined regions. Given the spectral resolution of the PCA, these variations are hardly detectable with standard spectral analysis of the continuum spectrum.


2.3 PCA Energy spectrum
From the previous analysis, one can conclude that the source showed little spectral and intensity variations along the entire observation on timescales of hundreds of seconds. We have made a PCA spectrum for a segment of the observation using the latest versions of the calibration matrices available at the GOF333Version 2.31 of pcarsp was used.. The spectrum of the source is rather hard, and within the calibration uncertainties at low energies (below 3 keV), can be adequately fitted with a power law of index ( on 1 parameter, see Fig. 4). The best fit corresponds to an unabsorbed 1-20 keV flux ergs s-1 cm-2 consistent with the flux seen by EINSTEIN during a possible high state of the source. However, there are no doubts that the PCA spectrum is harder than the Thermal Bremsstrahlung (TB) spectrum that may have been observed with EINSTEIN (in particular the 6 keV TB fit is ruled out). The PCA spectrum resembles more the power law spectra previously observed by EXOSAT and TTM in a so-called “low state”. A more detailed spectral analysis including better background subtraction (which may be an important issue for 1E1724–3045 given its location in the Galactic center region), and combination of the HEXTE data is the subject of a separate paper Barret et al. (1998).


3 Power Density Spectra (PDS)
On timescales ranging from milliseconds to seconds, the source displays intense flickering. This is illustrated in Fig 5 where we show a segment of the observation with two binning times of 0.0122 and 0.1 sec.
In order to investigate the rapid variability of the source on such timescales, we made PDS in the frequency range Hz in different energy bands. Each continuous set of good data (lasting 2000 sec.) was divided into segments of bins of second duration. A Fast Fourier Transform algorithm was used to convert each data segment into frequency space. The final power spectrum of one segment was obtained by taking the ensemble average over all segments. The power spectra were subsequently normalized to fractional RMS densities according to Belloni and Hasinger Belloni and Hasinger (1990a). For white noise substraction we have used the expected value of 2.0 for poissonian noise. By looking at PDS at frequencies above 700 Hz, the value observed does not differ by more than 0.1% of the nominal value, indicating that deadtime corrections are negligible in our case. Afterwards, all power spectra were rebinned logarithmically in order to increase the statistical weight of individual frequency bins. Typical PDS spectra are shown in figure 6 for two energy bands: 2-5 and 5-20 keV.
3.1 Modelling of the PDS
The shape of the PDS at low frequencies suggests that the source displays the so-called High Frequency Noise or Low-State Noise Van der Klis (1995). In this case the PDS can be described by a Lorentzian centered on zero frequency, as given in the following formula:
| (1) |


This PDS is produced if the noise is made up of a superposition of finite events (shots) whose characteristic duration () is related to the half width half maximum () of the Lorentzian (). We thus decided to fit the low frequency part of the spectrum with a Lorentzian444We are performing the fitting of the power density spectra with XSPEC. For that purpose, we just made fake arf and rmf files with unity diagonals and zero elsewhere. pha files contain the PDS multiplied by the width of the frequency bins. This has the advantage of using the efficient interface of XSPEC for the definition of the models, the robustness of the fitting routines, and the user friendly graphic interface. In addition we have found quite convenient to add our own models.. The Lorentzian provides a good fit to the low frequency part of the spectrum, in particular much better than a broken power law. The frequency above which the PDS steepens is around Hz. This means that above seconds there are no more time correlated variations in the X-ray light curve of 1E1724–3045.
It is clear that above Hz, the shape of the PDS is complex due to the presence of a broad feature around 0.8 Hz. Regardless of the shape of this feature, it was apparent that there was an enhancement “(shoulder)” above 5-6 Hz in the PDS. As a first approximation, we have attempted to fit this component of the PDS with a second Lorentzian. It turns out that it also provides a good fit to the data up to 40 Hz as can be seen in Figure 10 (excluding the region between 0.3 and 4 Hz). The results of the fit are listed in Table 1.
| E range | ||||
|---|---|---|---|---|
| (keV) | (%) | |||
| 02-05 | ||||
| 05-10 | ||||
| 10-20 | ||||
| 20-50 | ||||
| 02-20 |
We would like to point out that other models could fit our data as well. The Lorentzian fit as used in this work accounts for single-side exponential shots. However, we could have also used models where the shots are symetric (e.g. exponential rise and decay with the same timescale), in which case the PDS should have the shape of the square of a Lorentzian. In this case, the PDS can be approximated at high frequencies by a steep power law of index –4. We are not able to distinguish between these two models because they mainly differ at high frequencies. Unfortunately in our data, the high frequency parts of the Lorentzians are not well resolved, due to the superposition of these components in the PDS. Regardless of the model assumed, it is clear that the timescales inferred for the variability will not differ by a large factor.
We have also tried to fit the PDS with a model accounting for a continuous time distribution of exponential shot durations . If between two extreme values ( and ) then the PDS is white below , falls with a -1 slope down and with a -2 slope beyond. This model can be approximated with the following function Shibazaki and Lamb (1987):
| (2) |

This model was succesfully applied by Belloni and Hasinger Belloni and Hasinger (1990b) to the EXOSAT observations of Cyg X-1. Exluding the 0.3-4.0 Hz range, we fitted the previous model to our data for comparison with the two lorentzian model. The fit is not as good: the reduced is 2.3 compared to 0.7 (80 d.o.f. including a systematic error of 5%). As shown in Fig. 7, above Hz, the fit is systematically above the data points. Furthermore the model does not account very well for the two shoulders observed at 0.1 and above 5-6 Hz. To conclude, if the shot durations follow a continous distribution, this function must be more complex than a simple power law.
In the framework of the two Lorentzian model, the residuals (see Fig. 10) cannot be described by any simple models (gaussian, etc..). In particular the addition of a third zero-centered Lorentzian to account for the residuals worsens the fit as it disturbs the parameters of the Lorentzian fitting of the low frequency part of the PDS. Clearly the way the PDS continuum is fitted affects the shape and amplitude of the residuals. However because of its peaked shape, by the following, we will call this feature a QPO. A more complete modeling of the PDS, with the help of simulations and shot profile studies will be the subject of a forthcoming paper Olive et al. (1998).
The main parameters of the broad QPO feature are: its frequency at Hz and its total width of Hz. These two parameters are energy independent and stable within the entire observation.
We noticed that in all PDS there is systematically a narrow and sharp feature in the residuals around 0.15 Hz (e.g. Fig. 10). On the other hand we haven’t found evidence for the unconfirmed 0.09 Hz narrow QPO previously reported from the EXOSAT-ME observation Belli et al. (1986).
The PDS made in different energy bands are all consistent in shape with each other. For instance the values and are constant and independent of the energy as shown in Table 1. Interestingly, the RMS of the three components shows a positive correlation with energy as illustrated in Fig 8.

3.2 Evidence for millisecond variability in 1E1724–3045?
In the 2-20 keV energy band which maximizes the signal to noise ratio we made a PDS extending up to 400 Hz (i.e the binning time of the light curve is now 1.2 milliseconds). Above 40 Hz, in excess of the two Lorentzian fit described above, we found a new component (see Fig. 10 later). We again tried to fit this high frequency component with a third Lorentzian. If this model is correct, and if interpreted in the framework of the shot noise model, the fit implies a shot decay time of 1.4 ms. The RMS of this third component is %. As can be seen the inferred shot timescale is very close to the bin time of the light curve. We have checked through simulations that this component is not an artefact of the binning of light curve.
4 Discussion
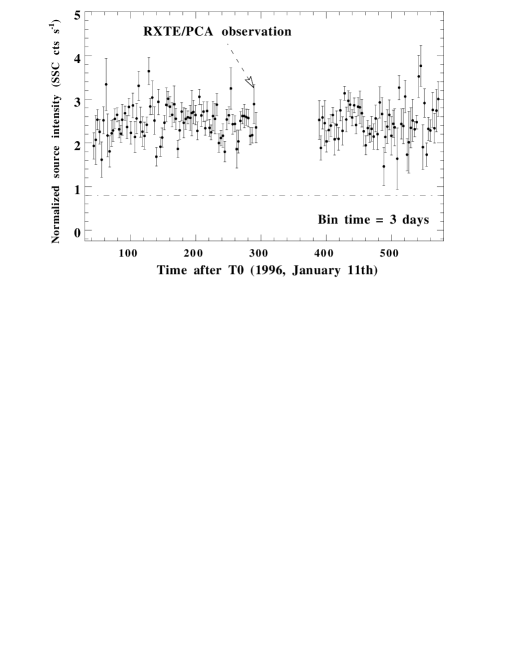
1E1724–3045 was observed with RXTE in a hard state for which the X-ray spectrum is a hard power law and the PDS shows the so-called “High Frequency Noise”. According to Hasinger and Van der Klis Hasinger and Van Der Klis (1989), 1E1724–3045 was observed in its “Island state”, and remained in this state throughout the entire observation. 1E1724–3045 is a persistent X-ray source as illustrated in Fig. 9 where we show its RXTE-All Sky Monitor light curve. The mean ASM count rate corresponds to a flux of mCrab in the 2-12 keV range fully consistent with the PCA count rate. This figure suggests that 1E1724–3045 spends a very large fraction of its time in the “Island” state with a hard X-ray power law spectrum whose extrapolation in hard X-rays ( keV) can account for the averaged flux observed by SIGMA Barret et al. (1998). The low variability of the source on long timescales (days to months) obviously agrees with the fact that 1E1724–3045 is also a persistent source of hard X-ray emission, as inferred from SIGMA observations spanning over 6 years Goldwurm et al. (1993); Vargas et al. (1996).
4.1 Origin of the shots ?
Up to 40 Hz (and excluding the 0.3-4 Hz region), we found that the sum of two Lorentzians was a possible fit of the PDS continuum. In the framework of the shot noise model, this first suggests that the light curve of the source is made of a superposition of randomly time distributed shots of two different timescales ( msec and msec). Obviously, these two shot durations are too large to be related to dynamical Keplerian timescales around the neutron star. Comparing the competing timescales in standard Sakura-Sunyaev accretion disks, Miyamoto et al. Miyamoto et al. (1992) have suggested that shot durations less than 1 second could be related to the time needed for the matter to flow through an X-ray emitting region of the accretion disk where most of the energy is gravitationally released. This viscous timescale is very sensitive to the disk model used and the value of the viscosity parameter assumed, and might not be appropriate to 1E1724–3045 for which it is known that standard -disk cannot account for the observed energy spectra. Nevertheless, in this picture the X-ray shots would arise from inhomogeneities approaching the inner disk region. These inhomogeneities whose origin is unknown would then be split into rings of matter which would cause shots of duration equal to the drift time of the matter within the inner disk region. One prediction of that model is that as the shot progresses and gets closer to the central object, its spectrum should harden, at least in the case of a black hole Miyamoto et al. (1992). Given the statistical quality of our data, it might be possible to select and superpose the best time resolved and strongest shots and follow their spectral evolution with time. This model could also be pushed to explain the 1.4 ms shots that we observed. On the other hand, for those shots, their duration is also consistent with the Keplerian timescales at the inner disk radius, or even at the neutron star surface. However, explaining the shot duration with either timescales makes difficult to understand the aperiodic nature of the signal.
4.2 Timing similarities between black hole and neutron star systems
In addition, the PDS contains a broad QPO-like feature centered at 0.8 Hz. Low-frequency QPOs have been reported so far from at least two X-ray bursters; 4U1608-522 Yoshida et al. (1993) and the somewhat peculiar Cir X-1 Shirey et al. (1996). 4U1608-522 was observed by GINGA in a low intensity state in three observations during which the source displayed very intense flickering. The shape of its PDS is similar to the one shown in Fig. 10. Yoshida et al. Yoshida et al. (1993) modeled somewhat differently the PDS using a sum of a broken power law, and up to three Lorentzians; one of which accounting for the low-frequency QPO, another for a high frequency component above Hz (similar to the second shoulder in Fig. 10). They also found a correlation between the flat top power level and the break frequency; the so-called “Belloni-Hasinger” effect discovered from the black hole candidate Cyg X-1 Belloni and Hasinger (1990b). In addition as the source intensity increased, the source remaining in a low state, the energy spectrum hardened and the QPO feature as well as the high frequency component moved to higher frequencies (from 0.4 to 2 Hz for the QPO). For Cir X-1, the same behaviour is observed and the QPO frequency varies within the orbital cycle from to 12 Hz Shirey et al. (1996). Unfortunately for us, 1E1724–3045 was observed by RXTE in a single spectral/intensity state, and the PDS remained very stable in shape throughout all the observation; so we are unable to test the presence of such a correlation in our data.


Atoll sources in their “Island” states have striking similarities with black hole candidates both in their spectral and timing properties. In this state, “Atoll” sources emit hard X-ray tails, e.g. 4U1608-522 Zhang et al. (1996). The similarities are even more pronounced for the timing properties. There was already the convincing example of 4U1608-522 and Cyg X-1 Yoshida et al. (1993); Van der Klis (1995) which both show the same PDS shape and high level of RMS (%) in their low X-ray states. The comparison of our PCA data for 1E1724–3045 with those recorded by OSSE from GRO J0422+32 Grove et al. (1993) provides another spectacular example of such similarities (see Fig. 11). GRO J0422+32 is an X-ray transient which was in outburst in 1992 Paciesas et al. (1992) during which the OSSE hard X-ray (35-150 keV) observations were performed. GRO J0422+32 is considered as a black hole candidate with a more likely mass for the compact object in the range 2.5-5 Casares et al. (1995). Although taken at higher energies, the PDS and the QPO feature seen in GRO J0422+32 are strikingly similar in shape to the one we observed from 1E1724–3045. The only difference between the two PDS are the shot timescales inferred from the fitting. For GRO J0422+32 the shot timescales are respectively 50 msec and 2.2 seconds while the broad QPO feature is centered at 0.2 Hz. It is interesting to note that there is about a factor of for , -1 between 1E1724–3045 and GRO J0422+32.
Low frequency QPOs have been observed from several other black hole candidates; of the most convincing detections we find GX339-4 (0.77 Hz) Grebenev et al. (1991), LMC X-1 (0.08 Hz) Ebisawa et al. (1989), Cyg X-1 (0.04 Hz) Angelini et al. (1992). Note that for the few cases we have so far, it seems that QPO frequencies from neutron star systems ( Hz) seem on average to be larger than those seen in black hole systems. It is unlikely though that the QPO frequency is directly correlated to the mass of the compact object (the larger the mass, the slower the QPOs), as in this case, we would expect it to be comparable for all neutron star systems, and constant within a given system. As said above, this is not the case neither for 4U1608-522 nor for Cir X-1 Yoshida et al. (1993); Shirey et al. (1996).
4.3 Possible common origin for the low frequency QPOs in black holes and neutron stars?
The HFN with a high level of RMS on to which a low frequency QPO is superimposed thus emerges as a similarity between black hole and neutron star systems, suggesting that similar mechanisms are involved independently of the nature of the compact object. The origin of these QPOs is still unclear. It is clear however that they cannot be related to Keplerian motions as the associated radius ( km) is much larger than the radius of the region where the X-rays are emitted ( 300 km). Given the short shot durations inferred from our analysis, it appears unlikely that the QPO can result from the direct modulation of the shots. In addition the large RMS, and its positive correlation with energies implies that it originates from the region of main energy release (i.e close to the compact object). It is rather difficult to find a mechanism which could cause QPOs in that region. Depending on the viscosity parameters, disk luminosity oscillations around 1 Hz might result from thermal-viscous instabilities developing within the inner parts of the disk around a neutron star Chen and Taam (1994). These oscillations will exhibit quasi-periodic behaviour if the mass flow entering the inner disk region is not constant.
Independently of the mechanism producing the shots Vikhlinin et al. Vikhlinin et al. (1994) have suggested that the low frequency QPOs could result from a weak interaction between the shots when the instability develops in a region of stable energy supply. To keep the energy released constant on large timescales, the appearance of strong shots should affect the amplitude and/or the probability of occurrence of subsequent shots. In our case, this would mean that on average, one shot is followed about seconds later by a second shot.
4.4 Low frequency QPOs and the inner disk precession ?
Beside the two previous models which do not make any assumptions on the nature of the compact object, there is another one which involves a rapidly rotating weakly magnetized neutron star. This model has recently been proposed by Stella and Vietri Stella and Vietri (1998). The latter authors showed that the broad peaks (around tens of Hz) observed in the PDS of several Atoll sources (4U0614+091, MXB1728-34, and KS1731-260), all displaying twin kilo-Hz QPOs, could be due to the precession of the innermost disk region. So close to the neutron star, there are two precession frequencies to consider; one caused by the “frame dragging” effect Lense and Thirring (1918) (), and another one induced by the oblatness of a fastly rotating neutron star Kahn and Woltjer (1959) ().

The precession frequency is the sum of the two frequencies, in which generally dominates over . Both frequencies depend on the neutron star spin frequency () and the Keplerian frequency at the inner disk radius (). The latter quantities can be estimated if the observed twin kilo-Hz QPOs are interpreted with a magnetospheric beat frequency model Alpar and Shaham (1985). The neutron star parameters (mass, M=M0 and moment of inertia, I= I45) are two other, and more uncertain parameters which critically determine the range of precession frequencies. For neutron star models with stiff equation of states, I45/M0=2 and for M0 Cook et al. (1994); Friedman et al. (1986), the precession model recovers successfully the frequency of the peaks observed in all three sources (between 10 and 40 Hz) Stella and Vietri (1998). It is thus tempting to apply this model to our data, although the QPO from 1E1724–3045 is at a significantly lower frequency. Furthermore, in our case, we do not have yet a value for and 555Although not yet complete, our analysis has failed so far to reveal any significant high frequency QPOs above 300 Hz. The results of the complete analysis will appear elsewhere.. Yet, if one assumes M0 and I45, in the framework of the previous model, one can estimate the range of and which would match a QPO frequency of 0.8 Hz. This is shown in Fig. 12 for which we have computed and for plausible ranges of I45 such that I45 and M0 (1.4 M0) Cook et al. (1994); Friedman et al. (1986). This figure illustrates well the weak dependence of and against the neutron star mass, and the stronger dependence on I45/M0. However, none of the curves intersects with the region where and have been observed for the three sources listed above (900 , and 300 Hz). This might have something to do with the fact that we don’t see any obvious high frequency QPOs from this source.
5 Conclusions
Our RXTE/PCA observation enabled us to classify 1E1724–3045 as an “Atoll” source. It was observed in its “Island” state for which its X-ray energy spectrum is hard and the PDS displays high frequency noise with a high level of RMS ( 30%). The shape of the PDS is complex but can be decomposed in the framework of the shot noise model. In addition the PDS contains a QPO-like feature peaking at Hz. Similar PDS properties have already been observed from several black hole candidates, and in particular from GRO J0422+32 for which the similarities are striking. A complete timing analysis of the PCA data is in progress with the aim of studying the shot profiles, the origin of the QPO, the spectral evolution along the shots, time lags as a function of energy, etc… Olive et al. (1998). This illustrates well the wealth of the PCA data. Some very valuable information will also be provided by the HEXTE experiment which will for the first time enable us to study the hard power law tail and the aperiodic variability simultaneously from X-rays to hard X-rays.
Acknowledgements.
We wish to thank Drs Keith Jahoda and Charles Day of the RXTE Guest Observer Facility for their valuable help in the course of the analysis. We are very grateful to J.E. Grove for providing us with Figures 11. This research has made use of data obtained through the High Energy Astrophysics Science Archive Research Center Online Service, provided by the NASA-Goddard Space Flight Center. The RXTE/ASM light curve of 1E1724–3045 was downloaded from the Web site http://space.mit.edu/XTE/ASM-lc.html at Massachussets Institute of Technology. The authors are grateful to S.N. Zhang for helpful discussions.We also thank the referee, Dr. G. Hasinger, for his careful and helpful review of the paper.
References
- Alpar and Shaham (1985) Alpar, M. A. and Shaham, J., 1985, Nat, 316, 239
- Angelini et al. (1992) Angelini, L., White, N. E., and Stella, L., 1992, IAU Circ., 5580
- Barret et al. (1991) Barret, D., Mereghetti, S., Roques, J. P., Mandrou, P., Salotti, L., Lebrun, F., Laurent, P., Ballet, J., Churazov, E., Gifanov, M., Sunyaev, R., Khavenson, N., Chulkov, I., Novikov, B., Kuznetzov, A., and Dyachkov, A., 1991, ApJ, 379, L21
- Barret et al. (1998) Barret, D., Olive, J., Boirin, L., Grindlay, J., Swank, J., and Smale, A., 1998, A&A, in preparation
- Belli et al. (1985) Belli, B. M., Dantona, F., Molteni, D., and Morini, M., 1985, in Recent Results on Cataclysmic Variables (SEE N86-20287 10-93), p 263
- Belli et al. (1986) Belli, B. M., D’Antona, F., Molteni, D., and Morini, M., 1986, IAU Circ., 4174
- Belloni and Hasinger (1990a) Belloni, T. and Hasinger, G., 1990a, A&A, 230, 103
- Belloni and Hasinger (1990b) Belloni, T. and Hasinger, G., 1990b, A&A, 227, L33
- Casares et al. (1995) Casares, J., Martin, A. C., Charles, P. A., Martin, E. L., Rebolo, R., Harlaftis, E. T., and Castro-Tirado, A. J., 1995, MNRAS, 276, L35
- Chen and Taam (1994) Chen, X. and Taam, R. E., 1994, ApJ, 431, 732
- Cook et al. (1994) Cook, G. B., Shapiro, S. L., and Teukolsky, S. A., 1994, ApJ, 424, 823
- Ebisawa et al. (1989) Ebisawa, K., Mitsuda, K., and Inoue, H., 1989, PASJ, 41, 519
- Forman et al. (1978) Forman, W., Jones, C., Cominsky, L., Julien, P., Murray, S., Peters, G., Tananbaum, H., and Giacconi, R., 1978, ApJS, 38, 357
- Friedman et al. (1986) Friedman, J. L., Parker, L., and Ipser, J. R., 1986, ApJ, 304, 115
- Goldwurm et al. (1993) Goldwurm, A., Cordier, B., Paul, J., Petruci, P., Roques, J., Mandrou, P., Bouchet, L., Vedrenne, G., Sunyaev, R., Churazov, E., Gilfanov, M., Dyachkov, A., Khavenson, N., Kovtunenko, V., Kremnev, R., and Sukhanov, K., 1993, in N. Fichtel, C.and Gherels and J. Norris (eds.), The Second Compton Symposium, AIP No. 304, p. 421, American Institute of Physics
- Grebenev et al. (1991) Grebenev, S. A., Sunyaev, R. A., Pavlinskii, M. N., and Dekhanov, I. A., 1991, SvA, L17, 985
- Grindlay (1978) Grindlay, J. E., 1978, ApJ, 224, L107
- Grindlay et al. (1980) Grindlay, J. E., Marshall, H. L., Hertz, P., Weisskopf, M. C., Elsner, R. F., Ghosh, P., Darbro, W., Sutherland, P. G., and Soltan, A., 1980, ApJ, 240, L121
- Grove et al. (1993) Grove, J., Johnson, W., Kinzer, L., Kroeger, R., Kurfess, J., Strickman, M., Grabelsky, D., Matz, S., Purcell, W., Ulmer, M., and Jung, G. V., 1993, in C. Fichtel, N. Gherels, and J. Norris (eds.), The Second Compton Symposium, AIP No. 304, p. 192
- Hasinger and Van Der Klis (1989) Hasinger, G. and Van Der Klis, M., 1989, A&A, 225, 79
- Jahoda et al. (1996) Jahoda, K., Swank, J., Giles, A., Stark, M., Strohmayer, T., Zhang, W., and Morgan, E., 1996, Proceedings of SPIE, 2808, 59
- Kahn and Woltjer (1959) Kahn, F. and Woltjer, L., 1959, ApJ, 130, 705
- Lense and Thirring (1918) Lense, J. and Thirring, H., 1918, Physik, Z., 19, 156
- Miyamoto et al. (1992) Miyamoto, S., Kitamoto, S., Iga, S., Negoro, H., and Terada, K., 1992, ApJ, 391, L21
- Olive et al. (1998) Olive, J., Barret, D., Boirin, L., Grindlay, J., Swank, J., and Smale, A., 1998, A&A, in preparation
- Ortolani et al. (1997) Ortolani, S., Bica, E., and Barbuy, B., 1997, A&A, 326, 620
- Paciesas et al. (1992) Paciesas, W. S., Briggs, M. S., Harmon, B. A., Wilson, R. B., and Finger, M. H., 1992, IAU Circ., 5580
- Shibazaki and Lamb (1987) Shibazaki, N. and Lamb, F. K., 1987, ApJ, 318, 767
- Shirey et al. (1996) Shirey, R. E., Bradt, H. V., Levine, A. M., and Morgan, E. H., 1996, ApJ, 469, L21
- Stella and Vietri (1998) Stella, L. and Vietri, M., 1998, ApJ, 492, L59
- Swank et al. (1977) Swank, J. H., Becker, R. H., Boldt, E. A., Holt, S. S., Pravdo, S. H., and Serlemitsos, P. J., 1977, ApJ, 212, L73
- Tanaka (1981) Tanaka, Y., 1981, in D. Helfang and J. Huang (eds.), The Origin and Evolution of Neutron Stars, IAU Symposium No 125, p. 161
- Tavani and Barret (1997) Tavani, M. and Barret, D., 1997, in C. Dermer, M. Strickman, and J. Kurfess (eds.), The Fourth Compton Symposium, AIP No. 410, p. 75
- Van der Klis (1995) Van der Klis, M., 1995, in W. H. G. Lewin, J. Van Paradijs, and E. P. J. Van Den Heuvel (eds.), X-Ray Binaries, 26, p. 252, Cambridge University Press
- Vargas et al. (1996) Vargas, M., Paul, J., Goldwurm, A., P., L., Jourdain, E., Roques, J. P., Borrel, V., Bouchet, L., Sunyaev, R., Churazov, E., Gilfanov, M., Dyachkov, A., Khavenson, N., K., S., and N., K., 1996, in Proceedings of the 2nd INTEGRAL Workshop, ESA SP-382, p. 129
- Vikhlinin et al. (1994) Vikhlinin, A., Churazov, E., and Gilfanov, M., 1994, A&A, 287, 73
- Yoshida et al. (1993) Yoshida, K., Mitsuda, K., Ebisawa, K., Ueda, Y., Fujimoto, R., Yaqoob, T., and Done, C., 1993, PASJ, 45, 605
- Zhang et al. (1996) Zhang, S. N., Harmon, B. A., Paciesas, W. S., Fishman, G. J., Grindlay, J. E., Barret, D., Tavani, M., Kaaret, P., Bloser, P., Ford, E., and Titarchuk, L., 1996, A&AS, 120, 279