A kinematical analysis of NGC 2992. ††thanks: Based on data obtained at the European Southern Observatory, La Silla, Chile
Abstract
We present long slit spectroscopy for the [OIII] and H wavelength ranges along nine different position angles for the Sa Seyfert 1.9 galaxy NGC 2992. Double profiles are present in several regions, suggesting that the gas is not simply following galaxy rotation. A simple kinematical model, which takes into account circular rotation together with a constant radial outflow, seems to be a good approximation to account for the observed kinematics.
Key Words.:
galaxies: active - galaxies: individual: NGC 2992 - galaxies: kinematics and dynamics - galaxies: Seyfert - galaxies: spiral1 Introduction
Disturbed morphologies of ionized nebulosities surrounding active galactic nuclei are frequently observed, mainly in high ionization gas. The morphology is usually interpreted in terms of a conical or biconical shape centered on the nucleus. The spectacular ionizing cone discovered in NGC 5252 by Tadhunter & Tsvetanov (1989) is thought to arise from interstellar matter lit up by radiation from the nuclear non stellar continuum escaping the central regions through the hole of an obscuring torus surrounding the nucleus. The situation is far less clear in the other reported cases where the cone may be seen only on one side of the nucleus or has less marked edges (cf Wilson & Tsvetanov 1994 for a review). The possibility of having outflows or inflows in cones centered on the nucleus has been invoked to account for the kinematical properties of several Seyferts (e.g. Wilson et al. 1985), but kinematics have been studied in detail only in a few of the Seyferts which show evidence for galactic outflows.
In this paper we present new results on the kinematics of the ionized gas in the highly inclined (=70∘) Sa Seyfert galaxy NGC 2992, crossed by a disturbed dust lane oriented along the major axis (=15∘, RC3 catalogue). This edge-on galaxy is connected by a tidal tail to a close companion, NGC 2993, at a projected distance of 2.9 arcmin (35.5 kpc for H0=50 km s-1 Mpc-1) and with a 109 km s-1 velocity difference (see RC3 catalog), which may well have important perturbing effects on its dynamics. Combined optical broad and narrow band images reveal a complex structure (Durret & Bergeron 1987, Wehrle & Morris 1988). The [OIII] and H images show an arc of emission southeast of the nucleus (which could be interpreted as HII regions in the spiral arm) as well as a finger of emission emerging from the northwest portion of the nucleus, pointing northward. At 20cm radio wavelength, NGC 2992 reveals a radio source of total extent 25 arcsec and major axis PA, with a one–sided extension along PA (Ward et al, 1980; Hummel et al., 1983). At smaller scale an 8-shaped structure, with the nucleus at the crossing-point, is visible at 6cm along PA=160∘ and interpreted as limb-brightened bubbles or magnetic arches (Ulvestad & Wilson 1984; Wehrle & Morris 1988). A comparison of the line emission images with the radio images shows no correlation.
Colina et al. (1987) have mapped NGC 2992 by using long slit spectroscopy roughly along the major axis and the two axes given by the high resolution radio map by Ulvestad & Wilson (1984). From their kinematical data in the [OIII] lines, they observe blue asymmetric profiles only in the very center of the galaxy. They find that the nuclear and off-nuclear regions are dynamically decoupled, and suggest that there are non-circular motions due to radial flows and tidal interaction with NGC 2993. They interpret their data as being consistent with a radial outflow of gas in a plane which is not coaligned with the galactic plane, rather than outflow within a cone. On the contrary, Tsvetanov et al. (1995) describe NGC 2992 as a good candidate for having large-scale minor axis outflows with velocities up to 200 km s-1.
Since NGC 2992 is a highly inclined object, it is a good candidate to sample gas motions out of the disk plane. In the following, we present a first order kinematic model of the ionized gas in NGC 2992, based on a set of long slit spectra.
2 The data
| Observing | PA/offset | Exp. | Wavelength | Seeing |
|---|---|---|---|---|
| date | time (s) | range (nm) | (”) | |
| 12/3/88 | 17/0 | 2700 | 625–725 | 1.2 |
| ” | 100/0 | 3600 | ” | ” |
| ” | 150/0 | 2700 | ” | ” |
| ” | 58/0 | 3600 | ” | ” |
| 13/3/91 | 122/0 | 7200 | 405–600 | 1.5 |
| ” | 30/0 | 3600 | ” | ” |
| 14/3/91 | 122/0 | 600 | ” | 1.1 |
| 122/4.6NE | 7200 | ” | ” | |
| 30/0 | 3600 | ” | ” | |
| 15/3/91 | 122/0 | 600 | ” | 1.8 |
| 122/6.8NE | 7200 | ” | ” | |
| 80/0 | 7200 | ” | ” | |
| 16/3/91 | 122/0 | 600 | 568–746 | 1.5 |
| 122/4.6NE | 3600 | ” | ” | |
| 17/3/91 | 58/0 | 3600 | 407–601 | 1.3 |
| 150/0 | 3600 | ” | ” | |
| 100/0 | 3600 | ” | ” |
Long-slit spectroscopy was obtained during two runs with the ESO 2.2m telescope in 1988 and with the ESO 1.52m telescope in 1991 using a Boller & Chivens spectrograph. Details on the observations are given in Table 1. For the 1988 run, the CCD used was #8, with a pixel size of 15 m, corresponding to 0.9 arcsec on the sky; the grating was #26 (dispersion 59.5 Å/mm), giving a spectral resolution of 1.9 Å. For the 1991 run, the CCD used was #13, with a pixel size of 15 m, corresponding to 0.68 arcsec on the sky; grating #23 was used (dispersion of 129 Å/mm), giving a spectral resolution of 4.8 Å. The slit width was 2 arcsec for both runs. Wavelength calibration lamps (He-Ar) were taken just before or just after each exposure.
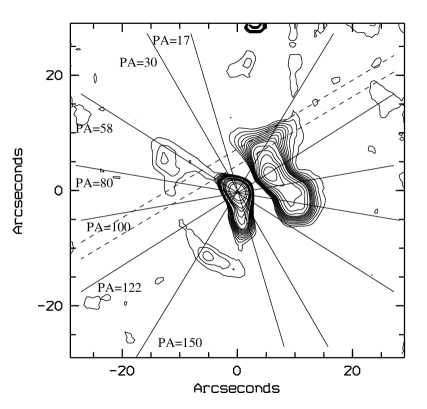
A map of the [OIII] narrow band image from Durret & Bergeron (1987), with the slit positions superimposed, is displayed in Fig. 1. The exact positions of the slits on this image are derived assuming that they were centered on the maximum of the broad band emission, and by aligning our broad band images with the [OIII] image using two stars on the frames. Previously to any offsetting of the slit, a short exposure on the nucleus with the same position angle was performed, to allow the determination of the offset slit position.


The data reduction was performed, following the standard procedures for de-biasing, flat-fielding and calibrating the spectra, with the IHAP and MIDAS softwares for the 1988 and 1991 runs respectively.
The accuracy of the wavelength calibration was checked by measuring the position of the strong sky lines along each spectrum; the dispersion of the sky line wavelengths are always within the error bars of the calibration with the arc spectra. It is only for the [OIII] spectra along PA=122/0 that we found a shift of 54 km s-1, which was applied to the final data for this PA. Typical wavelength calibration errors give velocity uncertainties of 20 and 60 km s-1 for the 1988 and 1991 runs respectively.
Since the illumination of the slit in the considered spatial region is uniform, a 2D-sky could be determined by averaging two strips on either side off the galaxy and subtracted to the galaxy spectrum.
The ionized gas velocity field along each slit is obtained by applying a cross-correlation method (Tonry & Davis 1979) to the emission lines by using a program developed by J. Perea within the FIGARO software; this allows to calculate relative velocities with respect to a reference cross-section chosen to have a high signal to noise ratio. The redshift corresponding to this cross-section is measured by fitting gaussian profiles to the different emission lines. We checked that the cross sections corresponding to the nucleus on the various slits had the same velocity within the error bars. The systemic velocity deduced is 2330 km s-1, in agreement with the stellar value measured by Nelson & Whittle (1995). Since the cross-correlation method takes into account all the emission features available in a given wavelength range, the velocities obtained are weighted averages, and are therefore more representative of those of the strongest lines, and/or strongest component in a line. Thus, as velocities in the H-[OIII] range are dominated by [OIII], the high ionization component, we made an attempt to derive [OIII] and H velocities separately. Unfortunately, H is only bright enough close to the nucleus. We therefore decided to derive the velocity field in [OIII] on one hand (hereafter the high excitation domain), and in H-[NII] on the other (low excitation domain). In any case, these are not peak velocities. We plot the [OIII] (squares) and H (triangles) velocities in Figs. 2-3-4.
The use of cross-correlation methods gives smaller uncertainties for the relative velocity distributions than the typical wavelength calibration errors. This can be seen in Figs. 2-3-4, where the error bars correspond only to the velocity accuracy with respect to the reference cross section. Therefore, realistic error bars are somewhat larger.
Along PA=122∘ offset by 7 arcsec to the northeast (Fig. 3h), the signal to noise was not sufficient and the cross–correlation method could not be used. So we binned spatially the data over a few cross sections and fitted gaussians to the line profiles to estimate velocities.
Since the H and H domains were not observed simultaneously and the nights were not photometric, it is not possible to draw excitation maps.
Notice that since the velocities derived from the cross correlation are not peak velocities, the presence of various components in a single line or different line shapes due to dust contamination (producing asymmetric emission lines) can produce artificial kinematical shifts (see below).
3 The kinematical properties
Figures 2-3-4 show the velocity fields observed for a total of 14 long slit spectra in the [OIII] and H wavelength ranges along nine different PAs. The velocities are given relatively to the systemic velocity and plotted as a function of distance to the nucleus for slits crossing the nucleus. For offset slits, the zero value in abscissa corresponds to the minimum distance to the nucleus. The velocities plotted in Figs. 2-3-4 reveal a rather complex velocity field which obviously cannot simply be due to rotation of a disc with a major axis 15∘ (the photometric major axis, RC3). Notice that our data are in very good agreement with those of Heckman et al. (1981) along PA=120∘ and of Keel (1996) along PA=16∘.
Notice also that the high and low excitation gases do not always have the same velocity structure.

3.1 Line profiles
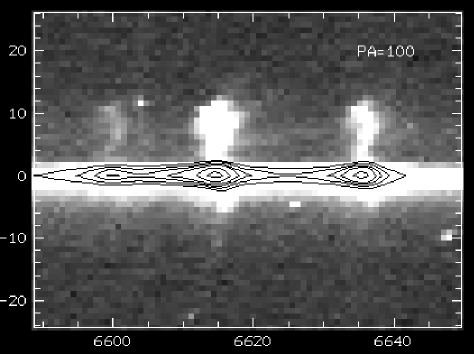
The complexity of the velocity field is illustrated in two 2D plots of the high resolution spectra (Figs. 5 and 6). A blue asymmetry of the lines is detected in the central 3 arcsec (see Figs. 5 and 6), as already noted by Colina et al. (1987). On the west side, the velocity dispersion can be seen to be very large e.g. along PA=100∘ (see Fig. 5) giving a “mushroom” shaped spectrum with a typical FWHM of 300 km s-1.
Although in the [OIII] image almost no emission is seen to the north and east of the nucleus out to 5 arcsec, this is probably due to an oversubtraction of the continuum. However, weak emission is detected in our spectra (see for example Figs. 5 and 6).
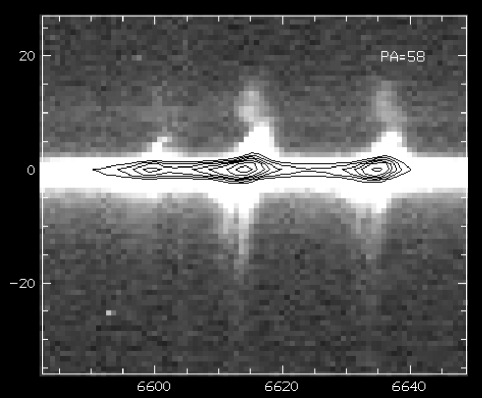
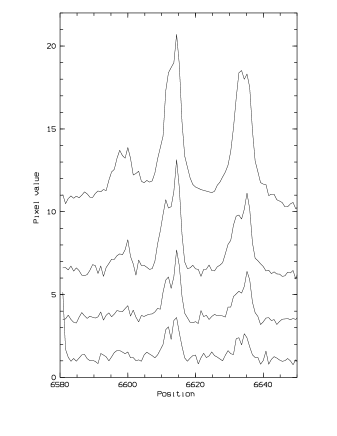
The high spectral resolution H+[NII] data reveal the existence of double peaked profiles in the east quadrant, along PA=17∘ in the south, PA=58∘ in the northeast and PA=150∘ in the southeast. These regions extend over 10 arcsec. The most striking example is given Fig. 6 along PA=58∘. In order to estimate the velocities of these two components, we performed a synthesis analysis using multiple gaussian fitting along this PA; the respective typical FWHMs of the two components are 90 and 250 km s-1 on the northeast side, at a distance of about 5 arcsec from the nucleus. Both components (estimated at about 5 arcsec from the nucleus) are blueshifted by km s-1 and km s-1 with respect to the systemic velocity. Examples of one-dimensional spectra are shown in Fig. 7. Along PA=150∘ and at 5 arcsec from the nucleus, the two components are redshifted by 135 and 30 km s-1. The fact that line splitting is observed only for the low excitation gas does not mean that the gas producing such features is less ionized, but may merely be due to the lower spectral resolution of our [OIII] data.
Such line splitting probably represents radial motions (outflow or inflow) of the gas in the NLR, a rather common feature of extended high excitation gas in Seyferts (see Christopoulou et al., 1997; Lindblad et al. 1996; Morris et al., 1985; Storchi-Bergmann et al., 1992; Wilson et al., 1985). In fact, the morphology of the emission region is reminiscent of a cone (Fig. 1, and Fig. 4 in Wehrle & Morris, 1988) although the possibility that the arc is a ring or spiral structure around the nucleus cannot be discarded.
3.2 Velocity field
In order to disentangle overall rotation from peculiar motion, we first apply a simple galactic rotation model. The gas is considered in circular motion and lies in a disc with an inclination and a position of the major axis (RC3).
The velocity law, which assumes that the gas is in a spherical gravitational potential and follows circular orbits in a plane (de Zeeuw & Lynden-Bell 1988) is given by the following equation:
where is the distance to the center in the plane of the galaxy, the maximum amplitude and the distance at which this velocity is reached; is a parameter controlling the slope of the rotation curve in its “flat” outer regions.
We assumed that the dynamical center coincides with the peak of the continuum light and constrained the above parameters using the velocity field observed along the photometric major axis, i.e. . The resulting rotation curve computation can be seen as a dashed line in Figs. 2-3-4. We tried different sets of parameters and obtain a fairly good match for =350 km s-1, =5 arcsec and =1.3. Indeed, as mentioned above, cannot be much different, since it is constrained by the shape of the rotation curve beyond 5 arcsec; could vary between 5 arcsec and 8 arcsec, and by no more than km s-1.
However it is apparent on Figs. 3g and 3h, that is not the best estimate for the kinematic major axis. Indeed, the parameters lead to velocity fields which are systematically shifted with respect to the measurements along PA=122∘ (Figs. 3g-h). Along PA=30∘ (Fig. 3e), the velocity field which becomes flat at distances over 5 arcsec is badly represented. The steep central gradient and the amplitude of flat rotation regions further out indeed suggest that the kinematical major axis of the ionized gas is larger than =17∘.
This value is strongly constrained by the PA=122∘ offset data (Figs. 3g-h), in order to shift the minimum model velocity to the centre, and can only vary between 25 and 30∘. The set of parameters is somewhat different in this case: =250 km s-1 and =1.1, the maximum velocity being reached at the same radius, =5 arcsec. The resulting rotation velocity field is plotted in Figs. 2-3-4 as a dotted line.
Better matches to the data in most of the slit positions are obviously obtained. The fact that the photometric major axis derived from the kinematics does not agree with that derived from broad band imaging suggests that the gas disk is in a different plane than the stellar disk (for instance because of a warping due to the interaction with NGC 2993) and/or that a radial component is present in addition to the galactic rotation. It is worth noticing that PA=30∘ is perpendicular to the PA=130∘ of the elongated radio structure as measured by Hummel et al. (1983) from VLA observations. This model accounts for most of the low excitation gas structure along non offset slits in the central few arcseconds (excepting PA=150∘); however, further from the nucleus, the low and high excitation gases do not always follow the same kinematics.
As discussed in Sect. 3.1, outflow of the gas within a conical envelope or on the surface of a hollow cone is a possible picture to account for the double peaks and blueshift. The morphology of the emitting gas (see the [OIII] image in Fig. 1 and Fig. 4 in Wehrle & Morris 1988) is suggestive of a cone structure along an axis at PA=120∘ and with a projected full opening angle of about 120∘. Notice that the cone axis is almost aligned with that of the elongated radio structure observed by Hummel et al. (1983) with the VLA, and its linear extent is comparable to that of the radio emission, namely 20 arcsec on the east side and 10 arcsec on the west side.
Although the line splitting is ignored when measuring the H lines, two components are clearly present in the low excitation gas along PA=58∘ and 150∘ (see Fig. 7 and Sect. 3.1). One can notice in Fig. 2c that +30 km s-1, the velocity of one component along PA150∘, is close to the velocity expected from a pure disk rotation (dashed curve). In Fig 2d, the value of -10 km s-1 is not far from the disk rotation velocity. It is thus clear that the plotted weighted mean velocities are dominated by outflow in the east. We have therefore used a very simple model in which the outflowing velocities are considered as radial motions in a plane very close to that of the gas disk. A more sophisticated modeling of a true cone, such as that of Wilson et al. (1985), Hjelm & Lindblad (1996a, 1996b) or Christopoulou et al. (1997) is not possible due to the lack of detailed information on the line splitting and of photometrical information.
We have considered that the west side of the galaxy is the near one; this would explain why the emission cone is seen mainly to the east. We add to the general rotation pattern described above a constant outflow, modeled along a triangular region of axis PA=120∘, with an opening angle of 120∘ and a constant velocity of 150 km s-1 along the outflow region (measured 5 arcsec from the nucleus). This is a simple addition of outflowing radial velocity in a region determined by the [OIII] image morphology and taking place in a plane very close to the gas disk. The projected size of the zone on which this region extends its influence is taken to be 9 arcsec and 4 arcsec in the east and west regions respectively; these values are strongly constrained by the high excitation gas data along PAs between 30∘ and 150∘ (centered and offcentered). The results are shown as full lines in Figs. 2-3-4. Although this model is very simple, it accounts notably better than the previous one for the high excitation gas, as can be seen in Figs. 2c, 3e, 3f and 3g. Nevertheless, close inspection of Figs. 2-3-4 raises some comments.
The low excitation gas represented by the lines in the H domain follows more closely the pattern of normal rotation with a kinematical major axis =30∘. Notice that along PA=17∘ the H data follows a rotation pattern with =30∘; the discrepant points in the SW might correspond to the annulus that is conspicuous at such distances on broad band images; it could correspond to part of a spiral arm or ring, in which non-circular motions are expected.
For the whole set of PAs, the data for both the high and low excitation gas at distances larger than 10 arcsec to the northwest show the largest differences with respect to the model. This could suggest that we are seeing kinematically distinct regions, i.e. line of sight gas which is not physically associated with the main emission structure. Indeed, the gas kinematics could be perturbed by the interaction of NGC 2992 with its close companion NGC 2993; notice that the existence of a warp in the gaseous disk is suggested by the difference between the photometrical and kinematical major axes.
Another feature that can perturb the measured velocity field is dust. Indeed, if the line profiles are affected by dust, the cross-correlation method used to infer velocity points will result in velocities which are not fully characteristic of the sampled region. This could explain the humps observed to the SE along PA=150∘ and 100∘, and also account for the differences observed between the [OIII] and H ranges in the NW along PA=100∘.
Along PA=122∘ offset by 5 arcsec (Fig. 3g), the hump observed in the velocity field just southeast of the nucleus corresponds to the annulus of ionized gas already mentioned above, while the large values northwest of the nucleus correspond to the “finger” observed by Wehrle & Morris (1988). It is probable therefore that these two regions do not follow the general rotation pattern. Notice that, here again, H roughly follows the disc rotation while the [OIII] velocities are better accounted for by a model including outflow.
4 Conclusions
We have obtained the gas kinematics of NGC 2992 by means of long slit data along nine position angles. The results are in general agreement with previous determinations (Heckman et al. 1981, who presented data along PA=120∘ with higher spectral resolution but lower spatial resolution; Colina et al. 1987, who presented data of lower spectral and spatial resolution along 3 PAs; Keel 1996, for data with a resolution similar to ours along PA).
We have modeled the kinematics of NGC 2992 by circular rotation in a gaseous disk to which is added constant radial outflow in the disk plane, as suggested by line splitting. Disk rotation can be accounted for with the following parameters: major axis along =30∘, inclination =70∘, velocity amplitude =250 km s-1, and parameters =1.1 and =5 arcsec (see Sect. 3). This value of , which allows a fairly good representation of the observed velocity field in the central regions, results to be different from that of the large scale disk as derived by continuum images. This discrepancy could imply that the disk of NGC 2992 is warped, probably due to interaction with NGC 2993. Outflow was modeled along a triangular region of axis PA=120∘, with an opening angle of 120∘ and a constant velocity of 150 km s-1 along the outflow region (measured 5 arcsec from the nucleus). Opening the angle of the outflow to 160∘ in the east could give a better fit only for PA=30∘ in the northeast, in the region where H emission is detected by Wehrle & Morris (1988).
It can be noted that low excitation gas follows better the pure rotation model in some regions, whereas high excitation gas is better represented when outflow is also included in the model. In our scenario, the outflow takes place radially close to the plane of the gaseous disk, with a spatial extension which is much larger on the east than on the west side.
This simple model accounts rather well for the kinematics of NGC 2992, if one excepts the regions located more than 6 arcsec northwest of the nucleus. The kinematics of the gas in that region confirm results by Heckman et al. (1981) and Colina et al. (1987), who reported large velocities and velocity dispersions. As noticed before, these regions with the largest discrepancies may be understood in terms of more complex dynamics and structure, and/or by taking into account the possible line asymmetries due to the dust distribution. Since our spectral resolution is not sufficient to observe line splitting in high excitation lines, and we don’t have line ratios, it could be difficult to constrain a more sophisticated model.
Acknowledgements.
We acknowledge the referee, P.O. Lindblad, whose suggestions helped us to improve the paper considerably. We are very grateful to F. Warin for her help in the data reduction, to J. Perea for making his cross-correlation program available to us and to D. Pelat for giving us his profile fitting programme. I. Márquez acknowledges financial support from the Spanish Ministerio de Educación y Ciencia.References
- (1) Christopoulou P.E., Holloway A.J., Steffen W. et al. 1997, MNRAS 284, 385
- (2) Colina L., Fricke K.J., Kollatschny W., Perryman M.A.C. 1987, A&A 178, 51
- (3) Durret F., Bergeron J. 1987, A&A 173, 219
- (4) Heckman T., Miley G.K., Van Breugel W.J.M., Butcher R.H. 1981, ApJ 247, 403
- (5) Hjelm, M., Lindblad, P.O. 1996a, A&ASS 120, 403
- (6) Hjelm, M., Lindblad, P.O. 1996b, A&A 305, 727
- (7) Hummel E., van Gorkom J.H., Kotanyi C.G. 1983, ApJ 267, L5
- (8) Keel W. C. 1996, AJ 111, 696
- (9) Lindblad, P.O., Hjelm, M., Jorsater, S., Kristen, H. 1996, in Nobel Symposium 98 “Barred galaxies and circumnuclear activity”, Eds. A. Sandquist & P.O. Lindblad, Lecture Notes in Physics, Springer Verlag, p. 283
- (10) Morris S., Ward M., Whittle M., Wilson A.S., Taylor K. 1985, MNRAS 216, 193
- (11) Nelson C.H., Whittle M. 1995, ApJS 99, 67
- (12) Storchi-Bergmann T., Wilson A.S., Baldwin J.A. 1992, ApJ 396, 45
- (13) Tonry J., Davis M. 1979, AJ 84, 1511
- (14) Tadhunter C.N., Tsvetanov Z. 1989, Nature 341, 422
- (15) Tsvetanov Z., Dopita M., Allen M. 1995, BAAS 27, 871
- (16) Ulvestad J.S., Wilson A.S. 1984, ApJ 285, 439
- (17) Ward M., Penston M.V., Blades J.C., Turtle A.J. 1980, MNRAS 193, 563
- (18) Wehrle A.E., Morris M. 1988, AJ 95, 1689
- (19) Wilson A.S., Tsvetanov Z. 1994, AJ 107, 1227
- (20) Wilson A.S., Baldwin J.A., Ulvestad J.S. 1985, ApJ 291, 627
- (21) de Zeeuw P.T., Lynden-Bell D. 1988, MNRAS 232, 419