13 (11.01.2; 11.17.3; 13.18.1)
Institute of Astronomy, Madingley Road, Cambridge CB3 0HA, United Kingdom
Joint Institute for VLBI in Europe, Postbus 2, 7990 AA, Dwingeloo The Netherlands
Netherlands Foundation for Research in Astronomy, Postbus 2, 7990 AA, Dwingeloo, The Netherlands
Kapteyn Institute, Postbus 800, 9700 AV, Groningen, The Netherlands
Deceleration of Relativistic Radio Components and the morphologies of Gigahertz Peaked Spectrum Sources.
Abstract
A relativistic radio component, which moves in a direction close to the sky plane, will increase in flux density when it decelerates. This effect is the basis for the qualitative model for GPS galaxies we present in this paper, which can explain their low-variability convex spectrum, their compact double or compact symmetric morphology, and the lack of GPS quasars at similar redshifts. Components are expelled from the nucleus at relativistic speeds at a large angle to the line of sight, and are decelerated (eg. by ram-pressure or entrainment of the external gas) before contributing to a mini-lobe. The young components are Doppler boosted in the direction of motion but appear fainter for the observer. The non-relativistic mini-lobes dominate the structure and are responsible for the low variability in flux density and the convex radio spectrum as well as the compact double angular morphology. Had the same source been orientated at a small angle to the line of sight, the young components would be boosted in the observer’s direction resulting in a flat and variable radio spectrum at high frequencies. Hence the characteristic convex spectrum of a GPS source would not be seen. These sources at small angles to the line of sight are probably identified with quasars, and are not recognized as GPS sources, but are embedded in the large population of flat spectrum variable quasars and BL Lac objects. This leads to a deficiency in GPS quasars at , but the model does not explain the population of GPS quasars at high redshift. However, there is increasing evidence that the high redshift GPS quasars are not related to the GPS galaxies. It is interesting for unification purposes to investigate if deceleration is a general phenomenon in compact radio sources. We have therefore investigated if evidence for deceleration can be traced in flux density outbursts of highly variable radio sources, and have found that indeed the evolution of the spectral peak in such outbursts does suggest that deceleration may play an important role, at least in some of these sources.
1 Introduction
Gigahertz Peaked Spectrum (GPS) sources are a class of extragalactic radio source characterized by a convex radio spectrum peaking at a frequency of about 1 GHz. They are compact luminous radio sources. The turnovers in their radio spectra are believed to be due to synchrotron-self-absorption caused by the high density of relativistic electrons in these compact sources. The overall angular size of GPS sources is a function of their spectral peak: the lower the peak frequency the larger the radio source. GPS sources may therefore be related to the class of compact steep spectrum (CSS) sources, which have lower peak frequencies ( MHz) and larger angular and linear sizes.
Optical identification programs carried out on GPS sources show the optical counterparts to be a mixture of galaxies and quasars (O’Dea 1991, Stanghellini et al. 1993, de Vries 1995). The quasars tend to have very high redshifts, while the GPS-galaxies have redshifts which are generally well below unity (O’Dea et al. 1991). Within the context of the simple orientation unification scheme of radio galaxies and quasars, it is puzzling that the redshift distribution of GPS galaxies is so different from that of GPS quasars. There is an increasing amount of evidence available in the literature that the GPS sources identified with galaxies and quasars are not related to each other and are different classes of objects; in addition to their different redshift distributions, it has been found that they have different distributions in rest-frame peak frequency, linear size and radio morphology (Stanghellini et al. 1996).
Early VLBI data on GPS sources showed that many of them, especially those identified with galaxies, had a compact double (CD) morphology with components of similar flux densities and spectral indices (Phillips and Mutel 1982). This led to the speculation that these are young radio sources, in which the two components could be interpreted as being mini-lobes. More recent higher quality images show that in many CDs weak central components with flatter spectral indices are found which are most naturally interpreted as being the central core. These sources were renamed compact symmetric objects (CSO), and it has been proposed that CSOs evolve into FRI and/or FRII sources (Readhead et al. 1994, Fanti et al. 1995). Stanghellini et al. (1996) has recently shown that about 90% of the GPS sources identified with galaxies are CSOs.
In this paper we present a model for GPS galaxies which can explain their spectral shape, their compact double or compact symmetric morphology, their apparent low flux density variability and the lack of GPS quasars at similar redshifts. In section 2.1, the observational basis for the model is presented. In section 2.2, the model is explained and its implications for the appearance of GPS sources presented. In section 3, the possiblity that deceleration is a more general phenomenon is investigated, by studying the spectral evolution of flux density outbursts in highly variable radio sources.

2 The Spectral and Angular Morphology of GPS Galaxies
2.1 The Starting Points
The following three observations of properties must be explained by any model of GPS sources:
-
1
The symmetric structures of GPS sources. The compact symmetric structure seen in most GPS galaxies (Stanghellini et al, 1996) indicates that relativistic boosting is relatively unimportant, otherwise only radio emission on the side directed towards us would be visible. This implies that these components are not ejected from the nucleus at small angles to the line of sight and at highly relativistic speeds. However it is not excluded that the components move at highly relativistic speeds at large angle to the line of sight (see point 2).
-
2
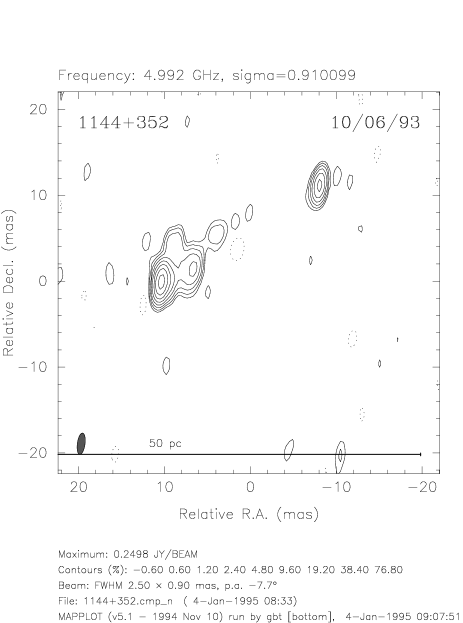
The relativistic velocities of components in nearby GPS galaxies. In two nearby GPS sources, 1144+352 (Giovannini et al. 1995) and 1946+708 (Taylor et al. 1997), it has been shown that some components have relativistic motions. The source 1144+352, which is shown in figure 1, consists of two components (ignoring faint large scale structure at long wavelengths) which separate from each other with an apparent velocity of . The structure of 1946+708 consists of a series of components (see figure 2) found by Taylor et al. to move away bi-directionally from a point between the two central components, probably the location of the nucleus. It is noteworthy that the components close to the centre move outwards faster than the components further away and that no motion is found for the two components at the largest distances from the centre. The highest apparent velocity measured in this source is (Taylor et al 1997).
-
3
The flux density variations of the nearby GPS source 1144+352. Although the GPS source 1144+352 is variable on timescales of several years (Snellen et al. 1995), its peaked spectral shape does not change. The peak flux density of the source increased monotonically from 300 to 600 mJy over some 20 years, and is at the moment decreasing slowly again. In view of the simple structure of 1144+352, we can attribute this flux density variation completely to the eastern-most (brightest) component in this source (Giovannini et al. 1995), because it contributes 85% of the flux density at 5 GHz.
The variability of 1144+352, the relativistic velocities of components in nearby GPS sources, and the large angles to the line of sight implied by symmetric morphologies lead us to the model discussed below.
2.2 A Decelerated Component Model
We shall model a GPS radio galaxy as a series of radio components expelled at different epochs, hence observed at different stages of their evolution. Each of those components is assumed to be expelled from the nucleus at relativistic speeds along a direction which makes a large angle to the line of sight. These components then decelerate and expand as they interact with the surrounding medium. In section 3.1 we will go briefly into the possible nature of the expelled components and their deceleration mechanism, however this is not necessary for our qualitative approach and not important at the moment.
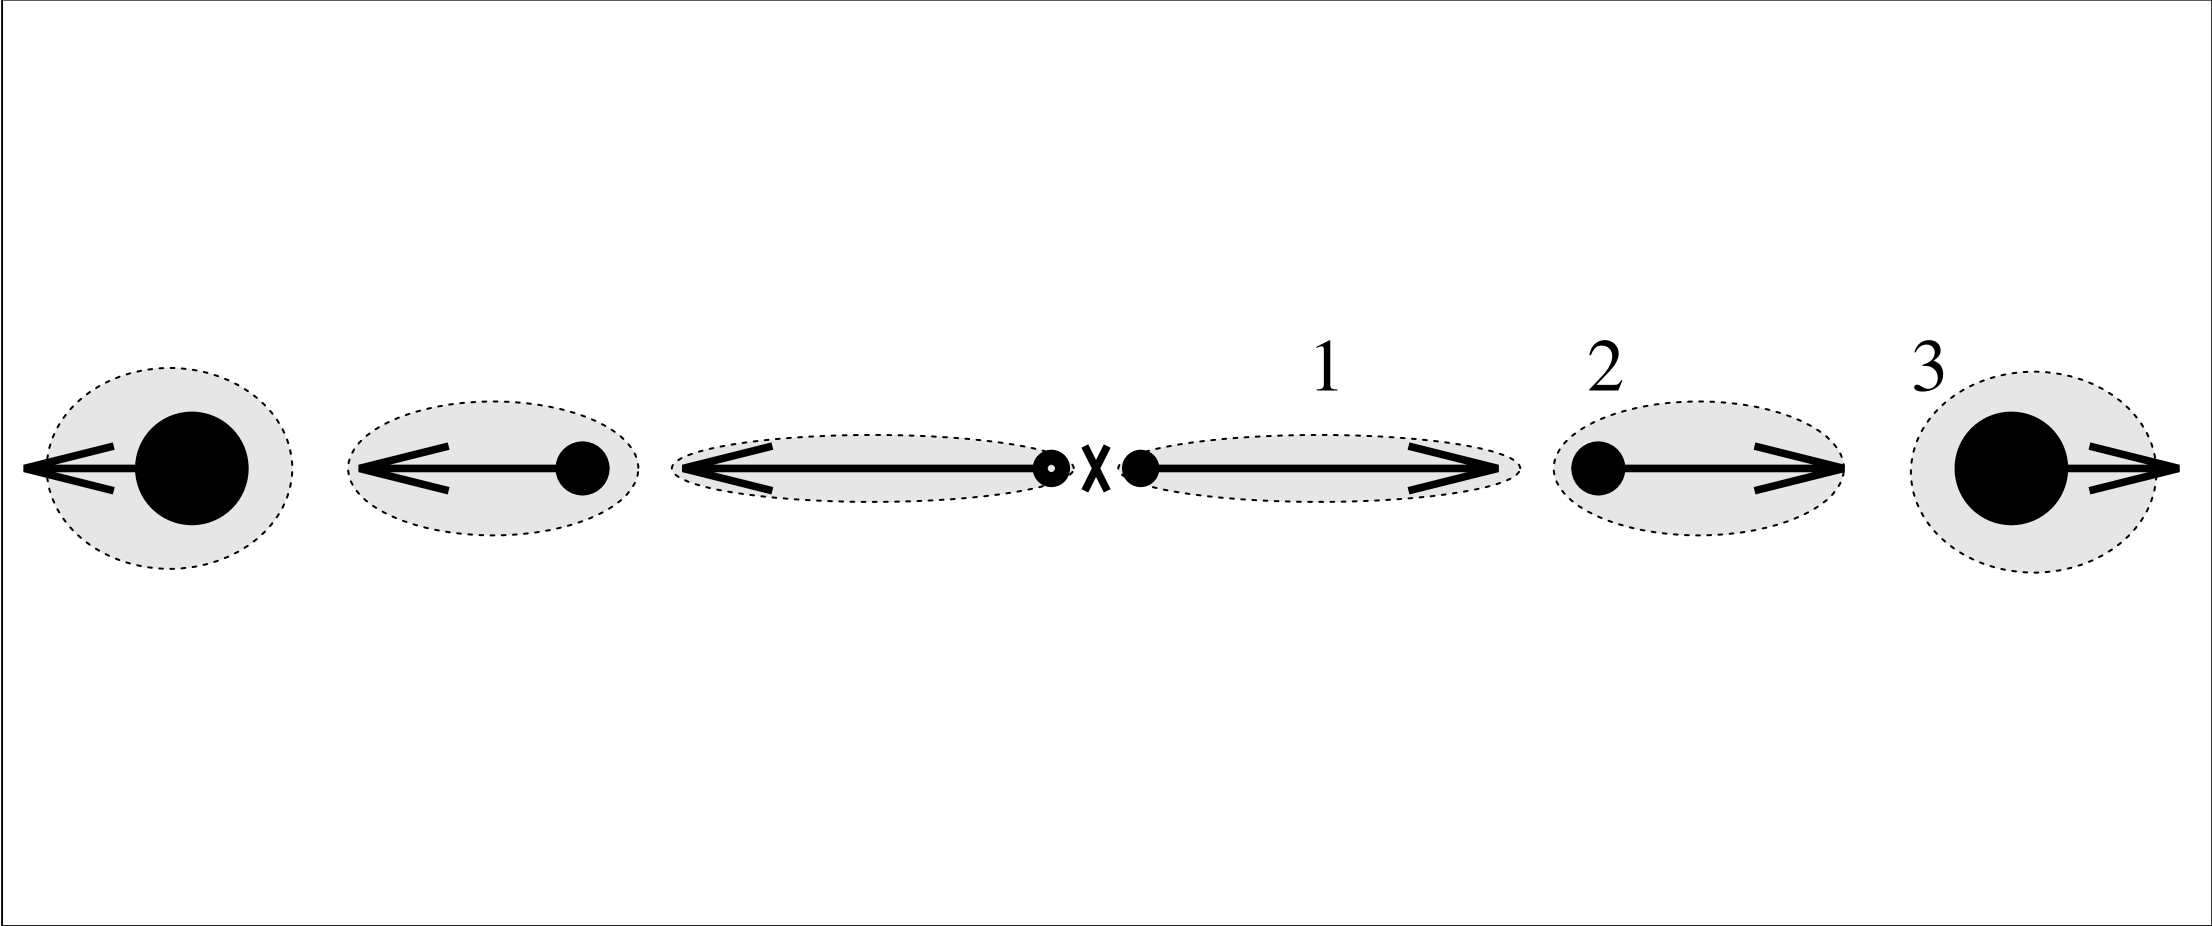
Consider the evolution of one such component. Initially its velocity is highly relativistic (figure 3, component 1) and the intensity of its radio emission is strongly Doppler boosted in the direction of motion. The component is assumed to be sufficiently compact to be optically thick at low frequencies as a result of synchrotron self absorption (SSA). Assuming that the component emits isotropically with a flux density at frequency , it will be observed to have a flux density of
| (1) |
where is the Doppler factor, , is the velocity in units of the velocity of light, , and the angle of the direction of the motion to the line of sight. For small values of , and highly relativistic velocities this results in . However, for a large angle to the line of sight, will be small, hence , which results in . As it evolves, the component will be decelerated to a modest relativistic speed (figure 3, component 2), as is seen in 1946+708, eg. by drag or entrainment of the external gas. The component also expands, resulting in a intrinsically lower SSA peak frequency and peak flux density.
Figure 4 shows the Doppler factor as function of for different angles to the line of sight. For small s and decreasing , the Doppler factor decreases because decreases faster than increases. However at large angles to the line of sight, increases with time. For , the peak flux density, which is proportional to , increases by a factor of 10 between () and (). Eventually the component is decelerated to barely relativistic speeds or slower and will contribute to a ’mini-lobe’ (figure 3, component 3).
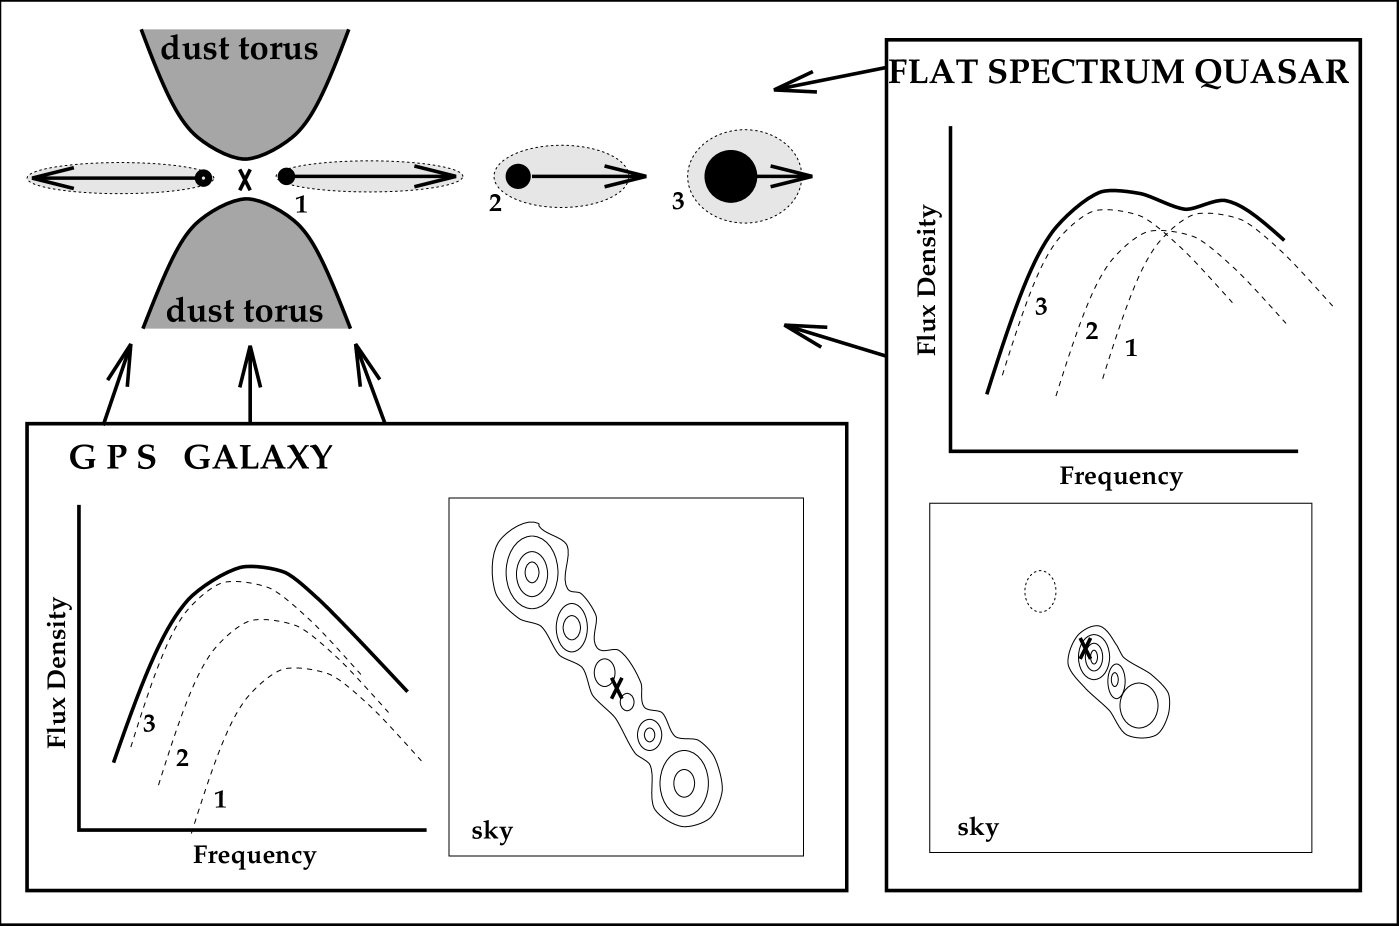
We now consider the effect of the simultaneous presence of the fast and slow components on the overall angular and spectral morphology that would be observed in a population of radio sources (figure 5).
i) For objects whose radio axes are oriented at a large angle to the line of sight, the slow, barely- or non-relativistic components, which form mini-lobes on both sides of the nucleus, are dominant in both the radio spectrum and angular morphology. The mini-lobes are still compact enough to be self absorbed, resulting in a ’gigahertz peaked spectrum’, and the radio source will have a compact symmetric morphology. The fact that for the highly relativistic young components, makes them appear faint. Therefore the flux density variability will be low due to the small contribution to the total flux density of the young and fast components; that is the creation of a new component will only have a small impact on the overall radio spectrum.

ii) For objects whose radio axes are oriented at a small angle to the line of sight, the influence of Doppler boosting on the appearance of the (slow) mini-lobes is small. They still would be observed to have a ‘gigahertz peaked’ radio spectrum, were it not that the young components, which move towards the observer, are strongly boosted in flux density and blue-shifted in frequency and dominate the overall spectrum producing a peak at high frequency. The overall radio spectrum appears to be flat or inverted with a peak at high frequency (see figure 5), and the object is not classified as a GPS source. Furthermore, the creation of new components produces a large effect on the radio spectrum, and results in the source being observed as (strongly) variable at high frequencies.
According to the orientation unification scheme (eg. Barthel, 1989) a quasar whose radio axis is oriented at a large angle to the line of sight, is observed to be a radio galaxy. However in our model, a GPS galaxy observed at a small angle to the line of sight, would not result in a quasar with a GPS radio spectrum, but in a quasar or blazar with a flat or inverted variable spectrum. Therefore no population of GPS quasars at similar redshifts to the GPS galaxies will be observed. These quasars would hide as a subsample in the large population of flat spectrum quasars and BL Lac objects.
3 The Evolution of a Single Component
The physical properties of radio jets are widely discussed in the literature, but this has not yet converged to a single view. Fortunately, no detailed understanding of the underlying jet-physics is necessary to come to a qualitative description of the flux density evolution of a decelerating radio component. However, we will discuss briefly the possible nature and deceleration mechanisms of the radio components in GPS sources.
3.1 The Physical Nature of the Radio Components and the Deceleration Mechanism.
In general it is assumed that radio jets can be treated as continuous fluids, but the jet-physics of GPS sources may be different from radio sources in general due to their young age; eg. a steady continuous jet may not have been formed yet. The most simple discrete radio source model is the adiabatic, spherically expanding source model (eg van der Laan 1966, Pauliny-Toth and Kellermann 1966), which was the first quantitative attempt to explain radio outbursts. If the radio components could indeed be treated as individual ‘plasmons’ the deceleration mechanism can be easily explained due to ram-pressure of the surrounding medium. Such a scenario has been modeled by Christiansen et al. (1978). However, this scheme results in a large energy release by dissipation which should be observed in some way.
In radio source models which consider jets to be continuous, the radio components are in general treated as shocks. In this case deceleration of the jets can be caused by entrainment of the external gas. When deceleration of jets was first discussed for FRI radio sources (eg. Begelman 1982, Scheuer 1983), it was pointed out that if an initially relativistic jet decelerates to sub-relativistic speeds much of its kinetic energy is thermalized, but that the jet can be recollimated by an external pressure gradient. More detailed analyses have been carried out by Bicknell (1994, 1995), Komissarov (1994). Bowman et al. (1996) claim that the energy released by dissipation is re-converted continuously into kinetic energy since the jet is propagating down a pressure gradient, and that deceleration without catastrophic kinetic energy loss is relatively easy to achieve for relativistic jets compared to non-relativistic ones. Recently, de Young (1997) concluded that for a constant hot-spot advance speed for CSOs as derived from VLBI data by Readhead et al. (1996) it is necessary to have entrainment along most of the jet, therefore allowing deceleration of the jet.
3.2 The Qualitative Flux Density Evolution of a Decelerating Component
If the deceleration model described above is valid, then deceleration should have a large influence on the spectral evolution of flux density outbursts observed in quasars and BL Lac objects. It is therefore interesting to investigate these flux density outbursts, and see if there is any signature of deceleration. First of all we have to discuss how flux density outbursts are explained in current models.
The adiabatic expanding source model agreed well with the observed spectral evolution at low frequencies, but it was less successful in explaining the high-frequency behaviour due to the earliest stages of the outbursts. Closer agreement was obtained using shock models, in which the radio outbursts are explained as due to propagation of shocks in relativistic jets (Marscher and Gear 1985, Hughes et al. 1989). The general applicability of the shock models is now widely accepted, although there are some features that these models cannot yet explain properly (eg. the growth stage of the shock). Three phases can be distinguished in the shock model (see figure 6). In the first phase, Compton losses are dominant, resulting in a dependence of the SSA peak flux density to the peak frequency of the shocked component given by . In the second phase, synchrotron losses are assumed to be dominant, resulting in . In the last phase, expansion losses are dominant, which is comparable to the adiabatic expanding radio source model, resulting in . Note that the exact relations between and in this model are both dependent on the relativistic electron energy distribution and the change in magnetic field strength along the jet (see Marscher and Gear 1985). The predictions of this shock model agree well with spectral observations (eg. Lainela 1994).


What influence can deceleration have on the spectral evolution of a radio outburst? Assuming that deceleration is the dominant factor, the change in the Doppler factor results in a change of the SSA spectral peak. From equation 1 we find that and , and therefore that . If the velocity of the component is highly relativistic, and , deceleration will cause an increase in , resulting in an increase in peak flux density and peak frequency, even for a small angle to the line of sight (see fig. 4). For example, at an angle of to the line of sight, is maximized at =2.9. Hence for deceleration will cause an increase in . Between and , the observed peak flux density will increase by a factor of 40, and the peak frequency increases by a factor of 3.4. During the deceleration of a component, it will also expand. At a certain point, the change in will be small compared to the changes in the spectrum due to the expansion. This period will be similar to the last phase in the general shock model. The effect of combined deceleration and adiabatic expansion is shown in figure 7, in which it is clear that the predicted spectral evolution is comparable to that expected for the generalized shock model, except in the initial phase of the outburst. The deceleration phase in fact replaces the inverse Compton and synchrotron phases. How can we distinguish between the two models? A detection of an increase in peak frequency combined with an increase in peak flux density of a flux density outburst would underline the importance of deceleration. However, this is difficult to observe, because it is expected to occur in the very early phase of the outburst. We have searched the literature for examples, as we now describe.
3.3 Observations of the Spectral Evolution of Flux Density Outbursts.
To be amenable for investigation of its spectral evolution, a radio outburst should have properties which obey the following criteria:
-
1)
The outburst should be a single event uncontaminated by previous outbursts. Blending of spectral features due to different outbursts make detailed investigation impossible.
-
2)
The radio spectrum during the initial period of the outburst, before maximum flux density is reached, must be well sampled. This implies that the timescale of the outburst should be sufficiently long for this to be accomplished.
-
3)
The radio source must be monitored at three or more frequencies to obtain sufficient information about the evolution of the spectral peak. Furthermore the highest frequency at which the source is monitored should be in the optically thin part of the spectrum, to allow the peak to be properly fitted. This implies that the maximum flux density of the outburst at the highest observed frequency should be lower than the maximum flux density at lower frequencies.


For many years large dedicated monitoring programs to study the time variability of radio sources have been carried out by the University of Michigan at 4.8, 8.0 and 14.5 GHz (Aller et al. 1985) and the Metsähovi Observatory at 22 and 37 GHz (Salonen 1983, 1987, Teräsranta 1992). We used data obtained in the course of these two monitoring programs to search for radio outbursts with properties obeying the criteria mentioned above. The best cases we found are the outbursts in 3C345 and 3C454.3 peaking in 1981 and 1982 respectively. Furthermore, Margo Aller provided us with unpublished data from an outburst in 3C454.3 in 1986. All three outbursts have well sampled observations at the 5 frequencies mentioned above. The contribution of emission not related to the outburst, often refered to as quiescent emission, was estimated from the flux densities in the period before the outburst, and then subtracted from the total observed flux densities. For 3C345 the quiescent level is about 7.0 Jy at all observed frequencies, and for 3C454.3 the quiescent emission was estimated to be . The resulting spectra were fitted with a least squares fitting routine, in which the optically thin spectral index was fixed at . Note that if the optically thin spectral index were to change during the outburst, it would become steeper in time (due to aging of the high energy electrons) and results in an estimation of the peak frequency which is too low. Therefore keeping constant cannot be the reason for finding an increase in peak frequency with time. The resulting evolution of the spectral peak in time for the three different outbursts are shown in figure 7. In the outburst in 3C345 and the second outburst in 3C454.3, the peak frequency does not significantly change in the initial stage of the outburst. However the first outburst of 3C454.3 seems to have an increase in peak frequency in the initial stage of the outburst, which is expected if deceleration plays an important role. In all three cases the peak frequency to peak flux density relation is steeper than expected for the general shock model (, with ), we find for the 3C345 outburst and and for the 3C454.3 outbursts. Hence these observations support the idea that deceleration plays a role in the spectral evolution of radio outbursts and, in some cases, may have a dominant role, e.g. 3C454.3.
Another method of investigating the spectral evolution of a radio source during an outburst would be to monitor its spectral index between two frequencies far enough apart that the spectral peak is enclosed between them. This has been done by Stevens et al. (1995) for the blazar PKS 0420-014. They have monitored the spectral index between 90 and 22 GHz and find clear relations between the 90 GHz flux density and the spectral index for the rising and falling phases of its radio flux density evolution. These relations can be converted to a relation between peak flux density and peak frequency for both stages, assuming the quiescent level (given by Stevens et al.) and a homogeneous self absorbed source with an optically thin spectral index, for which we take the value of Stevens et al. of -0.44 and assume it to be constant. During the rise in flux density the evolution of the spectral peak obeys the relation , where . During the decay in flux density it follows the same relation with . Hence these observations also support the idea of deceleration.
4 Discussion

The decelerated component model which we discuss in this paper can explain several properties of Gigahertz Peaked Spectrum radio galaxies. While consistent with the typical two-sided morphology and low variability, it can also explain the lack of GPS quasars at similar redshifts as the GPS galaxies, and account for the spectral evolution of flux density outbursts in highly variable radio sources. In this scheme, 1946+708, our prototype compact symmetric GPS source, is oriented close to the plane of the sky and would not have had a gigahertz peaked spectrum, if it were oriented at a small angle to the line of sight. It has a peak frequency of about 2 GHz and a peak flux density of about 1 Jy, and is believed to lie at a large angle to the line of sight, (Taylor et al. 1995). The measured flux density of the innermost component is about 50 mJy at 5 GHz. If the angle to the line of sight had been , and assuming that its velocity is 0.9c, the doppler factor had been a factor 3.5 higher and this young component would contribute 2 Jy at 17.5 GHz. Hence the overall spectrum of this radio source would appear flat above 1 GHz and it would not be classified as a GPS source. Furthermore the rapid change in Doppler boosting and expansion of the young component would make the radio source appear significantly more variable. For objects whose radio axes are oriented at small angle to the line of sight, the young components will be dominant at high frequencies, but at about 1 GHz, they would be observed in the optically thick part of their spectra where Doppler boosting is only mildly important (). Hence their 1 GHz flux densities would be similar to those observed if they were oriented at a large angle to the line of sight. A GPS galaxy observed at will appear as a flat spectrum variable quasar or a Bl Lac object. In a flux density limited sample at low frequency, only 1 flat spectrum quasar with no extended emission is expected per 20 GPS galaxies assuming a parent population with a random distribution of .
This corresponds to only 1 to 2 objects with a flux density greater than 1 Jy at 1 GHz. An example of such an object could be PKS 1413+135 (Perlman et al. 1994), which has no measured extended emission, a “flat” variable spectrum at high frequency, and at VLBI scales a component opposite to the jet which can be interpreted as a non-Doppler-boosted mini-lobe on the receding side of the source. Another candidate GPS source seen at a small angle to the line of sight is 1504+377 (CJI Survey, Polatidis et al. 1995).
Although the angle to the line of sight has to be large to produce a Gigahertz Peaked Spectrum, will not often be exactly . Therefore one side will have a component directed towards us and the other side will have a component directed away from us. This will result in different Doppler boosting for the approaching and receding jet, especially for the inner part of the jet which is moving the fastest. Such a situation could account for the morphologies observed in sources like 0108+388, 0404+768, 2352+495 and 0710+439 (Taylor et al. 1996): While the outer components are comparable in flux density, the inner components are only visible in the approaching jet. An exception to this is our prime example 1946+708. The inner two components are comparable in flux density for both the approaching and receding jet. This could be due to the fact that we observe these components in the optical thick, inverted parts of their spectra which are not very sensitive to Doppler boosting. However the outer two components, which show no motion, differ by a factor of in flux density. This could be caused by inhomogeneity of the medium for example, which is proposed by Taylor et al. 1995. However, there is a possibility that due to the fact that the approaching component is observed at an intrinsically later epoch than the receding component, that this difference in flux density is a result of observing the components at different evolutionary stages. VLBI observations at different frequencies are needed to further investigate this.
So far, we have ignored the Gigahertz Peaked Spectrum radio sources identified with quasars, which are found at high redshift. The model does not explain their existence. However, the GPS radio galaxies and quasars have a different distribution in redshift, rest frame peak frequency, linear size and VLBI morphology, and are probably different classes of objects (Stanghellini et al. 1996). Still it is confusing that these quasars, which are believed to be observed at a small angle to the line of sight, do not undergo significant Doppler boosting.
We have shown that deceleration could play an important role in 3C454.3 and 0420-014 and have hypothesized that it plays an important role in GPS galaxies and in other flat spectrum variable quasars and BL-Lacs. We also have noted that there is in fact very little data available in which the spectral evolution of individual outbursts can be unambiguously followed to look for evidence of deceleration. However it remains true that these outbursts can be exceptions. Furthermore, the quiesent radio flux density was assumed to be constant, and the change in radio flux density is all contributed by one component. This does not have to be the case, and the influence of other components can change the observed relation between peak flux density and peak frequency.
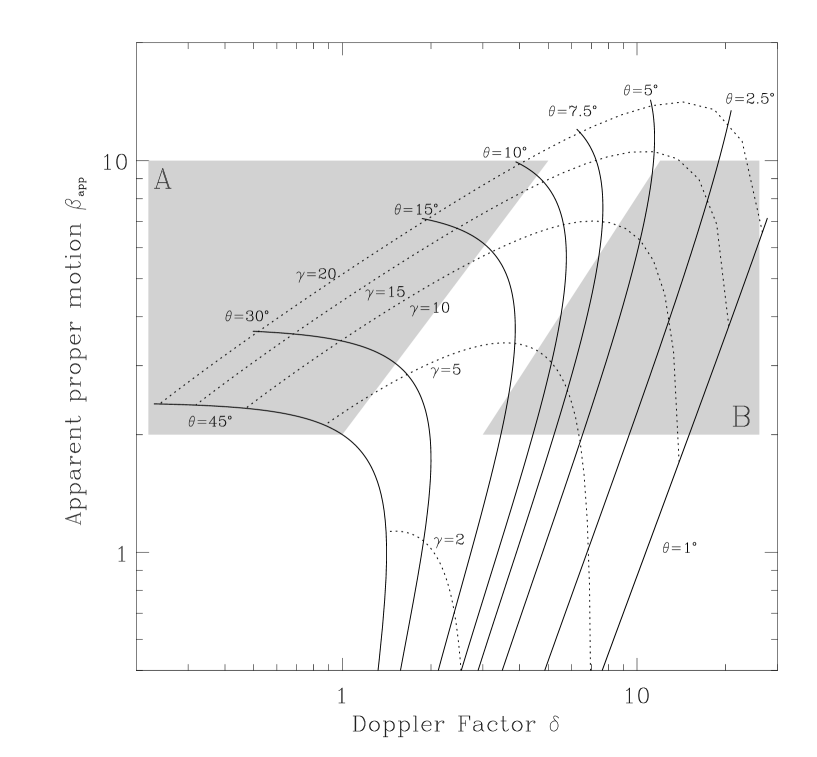
Ideally, one should analyse an outburst with VLBI at multiple frequencies. A first attempt has been carried out by Lobanov and Zensus (1996) using data on 3C345 at 8 different frequencies ranging from 1.4 to 89 GHz. Indeed a clear increase in peak frequency for two components was found which is in contradiction with the basic shock models. Lobanov and Zensus also conclude that an increase in the Doppler factor is the probable cause; however they believe this is due to acceleration and/or a change in the angle to the line of sight . There is a hint for acceleration in the measured angular velocities for these components (Zensus, Cohen and Unwin 1995), but the evidence for this is not convincing. If a change in the Doppler factor causes the increase in peak frequency (and peak flux density) in 3C345, it does not have to result in a change in the observed proper motion. In figure 10, the influence of and the angle to the line of sight on both the Doppler factor and the apparent proper motion is shown. varies for the solid lines while varies for the dotted lines. The grey areas and indicate the regions in parameter space for which deceleration and acceleration respectively can cause the increase in Doppler boosting. If you follow a solid line in region , increases while decreases, the reverse is true in region . In region the change in apparent proper motion is only small, while in region , increases significantly. Moreover in region , the angle to the line of sight is in the range , while for region , is in the range . Hence, due to retardation effects, an outburst undergoing an increase in due to acceleration should be observed to have a much smaller timescale than an outburst undergoing an increase in due to deceleration. The sources discussed in this paper are selected for their slow and well studied variability, and are therefore most likely not at the smallest angles to the line of sight compared to other highly variable radio sources. If this decelerated component model is correct, then no increase in peak frequency is expected for the rapidly variable sources with , unless . Note that a change in , if it is combined with the right , can also cause to increase without changing significantly. However this is especially the case for small , for which only a small change in can already significantly increase .
5 Conclusions
A qualitative model for GPS galaxies has been presented, in which components are expelled from a nucleus at relativistic speeds, decelerate and possibly contribute to a mini-lobe. At large angles to the line of sight, the minilobes are dominant because the Doppler factor of the young components is smaller than unity along the line of sight direction. At small angles to the line of sight these young components appear much brighter and become dominant. This model is consistent with the symmetric angular morphology of the mini-lobes of GPS galaxies and their low variability. It can explain the apparent lack of GPS quasars at similar redshifts to the GPS galaxies. Furthermore it provides an alternative explanation for the evolution of the spectral peak of flux density outbursts in highly variable radio sources.
Acknowledgements
We thank Margo Aller for providing us with data prior to publication. We thank Walter Jaffe for useful comments on the manuscript.
References
- [1] Aller H.D., Aller M.F., Latimer G.E., Hodge P.E., 1985, Astrophys. J. Suppl., 59, 513
- [2] Barthel P.D., 1989, Astrophys. J., 336, 606
- [3] Begelman, M.C., 1982, In proceedings of symposium ”Extragalactic radio sources”, Albuquerque, eds. Heeschen D.S., Wade C.M., Dordrecht, D. Reidel Publishing Co., 223
- [4] Bicknell G.V., 1994, Astrophys. J., 422, 542
- [5] Bicknell G.V., 1995, Astrophys. J. Suppl., 101, 29
- [6] Bowman, M., Leahy, J.P., Komissarov, S.S., 1996 Monthly Notices R.A.S., 279, 899
- [7] Christiansen, W.A., Scott J.S., and Vestrand, W.T., 1978, Astrophys. J., 223, 13
- [8] Fanti C., Fanti R., Dallacasa D., Schilizzi R.T., Spencer R.E., Stanghellini C., 1995, Astr. & Astrophys., 302, 317
- [9] Giovannini, G., Cotton W.D., Feretti L., Lara L., Venturi T., Marcaide J.M., 1995, In proceedings of N.A.S. Colloquium ” Quasars and AGN: High resolution Radio Imaging”, Irvine, eds. Cohen M.H. and Kellerman K.I.,p
- [10] Henstock D.R., Browne I.W.A., Wilkinson P.N., Taylor G.B., Vermeulen R.C., Pearson T.J., Readhead A.C.S, 1995 Astrophys. J. Suppl., 100, 1
- [11] Hughes P.A., Aller H.D., Aller M.F., 1989, Astrophys. J., 341, 68
- [12] Komissarov S.S., Monthly Notices R.A.S., 269, 394
- [13] van der Laan, H., 1966, Nature, 211, 1131
- [14] Lainela M., 1994, Astr. and Astrophys., 286, 408
- [15] Lobanov A.P. and Zensus J.A., 1996, Astrophys. J., submitted
- [16] Marscher A.P., Gear W.K., 1985, Astrophys. J., 298, 114
- [17] Paulini-toth, I.I.K, and Kellerman K.I., 1966, Astrophys. J., 146, 634
- [18] Phillips, R. B. and Mutel R., 1982, Astr. and Astrophys., 106, 21
- [19] O’Dea C.P., Baum S.A., Stanghellini C., 1991, Astrophys. J., 380, 66
- [20] Pacholczyk A.G., 1970 Radio Astrophysics, (San Fransisco:Freeman)
- [21] Perlman E.S., Stocke J.T., Shaffer D.B., Carilli C.L., Ma, Chopo, 1994, Astrophys. J., 424, L69
- [22] Polatidis A.G. Wilkinson P.N., Readhead A.C.S, Pearson T.J., Taylor G.B., Vermeulen R.C., 1995, Astrophys. J. Suppl., 98, 1
- [23] Readhead A.C.S, Xu W., and Pearson T.J. 1994 In proceedings of the NRAO workshop nr 23 on Compact Extragalactic Radio Sources, p17
- [24] Readhead A.C.S, Taylor G.B., Pearson T.J., Wilkinson P.J., 1996, Astrophys. J., 460, 634
- [25] Salonen E., Lehto H., Urpo, S., Teerikorpi P., Teräsranta H., Haarala, S., Valtaoja E., Tahtinen L, Sillanpaa A., Tiuri M., Valtonen M., 1983, Astronomy and Astrophysics Suppl., 51, 47
- [26] Salonen E., Teräsranta H., Urpo S., Tiuri M., Moiseev I.G., Nesterov N.S., Valtaoja E., Haarala S., Lehto H., Valtaoja L., Teerikorpi P, Valotnen M., 1987, Astronomy and Astrophysics Suppl., 70, 409
- [27] Scheuer, P.A.G., 1983, Highlights in Astronomy, 6, 735
- [28] Snellen I.A.G., Zhang M., Schilizzi R.T., Röttgering H.J.A., de Bruyn A.G. and Miley G.K., 1995, Astronomy and Astrophysics, 300, 359
- [29] Stanghellini C., O’Dea C.P., Baum S.A., Laurikanen E., 1993, Astrophys. J. Suppl., 88,1
- [30] Stanghellini C., Dallacasa D., O’Dea C.P., Baum S.A., Fanti R., Fanti C., 1996, in proc of 2nd workshop on GPS&CSS Radio Sources, eds. I. Snellen, R.T. Schilizzi, H.J.A. Röttgering and M.N. Bremer, p. 4
- [31] Stevens J.A., Litchfield S.J., Robson E.I, Gear W.K., Teräsranta H., Valtaoja E., 1995, Monthly Notices R.A.S., 275, 1146
- [32] Taylor G.B., Vermeulen R.C., Pearson T.J., 1995, In proceedings of N.A.S. Colloquium ”Quasars and AGN: High resolution Radio Imaging”, Irvine, eds. Cohen M.H. and Kellerman K.I.,p
- [33] Taylor G.B., Readhead A.C.S, Pearson T.J., 1996,Astrophys. J., 463, 95
- [34] Taylor G.B., Vermeulen R.C., Pearson T.J., 1995, In proceedings of N.A.S. Colloquium ”Quasars and AGN: High resolution Radio Imaging”, Irvine, eds. Cohen M.H. and Kellerman K.I.,p
- [35] Taylor G.B., Vermeulen R.C., 1997, Astrophys. J., 485, L9
-
[36]
Teräsranta H., Tornikosi M., Valtaoja E., Urpo S., Nesterov N.,
Lainela M., Kotilainen J., Wiren S., Laine S., Nilsson K., 1992,
Astron. and Astrophys. Suppl., 94, 121
- [37] De Vries W.H., Barthel P.D., Hes R., 1995, Astron. and Astrophys. Suppl., 114, 259
- [38] de Young, D.S., Astrophys. J., 490, L55
- [39] Zensus J.A., Cohen M.H., Unwin S.C., 1995, Astron. and Astrophys., 443, 35