Ly absorbers at : HST-CFHT imaging and spectroscopy in the field of 3C 286 ††thanks: Based on observations made with the NASA/ESA Hubble Space Telescope, obtained at the Space Telescope Science Institute, which is operated by the Association of Universities for Research in Astronomy, Inc., under NASA contract NAS 5-26555, and with the Canada-France-Hawaii Telescope
Abstract
We present further observational results on our Ly-only absorber identification project at low and intermediate redshifts. We combine CFHT/MOS imaging and spectroscopic observations of 25 galaxies in the field of the quasar 3C 286 () with HST/FOS spectrum of the quasar between 1600 and 3000 Å and HST/WFPC2 high spatial resolution imaging of some galaxies.
Our results confirm our first conclusions on the nature of the intermediate redshift Ly forest absorbers. A small fraction of them is tightly linked to galaxies, and most probably arise in the external parts of giant halos ( kpc) around fairly luminous galaxies () of various spectral and morphological types, as shown by HST imaging of these objects. Most of the absorbing clouds appear to be only “associated” with galaxies, in the sense that they could trace the gaseous filaments or sheets of large-scale structures. Thus, as expected from a sample tracing large scale structures, these galaxies have various spectral types.
We also find that groups of galaxies have always at least one associated Ly absorption line.
Key Words.:
quasar: absorption lines – galaxies: ISM – galaxies: halos1 Introduction
Observations with the Hubble Space Telescope (HST) have provided a large data base of Ly absorption lines at low and intermediate redshifts, in particular those from the HST Quasar Absorption Lines Key Project (Bahcall et al. 1991, 1993, 1996). For the lower redshift Ly absorbers, several optical identification searches have been conducted with ground-based telescopes to determine their nature, their cross-section and their link with galaxy populations. Two complementary approaches have been pursued, one based on extensive local galaxy-redshift surveys, the other on large, homogeneous Ly absorption line samples.
The first approach was adopted by Morris et al. (1993), Stocke et al. (1995) and Shull et al. (1996) and requires to obtain high-resolution and signal-to-noise ratio spectra of nearby quasars located behind or within the regions sampled by the CfA redshift surveys (e.g. 3C 273, Mrk 501). There are usually only a few Ly absorption lines per sightline, furthermore with very low rest-frame equivalent widths ( 20-300 mÅ), and the above authors have used complete galaxy catalogs to characterize the locations of the Ly absorbers relative to galaxies (including dwarf galaxies). A crucial result is the discovery of three Ly absorbers in voids of large-scale structures and, for the most extreme case (definite Ly absorption), the nearest known neighboring galaxy lies 8.8 Mpc (where is the Hubble constant in units of 50 km s-1 Mpc-1 and adopting ) away from the absorber (Stocke et al. 1995). This implies that some Ly absorbers (mainly those of low column densities) are not tightly linked to galaxies, or even to regions of matter overdensities. However, for the majority of these low-redshift Ly absorbers (7/10 in the Shull et al.’s sample), there is a galaxy within Mpc.
In the other approach, studies of fields around quasars observed with the HST Faint Object Spectrograph (FOS) aim at identifying Ly absorbers at intermediate redshifts, , with larger Ly equivalent widths, mÅ. Lanzetta et al. (1995, hereafter referred to as LBTW) have found that the majority of the absorbers are directly associated with extended gaseous galactic halos, a result not confirmed by Le Brun et al. (1996, hereafter referred to as LBB) who used a more homogeneous sample of Ly lines. The main conclusion reached by LBB is consistent with the results obtained for absorbers at lower redshift: the majority of Ly absorbers arise in gaseous regions spread along the large-scale structures of the galaxy distribution and only a small fraction of them trace extended galactic halos ( kpc). Numerical simulations of the evolution of the gaseous content of the Universe (Petitjean et al. 1995, Mücket et al. 1996) are also consistent with this picture.
The nature of these absorbers is more easily established at low redshift. If the Ly absorbers are then shown to primarily trace large-scale structures, their study over a large redshift range (up to 4-5) will provide information on the evolution of large-scale structures and will thus constrain cosmological models.
In this paper, we present further observations from our identification programme of intermediate redshift Ly absorbers and report on our results for the field around the quasar 3C 286. We have analyzed in details the UV spectrum of this quasar, for a study of the damped Ly system (Boissé et al. 1998), as well as deep HST/WFPC2 images of the field surrounding the quasar. We have also obtained the spectra of 31 galaxies within 4′ to the quasar sightline, successfully measuring 25 redshifts.
2 Presentation of the data
2.1 HST data
| Ident. | ||||||
|---|---|---|---|---|---|---|
| 1622.72 | 0.8 | 0.3 | 0.6 | 1215.67 | Ly | 0.3348 |
| 1679.80 | 0.90 | 0.19 | 0.55 | 1025.72 | Ly | 0.6377 |
| 1711.37 | 0.82 | 0.18 | 0.58 | 1215.67 | Ly | 0.4078 |
| 1739.49 | 0.86 | 0.18 | 0.60 | 1215.67 | Ly | 0.4309 |
| 1753.86 | 0.19 | 0.14 | 0.11 | 1025.72 | Ly | 0.7099 |
| 1781.06 | 0.80 | 0.13 | 0.46 | 1025.72 | Ly | 0.7364 |
| 1799.71 | 1.01 | 0.14 | 0.68 | 1215.67 | Ly | 0.4804 |
| 1813.43 | 0.93 | 0.14 | 0.62 | 1215.67 | Ly | 0.4917 |
| 1911.47 | 0.86 | 0.11 | 0.55 | 1215.67 | Ly | 0.5724 |
| 1928.22 | 0.80 | 0.11 | 0.50 | 1215.67 | Ly | 0.5861 |
| 1990.53 | 1.45 | 0.13 | 0.88 | 1215.67 | Ly | 0.6374 |
| 2078.20 | 0.55 | 0.12 | 0.32 | 1215.67 | Ly | 0.7095 |
| 2111.73 | 1.03 | 0.10 | 0.59 | 1215.67 | Ly | 0.7371 |
| 2143.86 | 0.30 | 0.08 | 0.17 | 1215.67 | Ly | 0.7635 |
| 2149.72 | 0.83 | 0.10 | 0.47 | 1215.67 | Ly | 0.7683 |
| 2152.64 | 0.34 | 0.09 | 0.19 | 1215.67 | Ly | 0.7707 |
| 2179.61 | 0.28 | 0.07 | 0.16 | 1215.67 | Ly | 0.7929 |
| 2183.11 | 0.52 | 0.08 | 0.29 | 1215.67 | Ly | 0.7958 |
| 2224.00 | 0.19 | 0.06 | 0.10 | 1215.67 | Ly | 0.8294 |
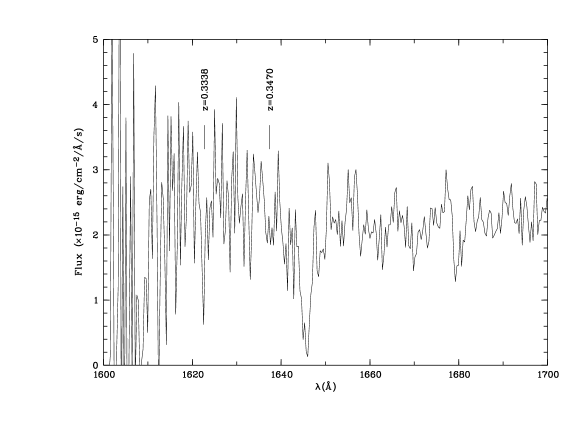
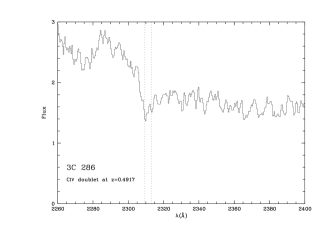
The UV spectrum of 3C 286 () was obtained in February 1995 with the HST/FOS and the grisms G190H-G270H (wavelength coverage 1620-3270 Å), as part of a programme devoted to a study of intermediate redshift damped Ly absorbers. The details of the data reduction and analysis are presented in Boissé et al. (1998). A systematic search of Ly lines was made in the wavelength range 1650-2240 Å, the region between 1620 and 1650 Å being of lower signal-to-noise ratio.The line list is given in Table 1, excluding the features associated with the damped Ly system (DLAS). Boissé et al. have selected lines detected at the level, whereas we have included a few additional candidate Ly features which are significant only at the level. The first line of the list ( Å), as well as a line at 1637.4 Å, were search for because we have detected galaxies at these redshifts in the quasar field. These absorption features have detection levels of respectively and (Fig. 1). Thus, only the first one will be used in the subsequent analysis. Since Boissé et al. (1998) paid special attention to identify all weak metal lines at , which is the only strong metal-rich system in the spectrum of 3C 286, it is then most likely that the sample presented in Table 1 is not contaminated by metal lines.
We have detected a total of 10 Ly absorption lines with a limiting rest equivalent width of 0.24 Å, in the redshift interval , thus a density of 20.9 lines per unit redshift. This value is in good agreement (within ) with that derived from the HST QSO absorption lines Key Project for the same limiting rest equivalent width (Bahcall et al. 1996):
| (1) |
HST images were obtained for the DLAS programme, and the data are fully described in Le Brun et al. (1997). These images have a limiting magnitude .
In addition, we have retrieved from the HST data bank (dataset root Z2P4010) a higher resolution () spectrum of the quasar obtained by Briggs et al. with the Goddard High Resolution Spectrograph and the grating G160M (wavelength range 1540-1580 Å) in June 1995. Except for the lines of the Lyman series at , no other line is present in this spectrum. This sets limits on the C iv absorption associated with some galaxies identified in the field of 3C 286 (see Sect. 3).
2.2 Galaxy population of the field (MOS imaging)
These data were obtained in May 1993 with the CFHT Multi Object Spectrograph (MOS). The data reduction and analysis techniques are as described in LBB. Images of the overall field were also obtained with the MOS, with a plate scale of 0.314″ per pixel, down to a limiting magnitude . The field is reduced from the original 10′ MOS field of view by vignetting and shift-and-add procedure to a field of view.
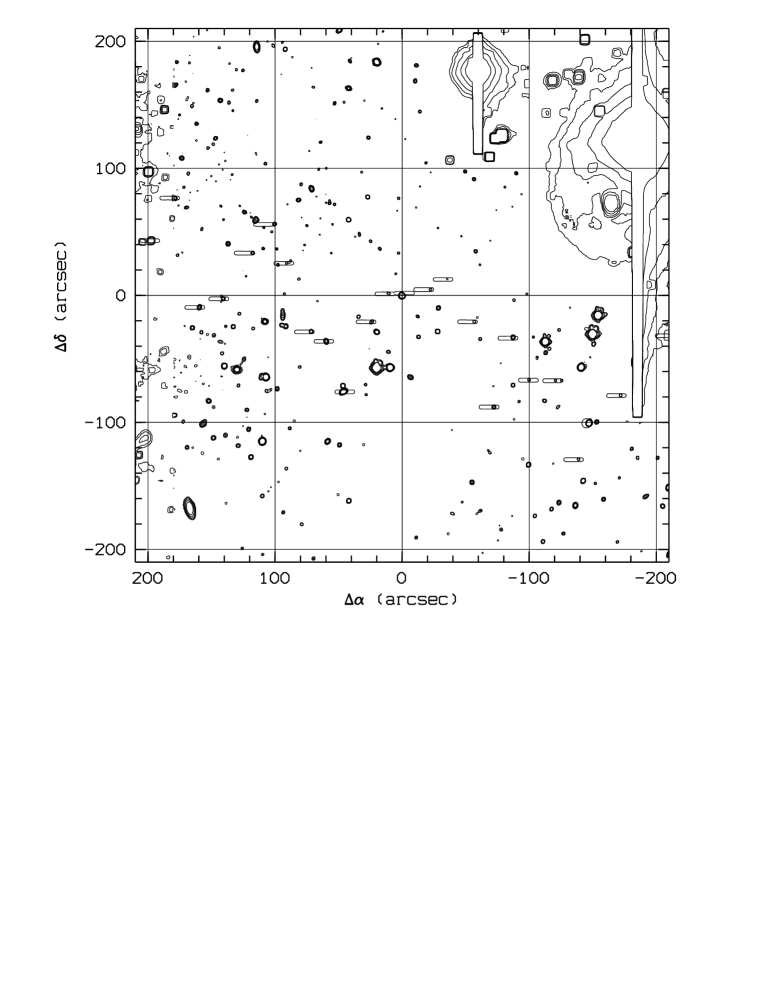
The detection and photometry of the galaxies in the field were made with the software SExtractor package (Bertin & Arnouts 1996). Our goal (not yet reached) for the identification survey of the galaxies associated in any way to Ly absorbing clouds is to obtain a complete galaxy sample down to a limiting magnitude and with an angular impact parameter . The field is shown in Fig. 2; the contours of the MOS slitlets show the galaxies for which spectra have been obtained. There are 127 galaxies in the above defined ranges of magnitude and impact parameter, which distribution versus magnitude is given in Column 2 of Table 2.
| Magnitude range | Ngal | Nz | Comp.c |
|---|---|---|---|
| 0 | 0 | - | |
| 1 | 1 | 100% | |
| 3 | 0 | 25% | |
| 13 | 2 | 18% | |
| 34 | 8 | 22% | |
| 76 | 8 | 15% |
a Number of galaxies in each magnitude bin
b Number of galaxies with measured redshift
c Completeness with regard to the cumulated magnitude
distribution
2.3 MOS spectroscopic data
We have obtained 31 spectra over the MOS field, from which we have derived 25 redshifts (see Table 3), corresponding to a success rate of about 81%, close to that reached by LBB. The spectral résolution is , and the error on the redshift estimate is about , due to the modest signal-to-noise ratio of the spectra. In the 3.5′ radius circle, we got redshifts for 19 galaxies, and the completeness of the spectroscopic sample is given in Column 3 of Table 2, together with the number of galaxies in each magnitude bin (Column 2). The absolute magnitudes are determined using a -correction which is estimated from a comparison between two spectra: firstly, the region of the galaxy rest-frame spectrum corresponding to the observed -band wavelength range and, secondly, the B-band wavelength region of the template spectrum of a galaxy of same morphological type (as determined by the Balmer+Ca ii break) given by Coleman et al. (1980). In addition, the shift from Vega-type to AB magnitudes is given by .
From the 25 identified galaxies, 12 are within 750 km s-1 from a Ly absorption line (this velocity criterion was defined in LBB, and is adequate to test the large-scale structure membership), and two show no associated Ly absorption, one of them being at the quasar redshift. Two additional galaxies are at redshifts for which there is no observation in the wavelength range of the expected associated Ly absorption, while for seven others the expected Ly line would be blueward of the Lyman discontinuity at . Finally, two objects are background galaxies.
| Slit | (″) | (″) | (″) | ( kpc) | ||||
|---|---|---|---|---|---|---|---|---|
| QSO | 0.0 | 0.0 | 0.0 | 0 | 0.849 | 17.04 | 26.45 | |
| 1 | indef | |||||||
| 2 | 251.1 | 113.1 | 275.4 | 1983 | 0.4070 | 0.4078 | 20.65 | 21.68 |
| 3 | 232.7 | 96.8 | 252.0 | 1642 | 0.3457 | 0.3470a | 22.81 | 19.18 |
| 4 | 232.1 | 40.0 | 235.5 | 1883 | 0.4900 | 0.4917 | 23.25 | 19.71 |
| 5 | 209.7 | 31.5 | 212.0 | 1301 | 0.3152 | Ly wavelength range not observed | 21.22 | 20.51 |
| 6 | 172.1 | 78.7 | 189.2 | 1957 | 0.8599 | background galaxy | 22.18 | 22.57 |
| 8 | 138.8 | 129.0 | 189.5 | 2001 | 0.9090 | background galaxy | 21.97 | 22.97 |
| 9a | 125.6 | 67.1 | 142.4 | indef. | 22.48 | |||
| 9b | 120.8 | 67.0 | 138.1 | 876 | 0.3316 | 0.3348 | 22.32 | 19.58 |
| 10 | 99.9 | 66.5 | 120.0 | 1093 | 0.6350 | 0.6374 | 21.95 | 22.40 |
| 11 | 87.4 | 33.2 | 93.5 | 819 | 0.5860 | 0.5860 | 20.65 | 23.23 |
| 12 | 72.3 | 87.9 | 113.8 | 692 | 0.3107 | Ly wavelength range not observed | 20.63 | 21.08 |
| 13 | 56.8 | 20.7 | 60.5 | indef | 22.13 | |||
| 14 | 35.5 | 12.8 | 37.7 | indef | 22.79 | |||
| 15 | 22.3 | 4.6 | 22.8 | 234 | 0.8474 | no associated Ly absorption line | 22.09 | 22.62 |
| 16 | 8.1 | 2.3 | 8.4 | indef | 23.81 | |||
| 17 | 10.7 | 1.6 | 10.8 | 68 | 0.3338 | 0.3348 | 21.98 | 19.95 |
| 18 | 24.0 | 20.9 | 31.8 | 166 | 0.2488 | blueward to the LL | 21.16 | 19.97 |
| 19 | 46.2 | 75.8 | 88.7 | 461 | 0.2475 | blueward to the LL | 18.44 | 22.39 |
| 20 | 59.7 | 36.2 | 69.8 | 88 | 0.0463 | blueward to the LL | 20.12 | 17.38 |
| 21 | 71.5 | 28.4 | 77.0 | 750 | 0.7394 | 0.7371 | 21.23 | 23.05 |
| 22 | 90.9 | 25.5 | 94.4 | indef | 22.42 | |||
| 23 | 100.4 | 56.0 | 115.0 | 859 | 0.4334 | 0.4309 | 21.19 | 21.45 |
| 24 | 117.5 | 33.4 | 122.2 | 977 | 0.4895 | 0.4917 | 21.36 | 21.43 |
| 25 | 140.7 | 2.6 | 140.8 | 1084 | 0.4575 | no associated Ly absorption line | 21.67 | 21.11 |
| 26 | 159.5 | 9.3 | 159.8 | 837 | 0.25 | blueward to the LL | 21.14 | 20.01 |
| 27 | 178.5 | 76.5 | 194.2 | 1453 | 0.4350 | 0.4309 | 21.41 | 21.24 |
| 28 | 197.4 | 43.0 | 202.0 | 1615 | 0.4900 | 0.4917 | 20.35 | 22.61 |
| 29 | 207.9 | 130.6 | 245.6 | 1170 | 0.2193 | blueward to the LL | 19.37 | 21.43 |
| 30 | 233.5 | 80.4 | 246.9 | 1286 | 0.2479 | blueward to the LL | 20.08 | 21.05 |
| 31 | 245.2 | 75.8 | 256.6 | 305 | 0.0435 | blueward to the LL | 15.71 | 20.87 |
a This absorber will not be included in the subsequent analysis
3 Characteristics of the identified galaxies
3.1 The lower redshift objects
As mentioned above, the Lyman discontinuity associated with the DLAS prevents to detect any Ly line at . In addition, the observed wavelength range restricts the detection of Ly lines to . Therefore, we could only search for possibly associated metal lines for the objects described in this section.
We note that there is neither a low redshift () C iv absorption nor a local galaxy at an impact parameter smaller than kpc. For the latter search, we have used the Simbad database111The Simbad database is operated at CDS, Strasbourg, France to list the local galaxies within 1 degree from the quasar. There are 16 such galaxies, but none of them has an impact parameter small enough to expect associated C iv absorption.
3.1.1 The group at
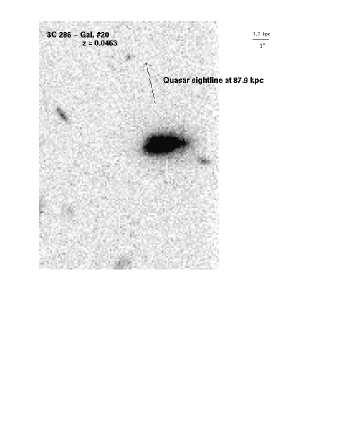
This group has two identified members, #20 and #31, with impact parameters and kpc respectively, and separated by 800 km s-1. The closest galaxy is very faint, , with a peak surface brightness , and is detected in our HST images (see Fig. 3). Its linear extent is kpc. This object is similar to the well known dwarf galaxy detected by Steidel et al. (1995) at , close to the sightline to PKS 0454+039, with , , and a linear extend of kpc. The impact parameters of these two dwarf galaxies differ by one order of magnitude ( and 87.9 kpc for the galaxies in the fields of PKS 0454+039 and 3C 286 respectively), which is consistent with the detected associated Mg ii absorption in the spectrum of PKS 0454+039 and the lack of such an absorption in 3C 286 (Boissé et al. 1998). The associated C iv doublet is unobservable for PKS 0454+039, due to a LLS at , and is expected in a very noisy region of our HST/G190H spectrum of 3C 286, thus preventing detection.
3.1.2 The group at
This group has an average redshift and includes at least 3 members (galaxies #18, #19 and #30), spanning 310 km s-1. The impact parameters range from 166 to kpc, and the absolute magnitudes from to . There is no detection of the associated C iv lines, expected at 1932.3 and 1935.6 Å, with a limiting rest equivalent width of 0.3 Å.
We note the presence of another fairly bright () quasar, 1E 1328.5+3135, at a redshift , or 1700 km s-1 from this group, 50′ north to 3C 286. This angular separation corresponds to Mpc at . This quasar may then belong to the same large-scale structure than the above group of galaxies.
3.1.3 The group at
There are two galaxies (#5 and #12), separated by 1030 km s-1, which may be part of a group. They have impact parameters and kpc, and both have about luminosities.
3.2 The group at
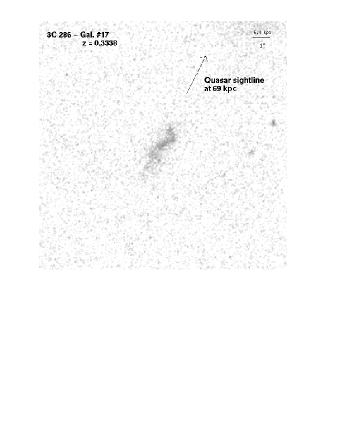
This group has two identified members (galaxies #9b and #17), at an average redshift , and with a linear projected separation of kpc. There is a Ly absorption line at , which we assume to be associated with the detected galaxy of smallest impact parameter, #17 at kpc, with a velocity difference km s-1. The HST image of this galaxy () is shown in Fig. 4. It is a very diffuse amorphous object, which does not clearly match any type of the Hubble sequence, as seen in the HST Medium Deep Survey (Abraham et al. 1996), or in the Hubble Deep Field (Van den Bergh et al. 1996). The comparison of the magnitudes measured from CFHT and HST data shows that there is no dominant very-low surface brightness component in this object (that would have been detected in CFHT but not in HST images). The spectrum of this galaxy shows strong [O ii] ( Å) and fainter emission lines of [O iii] ( Å), H ( Å) and H ( Å). The galaxy impact parameter is slightly larger than the value derived from the scaling law by Guillemin & Bergeron (1997) for the size of the Mg ii absorbing halo, kpc. This is consistent with the lack of detection of an associated Mg ii absorption in the spectrum of 3C 286 by Aldcroft et al. (1994). The C iv absorption doublet is expected at 2064.99 and 2068.41 Å, thus in the red wing of the damped Ly absorption line at . Higher resolution and signal-to-noise observations are required to better define the profile of the damped Ly line and search for weak C iv absorption. Finally, the N v doublet, expected at 1652.34 and 1657.64 Å, is not detected at a rest equivalent width limit of Å.
There is one other galaxy in the field (#3) at , which is likely to belong to an adjacent large-scale structure. An associated Ly absorption line may be present (see Sect. 2.1) at or km s-1 from the galaxy redshift. The magnitude and impact parameter of galaxy #3 are kpc and . However, due to the uncertainty on the reality of the Ly absorption line, this galaxy-absorber association will not be used in the subsequent analysis.
3.3 The group at
This group comprises two identified galaxies (#23 and #27), with large impact parameters and kpc respectively, with a projected separation of kpc. Both galaxies are bright, and , and they are separated by only 330 km s-1. There is a fairly strong Ly absorber associated with this group at with Å, thus separated by 520 and 850 km s-1 from galaxies #23 and #27 respectively. The associated C iv doublet is not detected at a limiting rest equivalent width of 0.18 Å for the C iv1548 line.
3.4 The group at
This group has 3 identified members at within 100 km s-1(#4, #24 and #28, and respectively). These galaxies cover a large range of spectral type, with either emission lines (galaxy #4), absorption lines (#24), or both absorption and emission lines (#28). Their impact parameters range from 975 to kpc and the total projected extent of this group is larger than 3.5 Mpc. There is an associated Ly absorber at 0.4917 with Å, which is outside the velocity range covered by the galaxies by 350 km s-1. There is a weak, but clearly present, associated C iv absorption doublet in the quasar UV spectrum (see Fig. 5), with Å, but the N v doublet is not detected at a rest equivalent width limit of 0.29 Å. It is likely that this absorption arises in a yet non-identified galaxy which lies closer to the quasar sightline, since C iv absorption is expected to occur in the external parts of galactic halos. There are 10 unidentified galaxies within 40″ to the quasar sightline, or kpc at , which could be responsible for this C iv absorption. An alternative hypothesis is that this C iv absorption could be due to intra-group (or cluster) gas. The observation of higher ionization level ions (like N v or O vi) could help discriminating these two origins.
3.5 Isolated foreground galaxies
3.5.1 The galaxies at and
These galaxies, #2 and #25, have redshifts and 0.4575 respectively. Galaxy #2 () has an associated Ly absorber, at , or a velocity difference of 170 km s-1, for an impact parameter of Mpc. Its spectrum shows strong H & K absorption, as well strong G band and Mg i absorptions.
On the contrary, galaxy #25 (), with impact parameter Mpc, does not have any associated Ly absorption, down to a limiting rest equivalent width of 0.24 Å. Its spectrum shows [O ii]3727 emission, as well as H & K absorption lines.
3.5.2 The galaxies at and
Each of these two galaxies (#11 and #10 respectively, and ) has an associated Ly absorbing cloud, with impact parameters and kpc and relative velocity and km s-1, for and respectively. Both galaxies have absorption line spectra, in addition to an [O ii]3727 emission for galaxy #11.
3.5.3 The galaxy at
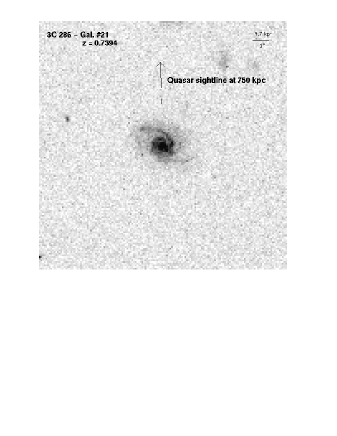
Based on the presence of a single emission line in the spectrum, identified as [O ii]3727 , this galaxy (#21) has a redshift , or 400 km s-1 away from the absorber. This galaxy is in the observed field of the WFPC2 that we obtained for the identification of the DLAS absorber. The 3600 s exposure of the 15″ field around the galaxy is shown on Fig. 6. This object appears to be a nearly face-on bright () spiral galaxy, with two well-developed arms extending over 5.4″, or kpc. The spectrum of this galaxy shows a faint [O ii] emission (Å), and no [O iii] emission ( Å), nor absorption lines.
3.6 The galaxy at
Object #15 is the only identified bright () galaxy with impact parameter smaller than kpc ( kpc) that does not show any associated Ly absorption line in a sample of 43 (LBB) + 12 (this work) galaxies suitable for the study of the galaxy-Ly-absorber relation. As this object is only within 300 km s-1 of the quasar redshift, it could be located behind the quasar. Alternatively, a gaseous halo associated with this galaxy could be highly ionized by the quasar UV flux and thus contain only a very small amount of neutral hydrogen. Therefore, this galaxy, as well as any other galaxy within 3000 km s-1 of the quasar redshift, is excluded from our sample.
4 Discussion on the Ly forest absorbers
| Gal. | ||||||
|---|---|---|---|---|---|---|
| Å | # | kpc | km s-1 | |||
| 0.3348 | 0.6 | 17 | 0.3338 | 68.8 | 19.95 | 220 |
| 0.4078 | 0.58 | 2 | 0.4070 | 1983.0 | 21.68 | 170 |
| 0.4309 | 0.60 | 23 | 0.4334 | 858.7 | 21.45 | 520 |
| 0.4917 | 0.62 | 24 | 0.4895 | 976.8 | 21.43 | 440 |
| 0.5860 | 0.50 | 11 | 0.5860 | 819.1 | 22.23 | 20 |
| 0.6374 | 0.88 | 10 | 0.6350 | 1093.2 | 21.40 | 440 |
| 0.7394 | 0.59 | 21 | 0.7371 | 749.6 | 23.05 | 400 |
| 0.36 | 25 | 0.4575 | 1083.9 | 21.11 | ||
4.1 Overall properties of the galaxy-Ly absorber associations
Table 4 lists the new sample of seven Ly absorber-galaxy associations, and one galaxy without associated Ly absorption detected in the field toward 3C 286. As in LBB, when several galaxies could be associated with the same Ly absorber, we have only considered the closest one. This criterion had to be applied in four cases, therefore excluding the galaxies #9b in the group, #27 in the group as well as #4 and #28 in the group. By comparison, we had to apply this criterion for only two galaxies in the larger sample of LBB. This may be linked with galaxy clustering (see Sect. 4.3 for further discussion about this point) along this particular sightline and supports LBB suggestion that there is not a one-to-one correspondance between Ly absorbers and galaxies, contrary to what was found for metal-rich absorbers.
Our new sample has been added to that studied in LBB (32 Ly absorber-galaxy associations and 11 galaxies without associated Ly absorption) which included results from other published Ly absorber surveys. The latter sample has also been modified in the following way:
-
•
the galaxy, which has no associated Ly absorption, in the field of US 1867 (LBTW) has been removed, since it lies only within 3000 km s-1 from the quasar;
-
•
three galaxies without associated Ly absorption from the sample of Morris et al. (1993) have been included; they have redshifts , 0.07789 and 0.10343, and impact parameters and Mpc respectively.
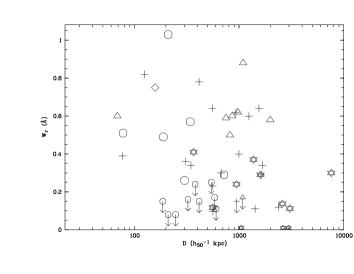
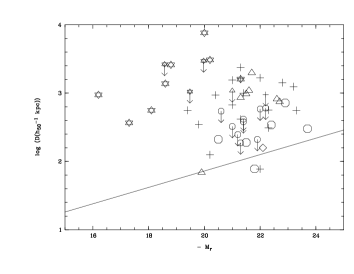
The overall sample now contains 53 galaxies, of which 39 Ly absorber-galaxy associations (galaxies at less than 750 km s-1 from a Ly absorbing cloud) and 14 galaxies without associated Ly absorption. It is now well known that both damped Ly absorption systems and strong Mg ii absorption systems222that is with Å, these systems are systematically associated with partial or total Lyman Limit Systems are strongly linked to galaxies, with one-to-one association (Bergeron & Boissé 1991, Steidel 1995, Le Brun et al. 1997), and with an anti-correlation between the impact parameter and the equivalent width of Mg ii (and thus likely Ly) lines. Thus, we have included in our sample only Ly lines with . It appears in fact that these two sub classes of absorbers do not have the same relation to galaxies, and we believe that including stronger Ly absorption lines in the sample of the so-called ’Ly forest lines’ would bias the correlation analysis. Thus, when considering only ’faint’ Ly lines, we still do not find any correlation between either the impact parameter and the Ly rest equivalent width, nor between the galaxy luminosity and the impact parameter (see Figs 7 and 8). Even when, following Chen et al. (1998), we select galaxies-absorption pairs which are likely to be physical association (since we couldn’t apply the criterium on the galaxy-absorber correlation fonction, we only selected galaxies with impact parameter smaller than kpc), we do not find any correlation between impact parameter and Ly rest equivalent width. This does not support a galactic halo model with radii as large as kpc as suggested by LBTW (using and ).
The relative velocity distribution of the Ly absorber-galaxy associations is shown in Fig. 9. The total sample of 39 associations is 25% larger than that of LBB. This distribution remains narrow with a km s-1 and the absolute relative velocity is smaller than 300 km s-1 in 73% of the cases. The redshift measurement error, which corresponds to 120 km s-1, has no influence on the shape of this distribution. These results are very similar to those previously determined by LBB. They are also consistent with those derived from a survey of local Ly absorber-galaxy associations by Bowen et al. (1996), the only difference being that the latter authors do not observe a peak around km s-1, which might be due to the smaller size of their sample.
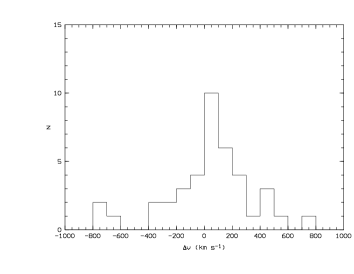
Among the 14 galaxies without associated Ly absorption, the smallest value of is 950 km s-1 (the galaxy in the field of PKS 1354+19) while for all the other 13 cases km s-1. The galaxies without associated Ly absorption can therefore be easily separated from the sample of absorber-galaxy associations. Furthermore, the relative velocity distribution between a galaxy and the nearest Ly absorber is highly peaked for the Ly absorber-galaxy associations whereas it is flat for the non-associations. This strengthens the suggestion that, even if the absorbers are not directly linked to galaxies, they are not distributed at random with respect to large-scale structures as traced by galaxies since the distribution strongly departs from uniformity.
4.2 Association as a function of impact parameter
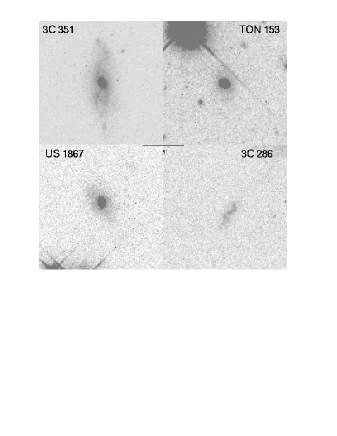
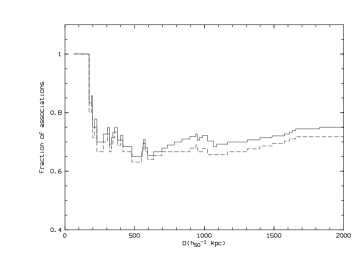
The cumulated fraction of Ly absorber-galaxy associations as a function of impact parameter is shown in Fig. 11. As in LBB, this fraction is unity for impact parameters smaller that kpc, which suggests that all field galaxies are most probably surrounded by huge ( kpc) gaseous halos, whose external parts give rise to Ly-only absorption (or more specifically with 0.15 Å at the 3 detection level). These galaxies are really Ly absorbing galaxies, in the sense that the absorbing is gravitationally or dynamically linked to them. There are five such galaxies in our sample, which characteristics are shown in Table 5. HST/WFPC2 images of 4 of these 5 galaxies are available in the HST Science Archives, and we show the images of these objects in Fig. 10. Two of them, in the fields of 3C 351 and US 1867, are also presented in Chen et al. (1998). As can be seen, these galaxies cover various morphological and/or spectral types. Therefore, it apears that, contrary to Mg ii absorbing galaxies, Ly absorbing galaxies do not represent a specific sub-sample of galaxies, and that the presence of a very large ( kpc) gaseous halo is a common characteritic of all classes of galaxies, maybe with the possible exception of the ellipticals.
| Field | PI Name | HST Dataset root | Spectral features | morpholgy | |
| QSO | PID | ||||
| 3C 286 | Bergeron | U2B10A03T to | 0.3338 | [O ii], [O iii], H | diffuse irregular LSB |
| 5351 | U2B10A06T | and H emission | |||
| TON 153 | Steidel | U2OM0901T to | 0.6715 | Ca ii H & K | S0 |
| 5984 | U2OM0904T | and G band absorption | |||
| 3C 351 | Disney | U2WK0501T to | 0.0910 | [O iii], H, N ii | Inclined spiral (Chen et al. 1997) |
| 6303 | U2WK0504T | and S ii emission | |||
| US 1867 | Lanzetta | U2X30301T to | 0.4435 | Ca ii H & K | S0 (Chen et al. 1997) |
| 5949 | U2X30303T | and Fe absrption | |||
| H 1821+64 | 0.2251 | Na i absorption, | |||
| H emission |
At intermediate impact parameter, the fraction of galaxies that are associated with a Ly absorbing cloud equals 60% between 200 and kpc, thus higher than the value of 40% derived by Bowen et al. (1996) for lower redshift objects and kpc, and in contradiction with the statement of Chen et al. (1997) that galaxies at impact parameter greater than kpc are “almost never” associated with a Ly absorption line. Both associated and non-associated galaxies cover a wide range of spectral types (see Chen et al. (1998) for a display of a large number of both absorption-associated and non associated galaxies). The galaxy spectra (from our observations and those of LBTW) show either strong emission lines, [O ii]3727 and H and also in some cases H and [O iii], or the Balmer line series in absorption, or a strong Ca ii break. Consequently, neither the spectroscopic nor morphological type of a galaxy is a characteristic parameter of galaxies associated with Ly absorption.
At very large impact parameters, above kpc, there is an important fraction of associations (about 80%), slightly higher for this new sample than previously found (Fig. 11). However, at these large impact parameters, a large fraction of the associations could be fortuitious, since these distances are close to the average separation between two galaxies. On the contrary, the associations with projected separations below kpc are more likely to have a physical origin, depending on the characteristics of the galaxies (brightness, class, environment …), but the size of the sample is still too small to determine the governing factors in these associations (see a discussion on clustering in Sect. 4.3).
These results are consistent with the recent analysis by Dinshaw et al. (1997) of the properties of the absorption lines in a quasar close pair. The equivalent width distribution of their sample of coincident and anticoincident Ly systems is best reproduced by models of flatten structures of very large dimensions ( Mpc in the assumption of randomly inclined disks). This result is also in agreement with recent cosmological simulations which suggest that Ly absorbers trace large-scale filaments or sheets (Hernquist et al. 1996, Reidiger et al. 1998)
4.3 Relation with groups or clusters of galaxies
Despite the small size of the sample, we can start to examine the role of the galaxy environment as a factor for the association with Ly absorption lines. There are five groups of galaxies (i.e. comprising from at least 2 to 4 members, with velocities spanning less than 500 km s-1), which comprise 11 of the 53 galaxies of the sample. They all show associated Ly absorption. Among these five groups, two in the field around TON 153 (LBB) are part of a larger structure, with other galaxies and Ly absorption lines at km s-1. The three other groups, all detected in the field of 3C 286, are associated with a single isolated Ly line (see Table 6). For three additionnal groups, one at in the field of 3C 95 (LBTW), and two at and 0.09 in the field of 3C 351 (LBB), no meaningful limit ( of only about 1 Å) could be set on the corresponding Ly line. Thus, all small groups of galaxies, for which there are adequate spectroscopic data of the background quasars, have an associated Ly absorption line. The presence of these groups is not accounted for by Chen et al. (1997) in their hypothesis of a kpc halo, which would then contain one or more galaxy of the group it belongs to. Thus, we favour the existence of a smaller halo ( kpc), and absorption by gas belonging to the structures (either large scale structures of groups/clusters) traced by galaxies.
The known number of members of theses groups is of course a lower limit to their actual membership, and only a complete spectrocopic survey will reveal the nature of these associations. We have performed Monte-Carlo simulations to derive the probability to obtain the observed velocity separation for 2 or 3 galaxies in a cluster or group of given velocity dispersion , which show that the group does not trace a rich cluster with km s-1, at a confidence level.
In the field of 3C 286, the actual total number of galaxies with apparent magnitude is 396. The average number of galaxies expected in a field is 350, as derived from the differential magnitude-number counts of field galaxies given by Le Brun et al. (1993) :
| (2) |
in very good agreement with those obtained by Metcalfe et al. (1991), Smail et al. (1995) or Driver et al. (1994). Thus, the field around 3C 286 appears to be slightly denser than average ( effect). However, since the physical size of the field is greater than Mpc at the redshifts of the Ly absorbers, the presence of large clusters (similar to that surrounding H 1821+64, see LBB) containing more than 100 galaxies is excluded up to , which includes all the Ly absorbers associated with groups of galaxies. Using the same kind of algorithm as in Le Brun et al. (1993), we have drawn the galaxy density map of the field. As can be seen in Fig. 12, the field is highly inhomogeneous, with two peaks at more than 8 above the average density. These peaks are all located eastwards to the quasar, as well as most of the members of the group and most of the galaxies in the redshift range (triangles and squares on Fig. 12).
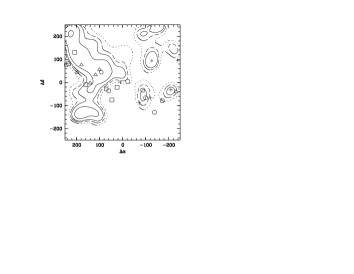
These structures comprise a few tens of galaxies, and are likely to be groups or small clusters, their size being about kpc at . The presence or absence of associated metal line of different ionization levels could allow to study the ionization conditions that prevail in these absorbers, as well as their average metallicity.
| Size | |||||
|---|---|---|---|---|---|
| kpckpc | km s-1 | ||||
| 0.3348 | 2 | 0.3316 | 500 | ||
| 0.3338 | |||||
| 0.4309 | 2 | 0.4334 | 330 | ||
| 0.4350 | |||||
| 0.4917 | 3 | 0.4895 | 100 | ||
| 0.4900 | |||||
| 0.4900 |
There is at present only one case of an identified galaxy belonging to a rich cluster not associated with the quasar : in the field of 3C 273, a galaxy is a member of the rich cluster, A 1564 at with 54 identified galaxies (see Morris et al. 1993 for a complete discussion), but no associated Ly absorption is detected. This could be explained by the physical conditions which prevail in such a dense environment: the interstellar gas is stripped from individual galaxies by tidal effects and the intracluster gas is too highly ionized to contain detectable amounts of neutral hydrogen.
One would naturally expect that Ly absorbers are also found near closely interacting galaxies, for which gas is expected to be ejected at very large distance by tidal effects. Our survey is at a too early stage (only one such case observed so far) to estimate the gaseous cross-section of interacting galaxies.
References
- (1) Abraham R.G., Van Den Berg S., Glazebrook K., et al., 1996, ApJS 107, 1
- (2) Aldcroft T.L., Bechtold J., Elvis M., 1994, ApJS 93, 1
- (3) Bahcall J.N., Jannuzi B.T., Schneider D.P., et al., 1991, ApJ 377, L5
- (4) Bahcall J.N., Bergeron J., Boksenberg, A., et al., 1993, ApJS 87, 1
- (5) Bahcall J.N., Bergeron J., Boksenberg A., et al., 1996, ApJ 457, 19
- (6) Bertin E., Arnouts S., 1996, A&AS 117, 393
- (7) Boissé P., Le Brun V., Bergeron J., Deharveng J.-M., 1998, A&A, in press
- (8) Bowen D.V., Blades J.C., Pettini M., 1996, ApJ 464, 141
- (9) Chen H.-W., Lanzetta K.M., Webb J.K., Barcons X., 1998, ApJ in press, astro-ph/9710310
- (10) Coleman G.D., Wu C.-C., Weedman D.W., 1980, ApJS 43, 393
- (11) Cristiani S., D’Odorico S., D’Odorico V., et al., 1996, MNRAS 285, 209
- (12) Dinshaw N., Weymann R.J., Impey C.D., et al., 1997, ApJ 491, 45
- (13) Driver S.P., Phillipps S., Davies J.I., Morgan I., Disney M.J., 1995, MNRAS 266, 155
- (14) Ellingson E., Green R.F., Yee H.C.K., 1991, ApJ 378, 476
- (15) Guillemin P., Bergeron J., 1997, A&A 328, 499
- (16) Hernquist L., Katz N., Weinberg D.H., Miralda-Escudé J., 1996, ApJ 451, L51
- (17) Lanzetta K.M., Bowen D.V., Tytler D., Webb J.K., 1995, ApJ 442, 538 (LBTW)
- (18) Le Brun V., Bergeron J., Boissé P., Christian C., 1993, A&A 279, 31
- (19) Le Brun V., Bergeron J., Boissé P., 1996, A&A 306, 691 (LBB)
- (20) Le Brun V., Bergeron J., Boissé P., Deharveng J.M., 1997, A&A 321, 733
- (21) Metcalfe N., Fong R., Shanks T., Jones L.R., 1991, MNRAS 249, 498
- (22) Morris S.L., Weymann R.J., Dressler A., et al., 1993, ApJ 419, 524
- (23) Mücket J.P., Petitjean P., Kates R.E., Reidiger R., 1996, A&A 308, 17
- (24) Petitjean P., Mücket J.P., Kates R.E., 1995, A&A 295, L9
- (25) Riediger R., Petitjean P., Mücket J.P., 1998, A&A 329, 30
- (26) Shull J.M., Stocke J.T., Penton S., 1996, AJ 111, 72
- (27) Smail I., Hogg D.W., Yan L., Cohen J., 1995, ApJ 449, L105
- (28) Schneider D.P., Bahcall J.N., Gunn J.E., Dressler A., 1992, AJ 103, 1047
- (29) Steidel C.C., Bowen D.V., Blades J.C., Dickinson M., 1995, ApJ 440, L45
- (30) Stocke J.T., Shull J.M., Penton S., Donahue M., Carilli C., 1995, ApJ 451, 24
- (31) Van Den Bergh S., Abraham R.G., Ellis R.S., et al., 1996, AJ 112, 359