Galaxy Counts, Sizes, Colours and Redshifts in the Hubble Deep Field
Abstract
We compare the galaxy evolution models of Bruzual & Charlot (1993) with faint galaxy count, size and colour data from the Hubble and Herschel Deep Fields (Metcalfe et al 1996). For , we find that models where the SFR increases exponentially out to are consistent with all of the observational data. For , such models require an extra population of galaxies which are only seen at high redshift and then rapidly fade or disappear. We find that, whatever the cosmology, the redshift of the faint blue galaxies and hence the epoch of galaxy formation is likely to lie at . We find no implied peak in the SFR at and we suggest that the reasons for this contradiction with the results of Madau et al (1996) include differences in faint galaxy photometry, in the treatment of spiral dust and in the local galaxy count normalisation.
keywords:
galaxy counts, epoch of galaxy formation, faint blue galaxies1 Hubble and Herschel Deep Field Data
We have measured galaxy counts, sizes and colours in the Hubble Deep Field (HDF, Williams et al 1996) to , and (Metcalfe et al 1996). We have further measured galaxy counts and colours in a 50hr B CCD exposure to using the William Herschel Telescope (WHT) in the Herschel Deep Field. Within this field we have also obtained a 30hr IRCAM3 exposure with UKIRT to in a area.
We show in Fig. 1 our derived B, I and K galaxy number counts, together with those from other work. The HST B counts extend one magnitude deeper than the WHT data and they are in good agreement where they overlap. The HST I counts extend about deeper than previous data, because of the higher HST resolution and the fainter background sky. The K counts now also appear to be well defined in the range .
2 Galaxy Count Models

As noted previously (Shanks 1990, Koo & Kron 1992, Metcalfe et al 1991,1995), if the B count models are normalised at rather than then non-evolving models give a reasonable representation of the B band counts and redshift distributions in the range . This high normalisation has recently received new support from HST galaxy counts subdivided by morphology where non-evolving models with the high normalisation give an excellent fit to both spiral and early type galaxy counts with (Glazebrook et al 1995a, Driver et al 1995). The B galaxy count then shows evidence for strong evolution in the range (see Fig. 1). Also the high normalisation allows non-evolving models with to fit the less steep K counts to .
Simple evolutionary models where galaxy star-formation rates rise exponentially with look-back time, are known to fit the B counts in the range (Koo & Kron 1992, Metcalfe et al 1991,1995). But previous faint galaxy redshift surveys at presented a problem for such models, as they predict a high redshift tail which was unobserved in these early surveys (Glazebrook et al 1995b). However, Cowie et al (1995,1996) have recently used the Keck 10m telescope to make a new galaxy redshift survey with 80% completeness and have now detected such a high redshift galaxy component, supporting the viability of these models.
Furthermore, spiral evolution models with exponentially increasing star-formation rates of time scale 9 Gyr, are now thought to be able to sustain large amounts of B band evolution (Bruzual & Charlot 1993, Campos & Shanks 1997). These spiral models also have the advantage that evolving the steeper luminosity function of late-type galaxies (Shanks 1990, Metcalfe et al 1995) makes it easier to increase the B number counts using lower redshift galaxies, particularly if they contain even small amounts of dust (Wang 1991, Gronwall & Koo 1995, Campos & Shanks 1997).
In the low case, this spiral dominated model then produces a reasonable fit to the counts to and and (see Fig. 1). Although the model underestimates the optical counts at fainter magnitudes, this discrepancy is probably still within the combined data and model uncertainties. In the case, the spiral luminosity evolution model only fits the optical data to and and then more seriously underestimates the counts at fainter magnitudes. Thus, the HST data confirms the previous ground-based result (Yoshii & Takahara 1988, Koo & Kron 1992, Metcalfe et al 1995) that if , then there is not enough spatial volume at high redshifts to allow simple luminosity evolution models to fit the high galaxy counts at . To improve the fit of the model, we consider a model with an extra population of high redshift galaxies which have a constant star-formation rate from the formation epoch till z=1. The Bruzual & Charlot model shows that at the galaxy then rapidly fades by in B to form a red (dE) galaxy by the present day. This model is in the spirit of previously proposed ‘disappearing dwarf’ count models (Babul & Rees 1992) and it gives a good fit to the faint B,I,K counts.
Finally, Metcalfe et al (1996, Fig. 2) have further shown that both the and models also fit the new Keck n(z) data of Cowie et al (1996). The models also fit the apparently unevolved Keck n(z) of Cowie et al by virtue of our assumed x=3 IMF for early-type galaxies which reduces their essentially passive K evolution to acceptable limits.
3 Galaxy Sizes

It has been claimed that angular sizes of faint HDF galaxies are small compared to local galaxies (Roche et al 1998 and references therein). It is therefore interesting to see if the angular size data can reject the above models. So, following Metcalfe et al(1995), we adapted the PPP CCD simulation code (Yee & Green 1987) to simulate an HDF frame. We assumed Freeman’s(1970) law to relate disk size to absolute magnitude at z=0 and assumed that luminosity evolution only affects disk surface brightness and not size. For bulges, we similarly used an law and the diameter-magnitude relations of Sandage & Perelemuter (1990). In the case we made the same ‘bulge’ assumptions for the ‘disappearing dwarf’ population. We then applied our photometry software to determine the B magnitude-angular size relation to for both data and simulation. Fig. 2 shows that although the HDF galaxy isophotal radii are small and only of order , the model also predicts similarly small sizes for the galaxies. The same is true for the model. A small size is predicted because we are looking down the luminosity function at to galaxies with low intrinsic luminosities and hence small sizes.
4 Model Constraints from Galaxy Colours and Redshifts
We next test the models against the faint galaxy colour distributions in the HDF. The presence of broad features in galaxy spectra allows tests to be made of the predicted galaxy redshifts. Here we simply compare our evolutionary model predictions to the observations of faint galaxy colours. Metcalfe et al (1996, Fig. 3) showed that our predicted U-B:B-I model tracks compare well with the observed colours for galaxies. The redshifting of the Lyman forest/break (Madau, 1995) through the U band causes the model U-B colours to move sharply redwards and the same effect is clearly seen in the data. Metcalfe et al found that the proportion of galaxies with U-B0 colours corresponding to is approximately half of the total at , indicating that the apparent redshift distribution may peak at z2, in good agreement with both the evolutionary model and the , disappearing dwarf model.
These conclusions are confirmed by consideration of the B-R:R-I colour-colour plot in Fig. 3 which shows excellent agreement between the predicted tracks of the galaxy types with redshift and the HDF data. The highest density peak in this plot also corresponds to the predicted galaxy colours for z2. Fig. 3 also shows that there is consistency between the galaxies predicted to have on the basis of both their U-B0 colour and their position on the B-R:R-I plane. Metcalfe et al (1996) have further shown that the models also give excellent agreement with the observed distribution of galaxy numbers across the B-R:R-I diagram. Our conclusion is that simple models with an exponentially increasing SFR to can fit the colours and redshifts of the faintest HDF galaxies as well as their angular sizes and counts.

5 Comparison with the Results of Madau et al (1996).
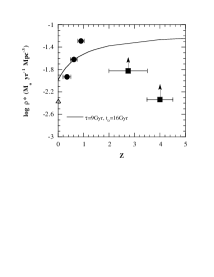
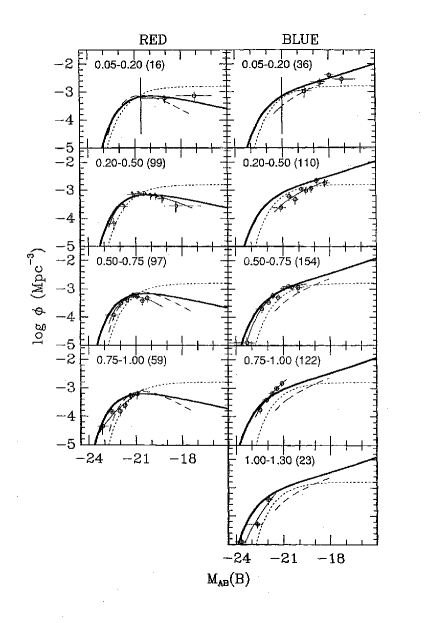
Madau et al (1996) have taken a different approach and, following Cowie (1988) and Lilly et al (1995,1996), have used the fact that the galaxy UV flux density is proportional to the SFR density to obtain estimates of the SFR history of the Universe. They use the CFRS spiral evolving LF of Lilly et al (1995) to determine the 2800Å flux density in the range and the HDF U(F300W) and B dropouts to obtain the 1620Å flux density in the ranges and . Fig. 4 shows their result which implies a peak in the SFR at . Also drawn on Fig. 4 is our =9 Gyr exponentially increasing SFR for spirals which we have shown fits a variety of faint galaxy count, size, colour and redshift data over a wide range of passbands. Clearly the two SFR histories are in contradiction, with the SFR evolution rate of Madau et al increasing markedly faster than our exponential in the range and then quickly decreasing below our rate at . In considering possible reasons for the differences in the range, the first point to be checked is whether our exponential models fit the evolving luminosity functions determined from the CFRS data. Fig. 5 shows a comparison between our predicted luminosity functions for both spirals and ellipticals, assuming , and the CFRS results in the redshift intervals shown out to z=1.3. It can be seen that the agreement is generally excellent. In Fig. 4, the poor agreement in the bin may be because Madau et al have used an LF extrapolated UV density for the point at (L. Tresse priv. comm.); if the unextrapolated luminosity density is used then the result would be a factor of 2 lower and in much better agreement with our result (see Lilly et al 1996 Fig. 1). At lower redshifts the major disagreement arises at z=0 where the SFR of Gallego et al(1995) lies a factor of 2 below our exponential model. This problem may be related to the bright B count normalisation issue, discussed above. Supported by the results of Glazebrook et al (1995a) and Driver et al (1995), we explicitly ignore the low galaxy count at as being possibly contaminated by the effects of local large-scale structure. A further test should soon be available from the 2dF galaxy redshift survey results of Maddox et al (1998, this vol.) where the luminosity function at low may be expected to move in the density rather than the luminosity direction if this large-scale structure hypothesis is correct.
In the range, the reasons for the factor of 3 discrepancy seen in Fig. 4 are also clear. First, if we repeat the Madau et al measurement in the HDF, then we obtain a factor of 1.56 bigger luminosity density at 1620Å for UV drop-out galaxies than these authors, mostly due to the fact that we measure brighter magnitudes for individual galaxies. Second, if Madau et al were to include our dust absorption for spirals, then this would increase their 1620Å luminosity density by another factor of 1.63. Combined, these two effects give a factor of overall which is within 20% of the above factor of 3. In the bin the same two effects apply, with the increasingly serious effects of luminosity function incompleteness also applying at the larger distance. Note that apparently decreasing numbers of galaxies are seen at in our models due to the twin effects of distance and dust (see Metcalfe et al 1996, Fig. 4), even though in these models the galaxy luminosity continues to increase exponentially to !
6 Conclusions.
We have shown that simple Bruzual and Charlot models with an exponentially increasing SFR, fit the HDF faint galaxy count, size, colour and redshift data over a wide range of passbands. In the case, the galaxy count fit is good to whereas in the case, a ‘disappearing dwarf’ population is required to improve the fit at . The HDF galaxy colours imply that ‘faint blue galaxies’ have ; if these are primordial galaxies as previously suggested by Cowie et al (1988), then this implies the epoch of galaxy formation is at . The models suggest an exponentially increasing SFR for spirals with Gyr. Our conclusion is therefore in disagreement with the result of Madau et al (1996) and we have indicated that the different treatments of dust and the local galaxy density, together with photometry errors are among the factors which contribute to the discrepancy.
References
- [1]
- [2] abul, A. & Rees,M.J., 1992, MNRAS, 255, 346
- [3]
- [4] ruzual, A.G. & Charlot, S. 1993, ApJ, 405, 538
- [5]
- [6] ampos, A. & Shanks, T. 1997, MNRAS, 291, 383
- [7]
- [8] owie, L.L. 1988 in The Post Recombination Universe eds. Kaiser, N. & Lasenby, A., Dordrecht:Kluwer, 1
- [9]
- [10] owie, L.L., Hu, E.M. & Songaila, A. 1995, Nature, 377, 603
- [11]
- [12] owie, L.L., Songaila, A., Hu, E.M. & Cohen, J.G. 1996, AJ, 112, 839
- [13]
- [14] river, S.P., Windhorst, R.A., Ostrander, E.J., Keel, W.C., Griffiths, R.E. & Ratnatunga, K.U. 1995, AJ, 449, L23
- [15]
- [16] reeman, K.C. 1970, ApJ,160, 811
- [17]
- [18] allego,J., Zamorano,J., Aragon-Salamanca,A.,& Rego M. 1995, ApJ, 455, L1
- [19]
- [20] lazebrook, K., Ellis, R.S., Santiago, B. & Griffiths, R.E. 1995a, MNRAS, 275, L19
- [21]
- [22] lazebrook, K., Ellis, R.S., Colless, M.M., Broadhurst, T.J., Allington-Smith, J.R. & Tanvir, N.R. 1995b, MNRAS, 273, 157
- [23]
- [24] ronwall, C. & Koo, D.C. 1995, ApJ, 440, L1
- [25]
- [26] oo, D.C. & Kron, R.G. 1992, A&A, 30, 613
- [27]
- [28] illy, S.J., Tresse, L., Hammer, F., Crampton, D., and Le Fevre, O. 1995, ApJ, 455, 108
- [29]
- [30] illy, S.J., Le Fevre, O., Hammer, F. and Crampton, D. 1996 ApJ, 460, L1
- [31]
- [32] adau, P. 1995, ApJ, 441, 18
- [33]
- [34] adau, P., Ferguson, H., Dickinson, M., Giavilisco, M., Steidel, C., Fruchter, A. 1996 MNRAS, 283, 1388
- [35]
- [36] etcalfe, N., Shanks, T., Fong, R. & Jones, L.R. 1991, MNRAS, 249, 481
- [37]
- [38] etcalfe, N., Shanks, T., Fong, R. & Roche, N. 1995, MNRAS, 273, 257
- [39]
- [40] etcalfe, N., Shanks, T.,Campos, A., Gardner, J.P. & Fong, R. 1996, Nature, 210, 10
- [41]
- [42] oche, N., Ratnatunga, K, Griffiths, R.E., Im, M., & Naim, A. 1998, MNRAS, 293, 157
- [43]
- [44] andage A., & Perelemuter, J.-M. 1990, ApJ, 361, 1
- [45]
- [46] hanks, T. 1990, in The Galactic and Extragalactic Background Radiations, S. Bowyer & C. Leinert, Dordrecht:Kluwer, 269
- [47]
- [48] ang, B. 1991, ApJ, 383, L37
- [49]
- [50] illiams, R.E. et al 1996, AJ, 112, 1335
- [51]
- [52] ee, H.K.C. & Green, R.F. 1987, ApJ, 319, 218
- [53]
- [54] oshii, Y. & Takahara, F. 1988, ApJ, 326, 1
- [55]