X-ray Signatures of Evolving Radio Galaxies
Abstract
We present a simple model for an evolving radio galaxy, as it expands into the hot, X–ray emitting interstellar medium (ISM) of its host galaxy or similarly into the hot intracluster medium (ICM) of its host cluster. We solve the governing equations numerically on a grid of model parameters in order to present simple analytical tools for X–ray observations of the shocked shell that is pushed out by the cocoon and the associated cavity in the cluster emission. We apply these tools to the well known example of Perseus A to show that its time-averaged kinetic luminosity probably exceeds , much larger than the estimated current power. We show how future observations can be used to extract useful source parameters such as the average kinetic power and the source age, and discuss detectability of sources at various stages of their lives.
1 Introduction
In recent years there has been much progress in understanding how various classes of powerful extragalactic radio sources can be described in the context of an evolutionary picture. Recent radio surveys have identified classes of powerful sources which are morphologically similar to FR II radio galaxies but appreciably smaller. Sources less than 500 pc in extent have been termed Compact Symmetric Objects (CSOs; Wilkinson et al. 1994), whereas those in the size range 0.5–15 kpc are often referred to as Medium Symmetric Objects (MSOs; Fanti et al. 1995). These classes of small sources, which form approximately one quarter of current flux–limited radio surveys, are thought to correspond to the early stages of full-sized FR-II radio galaxies (Begelman 1996; Readhead, Taylor, & Pearson 1996).
Central to our understanding of these sources is the following theoretical picture (first proposed by Scheuer 1974). Relativistic plasma flows from the central AGN in the form of collimated jets, passes through terminal shocks corresponding to the radio hot-spots, and inflates a ‘cocoon’ which envelops the whole source. This cocoon becomes highly overpressured with respect to the surrounding interstellar/intracluster medium and, hence, drives a strong shock into this material. The swept-up material forms a dense shell separated from the cocoon by a contact discontinuity (see, e.g., Begelman & Cioffi 1989). In the late stages of evolution, the expansion of the cocoon/shell becomes subsonic and the cocoon disrupts and mixes with the ambient medium.
Although low-frequency radio observations do reveal well-defined synchrotron emitting cocoons (e.g., Cygnus-A; Carilli, Perley, & Harris 1994), there is relatively little direct observational evidence for the shocked shell. In principle, there are at least two methods of detecting the shell. Firstly, one can search for the optical line emission that is excited near the shock front (see, e.g., Bicknell & Begelman 1996 for an explanation of the H line emission in M87). Such line emission is very sensitive to unknown parameters such as the fraction of cold material in the surrounding ISM/ICM and the ionization state of that material. Secondly, one can search for the X-ray emission from the shocked ISM/ICM and the associated cavity in the ambient material. Cavities in the ICM have been observed in Cygnus A (Carilli et al. 1994) and Perseus A (Böhringer et al. 1993).
In this paper we will discuss these X-ray signatures of expanding powerful radio sources. We will show how X-ray imaging observations can be used to constrain important source parameters such as the mean kinetic energy output of the object and its age, which are otherwise difficult to constrain directly. We apply our method to current ROSAT HRI data on Perseus A and suggest that this classic source is in fact in a very quiescent state. Furthermore, we develop diagnostics that can be used to interpret the data from the new generation of high resolution X-ray imagers, starting with AXAF in 1998.
2 Description of the Model
2.1 The Dynamical Model
We first outline the basic assumptions used in our model to find a simple, robust description of the early stages of radio galaxy evolution into a surrounding hot medium. Our model is based on the analysis by Reynolds & Begelman (1997). Following this work, we make several simplifying assumptions:
-
1.
Spherical symmetry. For the purpose of this paper it is sufficient to neglect the prolate structure observed in most radio sources, since more detailed hydrodynamics would be required in order to determine the shape of the cocoon beyond a self–similar form (see, e.g., Clarke, Harris, & Carilli 1997). The level of detail required in such simulations and the amount of computing power necessary to explore parameter space in the desired manner would defeat the scope of this paper. The observed elongations are moderate (axial ratios of order 3 in FR II sources, see Carilli et al. 1994). The dependence of our results on the source radius is relatively weak, which makes us confident that the application of our model to non-spherical sources will introduce minor errors only.
-
2.
Purely relativistic gas inside the cocoon (i.e., the adiabatic index in the cocoon is ) and non-relativistic gas in the swept up shell (). The latter assumption is valid in all but the early stages of the most luminous sources, in which the electrons become relativistic.
-
3.
Uniform pressure. We take the pressure in cocoon and shell to be uniform and equal. This is a reasonable approximation in the context of the previous assumption, as the sound speed inside the cocoon () will be significantly higher than the expansion velocity of the shell. The radio hot spots will be overpressured, but we will neglect this complication in the following.
-
4.
A King-model X–ray atmosphere provided by either the host galaxy or the cluster in which the AGN is embedded. The density profile thus behaves as:
(1) where is the central density and is the core radius. can take any positive value; however, for the interface between cocoon and shell to be stable against Rayleigh–Taylor instability we need to assume (see below). is observationally determined by the ratio of the velocity dispersion of the cluster galaxies to the temperature of the cluster gas.
-
5.
Non-radiative shocks. We neglect energy loss due to radiative losses in the equations below. This is justified as long as the cooling time is long compared to the source lifetime, a condition satisfied in the parameter range we consider.
The system is well defined by energy conservation within the cocoon and the shell:
| (2) |
and
| (3) |
and the ram pressure condition at the shock:
| (4) |
Here, and are the shell and cocoon volumes, respectively, is the shock radius, and is the (uniform) interior pressure, which is a function of time. is the kinetic luminosity of the jets feeding the cocoon. A dot indicates a time derivative, i.e., . Equation (4) holds only in the case of supersonic expansion, a condition well satisfied in the early evolutionary stages of our models but which is violated as sources pass a characteristic size. Once a source has decelerated below the ambient sound speed (typically of the order of ) the evolution will resemble an expansion wave rather than a shock wave. The shell will thin out and eventually blend into the ambient medium; the cocoon–shell interface will become unstable and collapse on timescales of order the free fall time. The kinetic luminosity in equation (2) can in general be time dependent to allow for the intermittency suggested by Reynolds & Begelman (1997, see §5.1.1). For now, we will take it to be constant. In a sense, this can be interpreted as a time averaged luminosity .
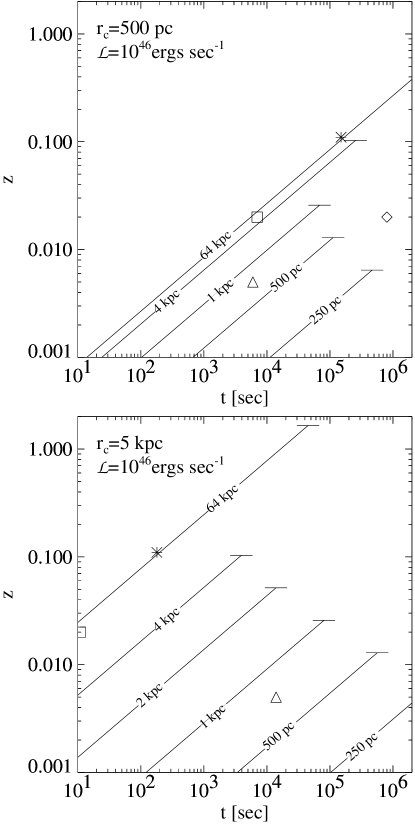
To explore parameter space we have integrated equations (1) to (4) numerically over a time span of years, assuming an initially small source. Our models were calculated over a grid of input parameters and . We used the following parameter values:
-
•
Luminosities ranging from to . We use a fiducial value of throughout the paper except where indicated. Note that luminosities in excess of can be considered unphysical, since they correspond to Eddington luminosities for black hole masses . However, as will be shown below, only the combination is relevant to the dynamics, so we chose to hold fixed and explore a wide range of . Unphysically high values of can be interpreted as relevant to low density sources.
-
•
Core radii in the range of , with a fiducial value of pc, typical of elliptical galaxies.
-
•
We set throughout the rest of the paper, corresponding to for .
-
•
We fixed the central density to be or .
For power-law density distributions and constant, non–zero kinetic luminosity, a self-similar solution to the equations is possible. This solution is a good indicator of how the more general solution scales with the input quantities , , and . A necessary condition for a self-similar solution is that the cocoon radius be a fixed fraction of the shell radius, i.e., . Under these assumptions, equations (2) to (4) yield
| (5) |
| (6) |
where is the shell radius at time , which is defined by
| (7) |
with
| (8) |
It follows from equation (4) and the assumed pressure equilibrium between cocoon and shell that the shell temperature (assuming an ideal, non–relativistic gas) is proportional to the square of the expansion velocity, . Thus, for a given the temperature in the self-similar solution goes as
| (9) |
Equation (6) reveals that solutions for (i.e., in the limit ) are Rayleigh–Taylor unstable, since for those values the cocoon–shell interface is always accelerated and the shell is very dense compared to the cocoon gas.
We can see from the basic set of equations that the only two parameters entering the solution are a radial scale factor ( in the King-profile case, in the self-similar case) and — this statement holds even for arbitrary density profiles. While and can in principle be determined by direct observation, can only be inferred theoretically from observed radio brightnesses. However, this conversion is not trivial and it would be very useful to constrain the kinetic luminosity directly.
2.2 Calculation of the X–Ray Brightness
Because equations (1) to (4) do not specify the density and temperature structure inside the shell itself, we have to make additional assumptions about the radial dependences of and . In this paper we take both variables to be uniform within the shell and use the ideal gas law and mass conservation of the swept up material to convert from the pressure given by equation (4) to the temperature . The shock jump conditions dictate the values of and immediately behind the shock. In the case of a strong shock, the density jumps to , and the temperature jumps to where is the molecular weight. Comparing and to the average shell values reveals that the shell is overdense in most cases, i.e., on average the shell is colder than the most recently shocked material, as is expected due to adiabatic expansion. The density ratio is over most of the parameter range, close enough to the strong shock jump value of 4 to assume near uniformity of within the shell.
We calculate the specific X–ray emissivity due to thermal bremsstrahlung, taking the material to be composed of fully ionized hydrogen only (Rybicki & Lightman 1979):
| (10) |
Since we are only interested in supersonic cases, we will have to discard parameter values for which the temperature drops below the ambient temperature keV at a given radius. Because all high resolution imaging X-ray facilities available in the near future have bandwidths not far above this range, we can assume eV, thus the Gaunt factor is given by the small angle uncertainty principle approximation:
| (11) |
where is Gauss’s number.
We also use equations (10) and (11) to compute the thermal bremsstrahlung emission from the hot galaxy/cluster gas, which we assume to be isothermal throughout the rest of the paper. Clearly, the existence of a massive cold component to the ISM/ICM (as expected if a cooling flow operates) will alter the properties of the solution, in particular the emissivities, as relatively cold, dense material will radiate more efficiently. This aspect will be commented on in §5.1.2.
2.3 Observational Diagnostics
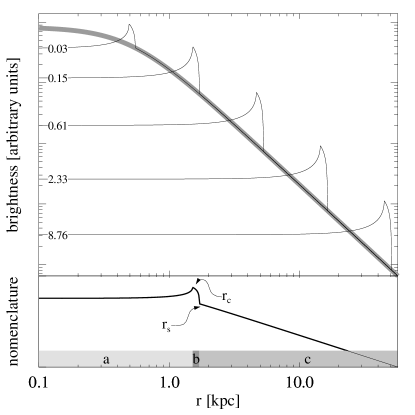
Figure 1 shows the surface brightness results (i.e., the emissivity integrated along the line of sight) of integrating the model with our fiducial parameters. Shown are radial profiles at different times as indicated in the figure. Three basic features are identifiable from the figure, indicated by shadowed regions on the bottom of the plot:
-
a)
The flat part inside the shell, steepening into the bright shell. This component includes all lines of sight penetrating the cocoon, i.e., .
-
b)
The shell. We define this part as all lines of sight outside the cocoon but still penetrating the outer shell, i.e., .
-
c)
The undisturbed cluster emission, i.e., . This part simply tracks the King-profile atmosphere. In our case, since we used an index of , the surface brightness in the power law part goes as and flattens into the core.
We identify the following readily–measurable diagnostics which will be used in the rest of this paper to investigate source parameters:
-
i)
shell-cluster ratio: the ratio of the surface brightness at the line of sight tangential to the cocoon (at ) to the surface brightness at the line of sight tangential to the shell (at ). The emission from the shell (without any contribution from the X–ray atmosphere) is brightest along the former line of sight. The latter is the brightest line of sight outside the region of shell emission. A high contrast is important for the detectability of the source. Since the dynamical solution depends only on , we can see that brightness ratios are also going to depend on and only in the combination , since the density normalization cancels from equation (10). For a purely self-similar solution, we can thus expect this ratio to be proportional to [see equation (9)].
-
ii)
center-cluster ratio: the ratio of the surface brightness at the central line of sight to the surface brightness at the line of sight tangential to the shell. This ratio indicates if the central lines of sight are brightness enhanced or depressed compared to the cluster emission, i.e., if there is an ‘X–ray hole’. Again, since it is a brightness ratio, the center-cluster ratio should depend only on and , and for the self-similar case it should go as . The presence of a strong point-like AGN X-ray component will swamp the cluster emission at the very center. Because the brightness profile is very flat at central lines of sight (as can be seen from Fig. 1), we can avoid the contamination by taking an off-center value for the central surface brightness and will only make a small error.
-
iii)
shell count rate : the integrated count rate from all lines of sight penetrating the shell (in other words: all of areas a and b in Fig. 1), including back– and foreground emission from the X–ray atmosphere. This quantity is easier to determine than the background subtracted emission from just the shell. Notice, however, that since it depends on absolute normalization, both the distance to the object and the density normalization factor into the shell count rate , thus we cannot express it as a function of and only, rather, a factor of remains.
The particular values of these diagnostics for a given source will depend on the assumed instrumental response, as the cluster and shell have different temperatures and thus different spectra. In the following we will use both the ROSAT HRI band and the predicted AXAF ACIS band as indicated.
3 Applications to Existing Data
3.1 Perseus A
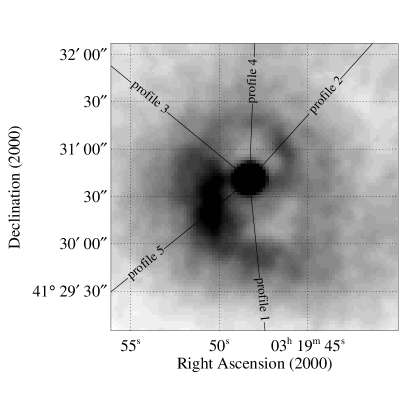
Figure 2 shows a 50 ksec ROSAT HRI exposure of Perseus A111These data were obtained from the LEGACY public archive situated at GSFC (NASA).. Per A is a radio galaxy with an estimated kinetic power of (Pedlar et al. 1990), at a redshift of or . It is located in a dense cluster environment with core densities of , a core radius of kpc, and a temperature of keV (see White & Sarazin 1988). The elliptical shell structure is readily visible from the plot and has been the subject of a paper by Böhringer et al. (1993). The shell semi–minor and semi–major axes are approximately and , respectively, corresponding to and kpc for a Hubble constant of . Because the shell is so well–defined over a significant angle, we are confident that the source is still in supersonic expansion or has only recently crossed the sound barrier. It is also obvious from the image that our assumption of a spherically symmetric, stationary cluster medium is idealized — the bright feature to the east indicates that “cluster weather” has probably had a significant impact on the appearance of the structures. However, the brightness changes are moderate and, keeping in mind those caveats, we feel justified in applying our model to this source with some caution.

We have computed our model for a grid of various and . The cluster gas was assumed to have a temperature of keV and a central density of . The integration was stopped at a size of 16 kpc, the approximate size of the source. We computed the three diagnostics described in §2.3 assuming the ROSAT passband. We also calculated the region in – space for which the source is still supersonic. We find that for a core radius kpc, must exceed , and for a density of , the mean kinetic luminosity must be to satisfy the supersonic condition. The shaded region in Fig. 4 shows the region in parameter space which is forbidden if we insist that the source be supersonic.
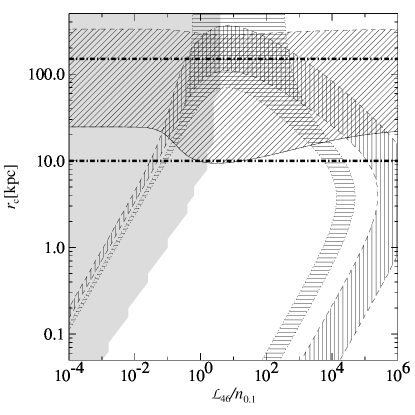
To compare these models to the data for Perseus A, we took radial brightness profiles at several selected locations (shown in Fig. 2 and Fig. 3). We decided to hand-pick these locations rather than assign them randomly due to the complications caused by the “cluster weather” we pointed out earlier. The enhancement at the shell compared to the brightness just outside (i.e., the shell-cluster ratio) is roughly222The HRI resolution is of order 4 arcsec, which is roughly the expected width of the shell at a radius of 40 arcsec (see equation 5), thus we expect the shell to be just marginally resolved. The brightness ratios we extract from the image will thus be lower limits. The core is the dominant feature and will have to be removed. a factor of . The region corresponding to these values in parameter space is shown in Fig. 4 as a vertically hatched area with a dashed border. Approximating the core–subtracted central surface brightness by the brightness minimum between core and shell, we find a brightness ratio of the interior against the cluster immediately outside the shell (i.e., the center-cluster ratio) of . The region in – space compatible with this condition is also shown as a hatched area (horizontal lines) with a dotted border in Fig. 4. We also estimated the total count rate for the shell area (i.e., the shell count rate from §2.3) to be from taking an elliptical ring aperture. To display the predicted total count rate in the same plot we will have to remove a factor of from this value (see section 2.3). Using the assumed density from Sarazin & White (1988) of and Mpc, we can calculate the corresponding diagonally hatched area in Fig. 4.
White & Sarazin (1988) provide an estimate for the core radius of kpc, whereas White, Jones, & Forman (1997) chose a core radius of 150 kpc. These values for are shown as two thick, dash–dotted lines in Fig. 4. Together with the other constraints in Fig. 4, these estimates allow solutions in a range of from to . The lower end of this range can be ruled out by the requirement of supersonic expansion. Keeping in mind the rather large uncertainty introduced by our measurements and in the input parameters we used we find that the different areas in Fig. 4 match up in a self–consistent fashion.
The fact that the average kinetic luminosity is is in itself a very interesting result, as it suggests that the total power output of Per A is significantly higher than the simple estimates based on the equipartition energy content of the cocoons (Pedlar et al. 1990). A possible conclusion might be that equipartition is not a good approximation in this case (the particle pressure will most likely exceed the magnetic pressure). It is interesting to note that a kinetic power estimate based on the conversion factors by Bicknell, Dopita, & O’Dea (1997) suggests that the instantaneous kinetic luminosity is . Hence this may be evidence that Perseus A is in a relatively quiescent state (maybe corresponding to the “off” state of Reynolds & Begelman 1997).
3.2 Other Examples
Another well known source which exhibits an X–ray structure similar to the one we propose here is Cygnus A. This source has been object of an extensive study by Clarke et al. (1996), who ran a 3–dimensional simulation of a jet advancing into a surrounding cluster medium. Even though there are cavities and brightness excesses visible at the center and the rim of the cocoon, respectively, the structure is not nearly as reminiscent of a shocked shell as the one in Per A. It is more than twice as distant as Perseus A and also exhibits a much stronger cooling flow, both of which will tend to make the analysis we suggest harder. We therefore decided not to apply our method to this source, although this would be an excellent target for application of our model once future high resolution data are available.
There are a number of other sources for which suspicious holes in the X–ray morphology have been detected, for example in A4059. However, the data quality for those observations is not satisfactory yet and we will have to postpone a closer analysis of those sources to future work.
4 Application to Future (AXAF) Data
4.1 Detectability of Young Sources
Young sources are generally hard to detect in all wavelength bands, because they are small and evolve quickly, so we expect the local density of young sources to be very small, whereas distant sources will be faint and unresolved. They will be particularly hard to detect if they are in an “off-state” (in the sense of Reynolds & Begelman 1997), in which case radio surveys will most likely select against them, since the radio hot spots fade away quickly and the spectrum becomes very steep. In such a case, optical observations of shock-excited H emission, and the X–ray emission that we are investigating here could provide ways of finding such candidates. The main issue with these sources is detectability.
The best spatial resolution we can hope for in X–ray imagers in the near future is of order 0.5 (AXAF HRC) to 1 arcsec (AXAF ACIS). Thus, in order to resolve a source, it has to subtend more than 2 arcsec on the sky (this assumes that the core, which is by far the dominant feature, will not contaminate more than the central resolution element). But even if a source can be resolved, we shall show that extremely long observing times will be necessary to achieve significant signal–to–noise: even though the surface brightness is higher for small sources, the cluster brightness also rises toward the center.
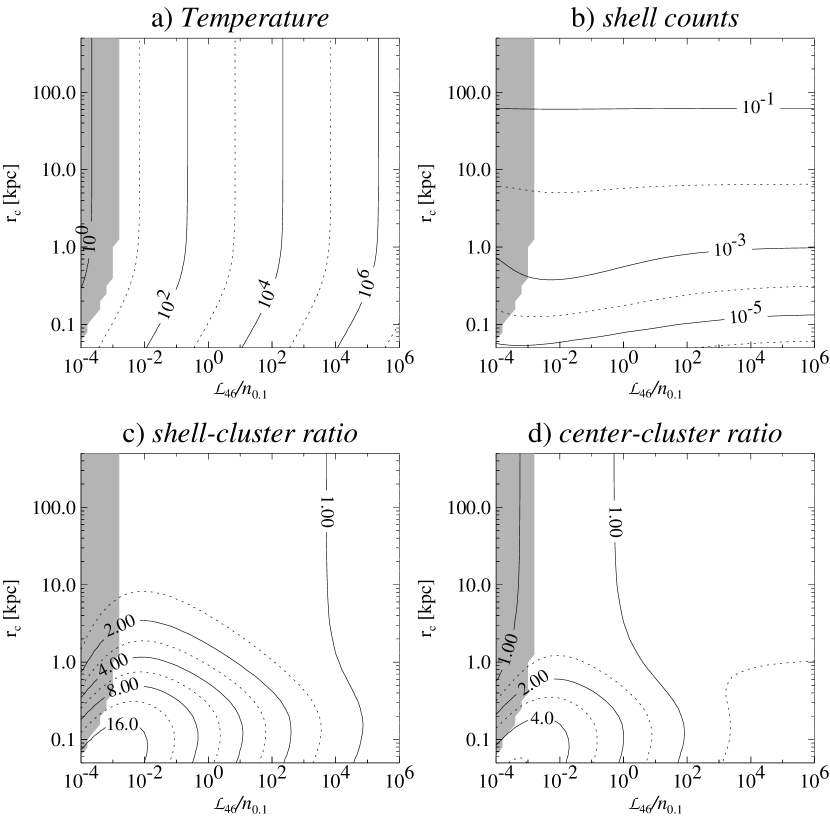
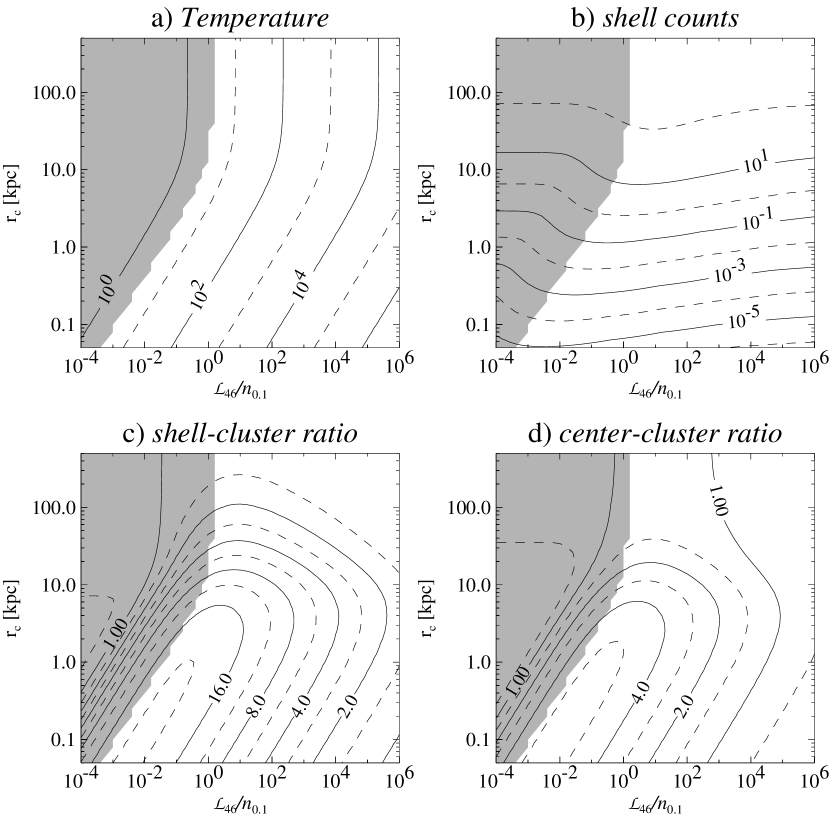
We have calculated the three observational diagnostics from §2.3 for a source of size 500 pc over a grid of 2100 parameter combinations of between 50 pc and 500 kpc and between to , assuming the predicted AXAF ACIS passband. The result is shown in Fig. 5.
The shell temperature is generally higher for small sources. Fig. 5a shows the temperature as a function of and for a shell radius of 500 pc. The hatched region shows the parameter values for which a source of this size at the fiducial cluster temperature of 4 keV has become subsonic. Even at such a young age, we see that low power sources or sources in a very dense environment have already stalled. For higher luminosities the solution is well behaved and basically follows the scaling relations (6) - (8). For very high luminosities/low densities the temperature formally reaches values in excess of 100 keV, beyond which our model is certainly not valid, as we assumed the shell gas to be strictly non–relativistic.
Figure 5b shows the calculated shell count rate for a source at a distance of 100 Mpc, normalized to a central density of , so what is plotted is . Since increases with , sources in dense cluster environments will be much easier to detect. The figure shows that for big and dense clusters we might hope to detect a sufficient number of the photons from the shell.
In addition to a high count rate a second issue for detectability is the contrast of the shell structure (i.e., the shell-cluster ratio). Fig. 5c shows that the shell-cluster ratio is significant over a large range of luminosities and core radii. However, for sources still within the core of the cluster profile the ratio drops and approaches one (i.e. undetectability), since in such cases the line of sight passes through a deep for- and background screen of cluster gas, which tends to swamp out the shell emission. Thus we have a detection dilemma: For sources with large core radii, the count rates are high but the contrast is small. For sources which have broken out of the flat part of the cluster gas, the contrast is high, but the count rates drop. There is an optimal range in core radius and luminosity, which is the larger, the higher the density of the host environment is.
Figure 5d shows the center-cluster ratio to indicate whether we see the cocoon as an X–ray hole or whether it shows a brightness enhancement relative to the cluster gas. In the presence of a bright core, it will presumably be easier to detect a source which shows a central brightness depression against the cluster, since in such a case we will see a dark ring between core and cluster.
We conclude that the redshift constraints and the fact that bright cores will tend to render the shells of barely resolved sources invisible (i.e., the core will swamp out the shell) poses a serious problem for the detectability of young sources. Generally, though, it should be possible to detect close sources in sufficiently dense environments. The detectability constraints have been compiled in Fig. 6. This figure has been constructed as follows. For a given set of source parameters and distance, we calculate the count rate in the ‘observed’ shell (i.e. the annulus between and ), . We also compute the count rate in an annulus of the same area lying just outside the observed shell, . The shell is deemed to have been detected if the brightness profile is seen to possess a jump at . Thus, we calculate the exposure time needed to measure to within 30 per cent (i.e. the exposure time required to demonstrate the non-zero value of delta to 3 sigma confidence). We have used and pc and kpc. In terms of detectability this is a more meaningful quantity than the actual brightness ratio of the two rings, since a source is only detectable if there is a visible jump in brightness across the shell.
4.2 Extended sources
As was explicitly shown in §3.1 for Perseus A, application of our observational diagnostics to a well resolved source can place constraints on the source parameters, especially if the core radius of the cluster is known.
We have computed our three observational diagnostics from §2.3 for a much more extended source of size 16 kpc, as shown in Fig. 7. At this size, only powerful sources will have maintained a supersonic coasting speed, and we can expect the transition between super– and subsonic sources to be a strong indicator of the overall source power, since the break in the data happens at a well defined value of for given core radius and cluster temperature . The temperature shows the dependence on core radius and power we expect from the scaling relations in equations (6)-(8).
Because large sources (by definition) subtend a larger solid angle, their count rates can be much higher than those for small sources, even though the peak shell surface brightness decreases. Since we include the fore– and background cluster emission in the shell count rate (shown in Fig. 7b), this effect becomes even more pronounced. Also, since the shell will likely be resolved and separated from the core, the recognition of the structure itself and the reduction of shell parameters will be simpler than for small sources. The strong dependence of the shell count rate on the core radius for kpc is introduced because we fixed the central density, thus the mass enclosed in a sphere radius (i.e., the swept up mass) increases with the core radius, and so does the shell density. For kpc the dependence is not as strong. In this case, it is produced by the fact that we integrate over a longer line of sight of undisturbed cluster gas within the core for larger . As in the case of Perseus A, we can see that the total count rates are in a comfortable regime to achieve good statistics over a wide parameter range for a cluster with our fiducial density.
If the core radius can be measured by other means (e.g., from optical or X-ray data) and if the redshift of the source is known, the brightness ratios in Fig. 7c and 7d can be used to constrain to no more than two possible values in the ––plane, independently from the total count rate (if the supersonic condition is applicable we can fully constrain this parameter in many cases). In this case, the total count rate can be used to determine and separately, and thus measure the age of the source. Density, age, and in particular the kinetic luminosity will be useful input into jet models.
Since some modern X–ray detectors will have high spectral as well as spatial resolution (e.g., AXAF ACIS), it will be feasible to obtain imaging spectra from resolved sources. In the case of ACIS with a spatial resolution of about 1 arcsec, the source has to be larger than 2 arcsec in radius, thus the redshift restriction will be . In the regime we are interested in the bremsstrahlung emissivity goes as , and since the shell temperatXure is mainly dependent on , spectra are very useful to separate out this parameter. A color–color–image would emphasize regions of different temperature (i.e., the shell versus the undisturbed X-ray atmosphere). For high enough count rates it will even be possible to obtain information about the foreground absorption. Spectra can also give a handle on the composition of the cluster gas from spectral line analysis.
5 Discussion
5.1 Complications
The model we have discussed in the previous sections offers a simple way of probing the radio source structure and determining important parameters. However, since it is a gross oversimplification of reality, we have to discuss several complications.
5.1.1 Intermittency
As recently proposed by Reynolds & Begelman (1997), a large population of sources might be intermittent (i.e., strongly time variable in their kinetic energy output), thereby explaining the observed size distribution of CSOs and MSOs, which shows a previously not understood flattening at small sizes. This could be due to the fact that sources spend a significant fraction of their lifetime in a quiescent state, in which the jets are turned “off”. In such a case, the shell and the cocoon are still expanding, but they will slow down and the shell will thicken. Since a large part of the radio luminosity comes from the radio hot spots, which fade away rapidly, the radio luminosity also decreases. Whereas for large sources the cocoons filled with relativistic plasma provide enough emission to be detected in the radio, young dormant sources will be very hard to detect with radio observations. Thus we might hope to detect the X–ray signatures of such sources.
The major difference that has to be incorporated into our analysis is a time variable instead of in equation (2). Since we integrated the equations numerically, this change presents no difficulty. For simplicity we followed Reynolds & Begelman (1997) in using a “picket-fence function” for . We chose a duty cycle of 10%, i.e., the source is “on” for 10,000 years and “off” for 90,000 years. Depending on the average source power, this happens at different evolutionary stages of the source, thus we should expect to see changes from the previous figures. However, as the source grows, the influence of the intermittency becomes smaller and the behavior approaches the solution for constant luminosity, corresponding to an average power of . For large sources, the results we presented above are therefore essentially unaltered.
5.1.2 Cold Material and Mixing
An important unknown we have neglected to include in our treatment is the possible multi–phase nature of the host ISM/ICM. A cold phase would be hard to detect in an X–ray observation, although it can sometimes be seen via X-ray absorption (Allen et al. 1995, Fabian 1994). Spectra could help in finding multiple temperature components in the continuum emission and abundances of low ionization states from spectral lines and edges. The presence of a cold component could severely alter the dynamics of our expanding shell if both filling factor and mass residing in the cold phase were high enough.
The general picture is that, as the shell reaches the cold blobs of material, a shock is driven into the cold matter with the same strength (i.e., same Mach number) as the shock into the ISM/ICM, since the cold and hot phases are assumed to be in pressure equilibrium. The cold material will therefore be heated and radiate either in the X–ray regime (if it is hot enough) or in the UV/optical. Depending on their sizes, the blobs could either be completely evaporated or their remnants might remain inside the cocoon. It might get shredded by hydrodynamical instabilities, in which case it would mix with the shocked gas and the cocoon plasma. The cold material could cool very efficiently and might radiate away a lot of the shell energy. Future work will concentrate on the optical line emission we would expect to see from such filaments (see, e.g., Bicknell & Begelman 1996).
A related question is the possibility that dynamical instabilities (e.g., Rayleigh-Taylor, Kelvin-Helmholtz) could mix material from the shell and the cocoon, producing pockets of non–relativistic material in the relativistic cocoon. If mixing is strong, a curtain of intermediate temperature material could form and absorb radio emission from the cocoon, thus producing the characteristic spectral shape of Gigahertz Peaked Sources (GPS), as described by Bicknell et al. (1997).
Foreground absorption might also affect our observational diagnostics. Even though the column density of Galactic material is well known in most directions, the presence of a cold component in the host cluster could have a significant effect on the detected signal. As long as the covering factor and the filling factor of the cold component are small, this effect should be negligible. If, however, the cold matter covers a large cross section of the source with sufficient column density, absorption can change the spectral shape and therefore alter not only the total expected count rates but also the brightness ratios, as they depend on the temperature difference between the shell and the cluster. Current data suggest that typical values for the column density of of cold material intrinsic to such sources are of the order , too low to affect the AXAF band significantly.
5.1.3 Density Profile
Clearly, an isothermal King profile is a gross oversimplification of reality, but it should at least provide us with a first order approximation. Introducing two separate King profiles (one for the cluster, one for the Galaxy itself) might provide a better description of reality, but it would also increase the number of free parameters by three , and , all of which would have to be determined by other means to improve this analysis. We decided that the increase in realism would not justify the necessary computing time and the uncertainty as to which values we should chose for the new parameters.
5.2 Conclusions
We have presented a very simple model of the evolution of powerful radio galaxies into a surrounding ISM/ICM in order to make predictions about the detectability and appearance of such sources for future X–ray missions. We assumed uniform pressure, spherical symmetry, and a King profile density distribution in the ambient medium to describe the cocoon and the shell of swept up material and have calculated a grid of models for various source parameters to provide observational diagnostics for high resolution X–ray observations.
We are particularly interested in young sources, since signatures of intermittency are most pronounced in the early stages of source evolution. However, there is only a rather limited range of parameters for which we might hope even to detect the shell for such sources, since the expected count rates are low for all but the most dense environments. Also, contamination by a bright core could make such detections impossible.
Larger sources offer more chances not only for detection but also for analysis and application of our model grid. For a source with known redshift and core radius, it should be possible, at least in principle, to determine the central density of the King profile, the average kinetic source luminosity, and the source age. The knowledge of these parameters could help a great deal in understanding the process of jet formation. As an example we apply our model to a 50 ksec ROSAT HRI observation of Perseus A, and find that the time averaged power most likely exceeds .
References
- (1) Allen, S.W., Fabian, A.C., Edge, A.C., Bohringer, H. & White, D.A. 1995, MNRAS, 275, 741
- (2) Begelman, M.C. 1996, in Cygnus A: Study of a Radio Galaxy, C.L. Carilli & D.E. Harris (eds.) (Cambridge University Press), 209
- (3) Begelman, M.C., Cioffi, D.F. 1989, ApJ, 345, L21
- (4) Bicknell, G.V., & Begelman, M.C. 1996, ApJ, 467, 597
- (5) Bicknell, G.V., Dopita, M.A., & O’Dea, C.P. 1997, ApJ, 485, 112
- (6) Böhringer, H., Voges, W., Fabian, A.C., Edge, A.C., & Neumann, D.M. 1993, MNRAS, 264, L25
- (7) Carilli, C.L., Perley, R.A., Harris, D.E. 1994, MNRAS, 270, 173
- (8) Clarke, D.A., Harris, D.E., Carilli, C.L. 1997, MNRAS, 284, 981
- (9) Daines,S.J., Fabian, A.C., & Thomas, P.A. 1994, MNRAS, 268, 1060
- Fabian (1994) Fabian, A.C. 1994, ARA&A, 32, 227
- (11) Fanti, R., Fanti, C., Dallacasa, D. Schlizzi, R.T., Spencer, R.E., Stanghellini, C., 1995, A&A, 302, 317
- (12) Pedlar, A., Ghataure, R.D., Davies, R.D., Harrison, B.A., Perley, R., Crane, P.C., & Unger, S.W. 1990, MNRAS, 246, 477
- (13) Readhead, A.C.S., Taylor, G.B., & Pearson, T.J. 1996, ApJ, 460,634
- (14) Reynolds, C.S. & Begelman, M.C. 1997, ApJ, 487, L135
- Rybicki & Lightman (1979) Rybicki, G.B., & Lightman, A.P. 1979, Radiative Processes in Astrophysics, (New York: Wiley)
- (16) Scheuer, P.A.G. 1974, MNRAS, 166, 513
- (17) White, D.A., Jones, C., & Forman W. 1997, MNRAS, in press
- White & Sarazin (1988) White, R.E., & Sarazin, C.L. 1988, ApJ, 335, 688
- (19) Wilkinson, P.N., Polatidis, A.G., Readhead, A.C.S., Xu, W., & Pearson, T.J. 1994, ApJ, 432, L87