New active galactic nuclei detected in ROSAT All Sky Survey galaxies
Abstract
We present the first results of a program to identify so far unknown active nuclei (AGN) in galaxies. Candidate galactic nuclei have been selected for optical spectroscopy from a cross-correlation of the ROSAT All Sky Survey (RASS) bright source catalog with optical galaxy catalogs. A high X-ray flux has been used as pointer to galaxies with a high probability to contain active nuclei. Only galaxies have been accepted for the program for which no activity was noted in NED. For many of the galaxies no radial velocity was reported before. The optical spectra demonstrate that the galaxies cover a redshift range of 0.014 to 0.13 and that most of them host active nuclei. For 75% of the 33 candidates the X-ray emission is caused by the AGN. In addition several of the remaining candidates host Seyfert 2/LINER nuclei that, however, most certainly cannot explain the X-ray emission alone.
Three BL Lac objects have been detected serendipitously in galaxy fields that have been followed up by short ROSAT HRI observations to confirm the X-ray galaxy identification with improved position accuracy and point response function. The sources show X-ray to radio flux ratios typical for X-ray selected BL Lac objects.
The results presented in the paper prove the selection strategy as very successful to detect previously unknown AGN of all Seyfert 1 types in nearby galaxies encouraging the extension of this program. The detection of new nearby AGN will be used to initiate a detailed investigation of their multi-wavelength properties and a comparison with the more distant AGN population.
Key Words.:
X-rays: galaxies – Galaxies: active – BL Lacertae objects: general – Surveys1 Introduction
Active galactic nuclei are dominated by huge amounts of energy release from their nuclear regions. This central continuum source is responsible for the photoionization of a central emission-line region. From the optical spectra one can distinguish several types of AGN, e.g. Seyfert galaxies, LINERs, and BL Lac objects. While Seyfert galaxies and LINERs can be classified according to their optical emission lines (see Sect. 4 for the classification scheme used), the main characteristic of BL Lac objects is a featureless optical spectrum; for some BL Lac’s absorption or emission lines become visible during low stages of contiunuum emission in optical spectra with very high S/N ratio.
AGN are well known as strong X-ray emitters often dominating the X-ray emission of the galaxy they are hosted in. This has nicely been demonstrated by Fabbiano et al. (1992) in their analysis of the galaxy content of the Einstein X-ray observatory archive. They systematically searched for the galaxy content of the pointed observations of the Einstein satellite resulting in ’The X-ray Catalog and Atlas of Galaxies’. The catalog comprises 493 galaxies, 450 of which were imaged well, resulting in 238 detections and 212 3 upper limits. While the X-rays of E and S0 galaxies (luminosities up to 1043 erg s-1) are dominated by the emission of a hot interstellar medium, the X-ray emission of spiral galaxies ( erg s-1) is dominated by the integrated output of evolved stellar sources, such as supernova remnants and close accreting binaries with a compact stellar remnant. If an active nucleus is present in E and S0 galaxies their X-ray luminosity is between 1041 erg s-1 and 1043 erg s-1 at the high end of the non-active galaxies of this type. For spiral galaxies hosting an active nucleus the luminosity range extents to above 1044 erg s-1, out-shining non-active spirals by up to more than two orders of magnitude.
The X-ray satellite ROSAT (Trümper 1983) performed the first all sky survey in the soft X-ray band (0.1–2.4 keV) using an imaging telescope. Details of the ROSAT All Sky Survey (RASS) are described by Voges (1993). A RASS bright source catalog has been produced (Voges et al. 1996) by visual screening of the sources found by the detect algorithms in the automatic processing of the RASS data using the standard analysis software system (SASS, Voges et al. 1992). This catalog contains 18 811 sources with a count rate above 0.05 cts s-1. The sources have a detection likelihood of 15 and contain at least 15 source photons. The typical positional accuracy is 30″. We have analyzed the catalog for its galaxy content by correlation with optical galaxy catalogs (Zimmermann et al. 1998).
The results reported above on galaxies in the Einstein energy band (0.2–3.5 keV) also hold for the softer ROSAT band (0.1–2.4 keV) with some restrictions. If the AGN is hidden behind circumnuclear material (for instance due to a circumnuclear disk as proposed in the unification models) they will be heavily absorbed (e.g. AGN in Seyfert (Sy) 2 galaxies and - if present - in LINERs). Therefore, their observed luminosity in the ROSAT band will be highly reduced often preventing the detection of the nucleus. In such a case only secondary – less luminous – effects of present or past activity like anomalous arms, jets, or extended emission from the halo can be measured by ROSAT (see e.g. the detailed ROSAT studies of the nearby Sy2 galaxy NGC 4258 or the LINER and starburst galaxy NGC 3079 (Pietsch et al. 1994, 1998)).
For typical AGN spectra (e.g. power law spectrum with photon index of 2.3) and moderate galactic foreground absorption with NH of a few cm-2 the count rate limit of the RASS bright source catalog corresponds to an unabsorbed flux of erg cm-2 s-1 . This flux limit does not depend strongly on the shape of the spectrum assumed. Therefore at distances of 100 Mpc only galaxies with luminosities above erg s-1 can be detected. Extrapolating the Einstein results for the RASS bright galaxy list we expect to see some E and S0 galaxies to distances of 300 Mpc while non-active spirals should only be visible to 100 Mpc. Galaxy groups and unrecognized clusters of galaxies may also be found in this X-ray luminosity range.
Having these considerations in mind we used the RASS bright galaxy catalog to identify new AGN in galaxies. Our first spectroscopic follow up observations that are reported here demonstrate the success of this procedure. Further optical observations have been granted to this program and will lead to an extended list of new X-ray selected AGN in nearby galaxies. Results will be published in forthcoming papers of this series, that also will discuss sample properties.
2 Sample selection
Cross-correlations of sources detected in the first processing of the RASS with a large galaxy catalog merged from the most important optical catalogs of galaxies (RC2, de Vaucouleurs et al. 1976; RSA, Sandage & Tamman 1981; Tully 1988; UGC, Nilson 1973; ESO, Lauberts 1982) not only showed identifications with nearby galaxies that are well known for their X-ray emission from investigations of the Einstein Observatory observations (see Fabbiano et al. 1992), but in addition with galaxies located in clusters and groups (in which the X-ray emission may originate from hot gas in the cluster or group) and with galaxies known to host an active nucleus. Besides these classes showing exceptionally high X-ray intensities there remained some galaxies where no reasons for the high X-ray emission is known. Several of these galaxies were proposed for short X-ray follow up observations using the ROSAT HRI to verify the origin of the emission from the galaxy. While in some cases the HRI observations clearly demonstrated that the RASS X-rays were extended emission from an early type galaxy or even from a cluster of galaxies, in many cases they showed unresolved emission from the galactic nucleus as expected from an AGN. We selected only these galaxic nuclei for further spectroscopic investigations. Table 1 summarizes the HRI observation dates and exposure times for the galaxies that were included into the optical observing run we report in this paper.
| Object | Date | Active |
|---|---|---|
| time | ||
| ESO 113- G 010 | 28.12.1995 | 2.4 ks |
| 10.06.1996 | 2.7 ks | |
| NGC 427 | 17.06.1996–18.06.1996 | 1.9 ks |
| 10.01.1996 | 3.9 ks | |
| ESO 080- G 005 | 22.04.1996 | 4.3 ks |
| ESO 416- G 002 | 28.01.1995 | 2.3 ks |
| ESO 15- IG 011 | 30.07.1995–17.09.1995 | 6.5 ks |
| ESO 552- G 039 | 21.03.1996 | 1.9 ks |
| ESO 254- G 017 | 29.10.1996–30.10.1996 | 5.5 ks |
| PMN J0623-6436 | 04.07.1995–16.07.1995 | 4.4 ks |
| PMN J0630-2406 | 11.04.1996–12.04.1996 | 4.7 ks |
| ESO 490- IG 026 | 24.10.1996–25.10.1996 | 3.2 ks |
| ESO 209- G 012 | 21.12.1995 | 1.4 ks |
| ESO 602- G 031 | 25.05.1995–26.05.1995 | 4.5 ks |
In a follow up of this work we cross-correlated the improved X-ray source catalog produced from re-processing of the RASS list (RASS bright source catalog, Voges et al. 1996) with the Catalogue of Principal Galaxies PGC (Paturel et al. 1989). The candidate galaxies have been categorized according to their X-ray emission, separating cluster candidates and active galaxies (Zimmermann et al. 1998). Correlations with the NASA Extragalactic Database (NED)111The NASA/IPAC Extragalactic Database is operated by the Jet Propulsion Laboratory, California Institute of Technology, under contract with the National Aeronautics and Space Administration. have been used to accumulate additional information on these galaxies. This procedure resulted in a list of galaxies as candidates for the X-ray sources that show unusually high X-ray fluxes and were not known to host an active nucleus from observations at other wavelengths. No redshifts had been measured for most of these galaxies. To ensure the identification we produced and investigated overlays of the X-ray contours onto optical images extracted from the digitized sky survey (see acknowledgments). To identify galaxies on the optical images with the cataloged ones we over-plotted galaxy positions from the PGC catalog and NED extracts.
\makebox(18.0,22.5)[t]{ }
\makebox(10.6,12.0)[t]{ }
To further characterize these X-ray bright galaxies we obtained optical observations for a subsample of these galaxies in an observing run in November 1996 at the 2.2m ESO/MPG telescope at La Silla. In this investigation we included from our HRI follow up studies of the RASS galaxies three bright nearby field objects (one source near NGC 427 and a source pair centered on ESO 416– G 002) and one candidate optical source where the X-ray emission did not originate from the galaxy (ESO 490– G 008) but from a nearby radio source (PMN J0630-2406). Figure 1 shows X-ray contours for the HRI fields overlaid on digitized optical images. In Fig. 2 the ESO 416– G 002 field is extended to include the source pair mentioned above. All X-ray sources are unresolved and are supposed to be nuclear point sources.
Table 2 summarizes the X-ray identification information for the observed objects. Objects are identified by ROSAT name (col. 1), prefix 1RXS J stands for a RASS determined position (field number of galaxy cross-correlation from Zimmermann et al. (1998) given in col. 2), prefix RX J for a HRI detected source (HRI in col. 2). ROSAT PSPC count rates for the RASS sources or HRI count rates (0.1–2.4 keV) are given in col. 3, object name in col. 4. The optical positions (epoch 2000.0, col. 5 and 6) were derived from the digitized sky survey (Irwin et al. 1994) and should be accurate to better than 2″. Only the position of NGC 1217 was taken from NED as the galaxy information from the digitized sky list was confused by a nearby source. Column 7 gives the separation of the optical position from the X-ray source location. In all cases HRI positions are closer to the optical positions of the galaxies than the RASS positions and the nuclei of the galaxies are within the typical X-ray error circle confirming the identification. For 1RXS J063059.4–240636 the cross-correlation with the PGC catalog suggested ESO 490– G 008 as identification. The position however was off by 83″. The HRI follow up observation rejected the galaxy identification without question and identified a star-like nearby object coinciding with the PSPC and HRI position, which is also identified with the radio source PMN J0630–2406 (see Fig. 1). ESO 120– G 023 and the RASS position have a big offset. From the optical overlay in Zimmermann et al. (1998) it is clear that there is X-ray emission from this source. However, the automatic source detection was confused by X-ray emission from a nearby bright star and therefore, the X-ray count rate and position for 1RXS J055559.4-612438 are not reliable. The RASS bright source catalog also contains information on the extent of the X-ray sources. If one uses a conservative extent criterium (extent likelihood 10 and extent 30”) three of the sources in table 2 are X-ray extended (gal. no. 195, 238, and 276) indicating that the X-ray emission in these galaxies does not, or not exclusively originate from a nuclear source.
3 Optical observations and data reduction
The optical observations were performed with the 2.2m ESO/MPG telescope at La Silla observatory from November 2 to 7, 1996. We used EFOSC2 spectrograph with grism #6 and a 15-wide long slit and the LORAL CCD, which gave a dispersion of 2 Å per pixel, a spectral coverage of 3800–8000 Å, and a spectral resolution of 10 Å. The seeing was typically between 0.8” and 1.5”.
For acquisition we made images with Johnson R filter and an integration time of typically 1 minute. These images were also used to determine the morphological type of the galaxies. For the spectra we chose a position angle (PA) of the slit of 90° (E-W). The only exception was the double nucleus galaxy ESO 120- G 016; in this case the PA of the slit was 60° in order to take spectra of both nuclei simultaneously. The integration times of the spectra are given in Table 3, col. 2.
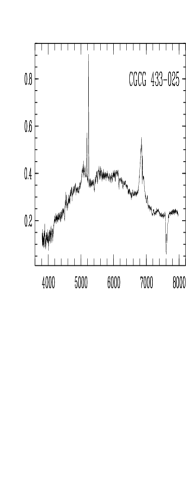
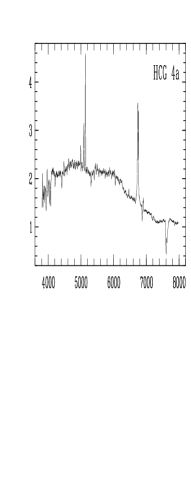
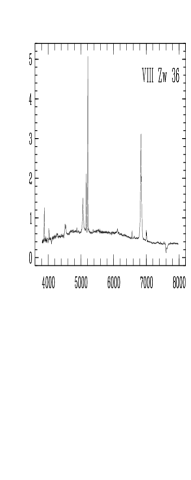
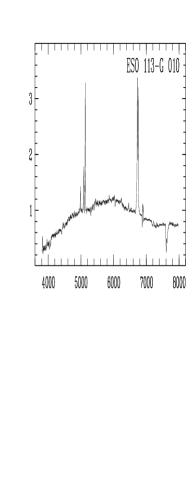
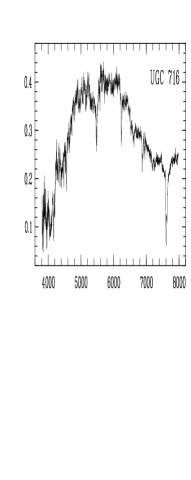
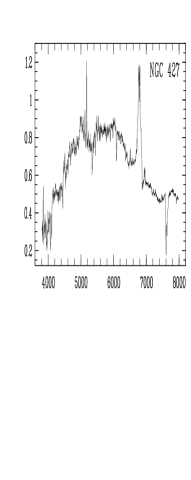
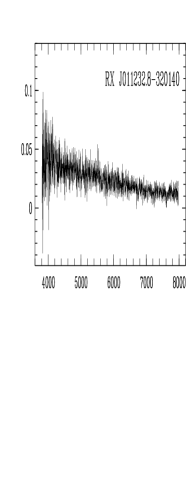
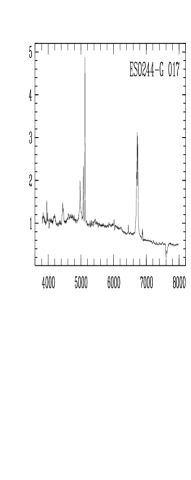
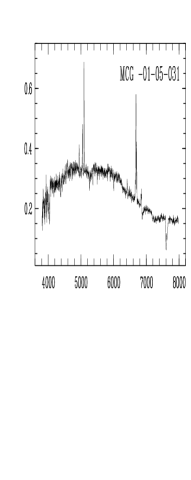
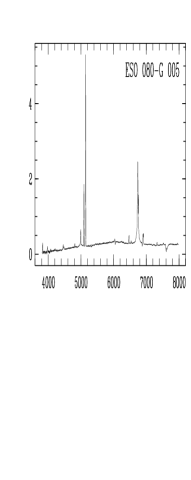
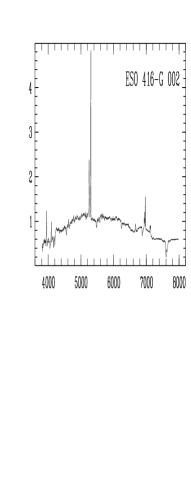
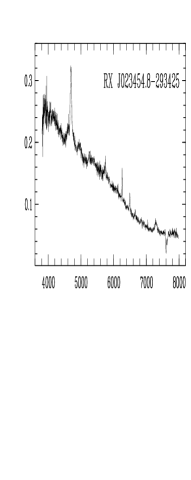
The data were reduced with standard MIDAS procedures. Wavelength calibration was done using He-Ar comparison lamps. The flux calibration was performed by means of the flux standard stars HD 49798 and NGC 7293 (Turnshek et al. 1990). To extract the nuclear spectra we used an aperture of 3″. The spectra are shown in Fig. 3.
![[Uncaptioned image]](/html/astro-ph/9801210/assets/x13.png)
![[Uncaptioned image]](/html/astro-ph/9801210/assets/x14.png)
![[Uncaptioned image]](/html/astro-ph/9801210/assets/x15.png)
![[Uncaptioned image]](/html/astro-ph/9801210/assets/x16.png)
![[Uncaptioned image]](/html/astro-ph/9801210/assets/x17.png)
![[Uncaptioned image]](/html/astro-ph/9801210/assets/x18.png)
![[Uncaptioned image]](/html/astro-ph/9801210/assets/x19.png)
![[Uncaptioned image]](/html/astro-ph/9801210/assets/x20.png)
![[Uncaptioned image]](/html/astro-ph/9801210/assets/x21.png)
![[Uncaptioned image]](/html/astro-ph/9801210/assets/x22.png)
![[Uncaptioned image]](/html/astro-ph/9801210/assets/x23.png)
![[Uncaptioned image]](/html/astro-ph/9801210/assets/x24.png) Fig. 3. continued
Fig. 3. continued
![[Uncaptioned image]](/html/astro-ph/9801210/assets/x25.png)
![[Uncaptioned image]](/html/astro-ph/9801210/assets/x26.png)
![[Uncaptioned image]](/html/astro-ph/9801210/assets/x27.png)
![[Uncaptioned image]](/html/astro-ph/9801210/assets/x28.png)
![[Uncaptioned image]](/html/astro-ph/9801210/assets/x29.png)
![[Uncaptioned image]](/html/astro-ph/9801210/assets/x30.png)
![[Uncaptioned image]](/html/astro-ph/9801210/assets/x31.png)
![[Uncaptioned image]](/html/astro-ph/9801210/assets/x32.png)
![[Uncaptioned image]](/html/astro-ph/9801210/assets/x33.png)
![[Uncaptioned image]](/html/astro-ph/9801210/assets/x34.png)
![[Uncaptioned image]](/html/astro-ph/9801210/assets/x35.png)
![[Uncaptioned image]](/html/astro-ph/9801210/assets/x36.png) Fig. 3. continued
Fig. 3. continued
![[Uncaptioned image]](/html/astro-ph/9801210/assets/x37.png)
![[Uncaptioned image]](/html/astro-ph/9801210/assets/x38.png) Fig. 3. continued
Fig. 3. continued
Redshifts and line parameters were determined by fitting line complexes ([N ii], Hα narrow and broad; [O iii], Hβ narrow and broad, [S ii]) and single lines. Only the narrow Balmer line results have been used for the diagnostic line ratios. For galaxies with strong underlying stellar continua we determined redshifts from absorption lines. With the best accuracy ( km s-1) of all spectra the redshift of the SW nucleus of ESO 122- IG 016 was measured via Mg i 5175 and Na d 5890, 5896, and G band 4304 absorption lines. In a second step all spectra were normalized and rebinned to a logarithmic wavelength scale. Then the redshift was determined via cross-correlation with ESO 122- IG 016 SW. The radial velocities were converted for the Earths motion into a heliocentric system using a MIDAS routine with a code given by Stumpff (1980).
4 Results
The general information for our identification objects in Table 2 is completed by redshift information (col. 8, summary from redshifts from Table 3 as described below) morphological and AGN type (col. 9 and 10) and comments concerning the identification (col. 11). We determined a morphological type from our acquisition images and compared them with the morphological type given in NED (available for most of the brighter galaxies of our sample). If our type differs from the one given in NED we show our type marked by *. NED types are marked by a preceding . AGN type (col. 10) was determined from the optical spectra (see below). Objects for which some AGN information was already available in NED are marked by *. In col. 11 we indicate X-ray variability (X-var, see discussion below) and comment on group or cluster environment, nearby stars and mark by ”ID?”, when the identification of the X-ray source with the galaxy is questionable (see Section 5). NED details and references on sources marked by * in col. 9 to 11 are given in the notes at the bottom of Table 2.
In Table 3 we give results from the analysis of the optical spectra. If there are redshifts available in NED (col. 5, references col. 6) they are within the errors comparable to our redshifts determined from emission (col. 3) and absorption lines (col. 4). If possible, diagnostic line ratios have been determined from fits to the line complexes and are given in columns 7 to 10. If a broad Hα component was present we determined the FWHM from a multicomponent fit (col. 11). For very asymmetric broad line complexes the FWHM was estimated. In col. 12 we comment on special features of the spectra.
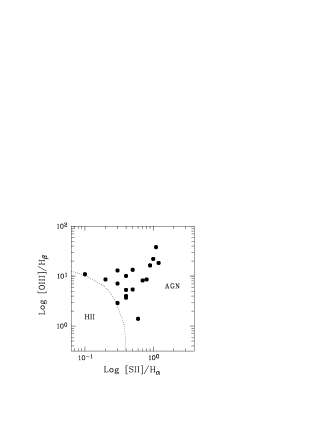
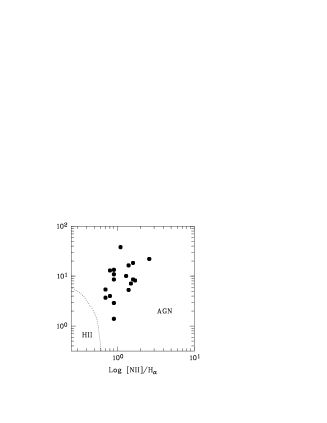
From the spectral fits we classified the objects as AGN using classification diagrams (Fig. 4) following Baldwin et al. (1981). We also determined the AGN type (Table 2, col. 10). Following the Osterbrock (1989) definition we classified the AGN in Seyfert types according to the relative strength of narrow to broad components of the Hα and Hβ emission lines; Seyfert 1 galaxies show only broad components; Seyfert 1.2 to 1.8 galaxies show decreasing but visible broad components and narrow components increasing in relative strength; Seyfert 1.9 galaxies show only a weak broad component in Hα but no broad Hβ component; Seyfert 2 galaxies show only narrow Balmer lines. Narrow line Seyfert 1 galaxies (NLS1) are a peculiar group of Seyferts where (1) the Balmer lines of hydrogen are only slightly broader than the forbidden lines such as [O iii], [N ii] and [S ii]; (2) they often show the presence of emission lines from Fe ii (e.g. the optical multiplets centered at 4570 Å, 5190 Å and 5300 Å) or higher ionization iron lines such as [Fe vii] 6087 and [Fe x] 6375 (these lines are often seen in Seyfert 1 galaxies but generally not in Seyfert 2 galaxies); and (3) the ratio of [O iii] 5007 to Hβ is 3, a level which Shuder & Osterbrock (1981) found to discriminate well Seyfert 1s from Seyfert 2s. The full-width at half-maximum (FWHM) of NLS1 hydrogen Balmer lines is usually in the range 500–1500 km s-1 (cf. Goodrich 1989 and Osterbrock & Pogge 1985). LINERs (Low Ionization Nuclear Emission-line Region) we define - following Ho (1997) - by [O i]/H, [N ii]/H, [S ii]/H and [O iii]/H. For some of our galaxies a separation between a Seyfert 2 or LINER nucleus is not possible because [O iii] and Hβ are not detected. The galaxy nuclei however clearly have to be classified as active as their [S ii]/H and [N ii]/H ratios show. For RX J023454.8-293425 the Hα line is shifted out of our spectral range. The redshift has been derived using Mg ii 2798, [Ne v] 3426, [O ii] 3727, [Ne iii] 3869, 3968 and H lines. From the absolute optical B magnitude it clearly has to be classified as a Quasar. BL Lac candidates are identified from their featureless blue spectra. High fX/fB, detection in the radio, and a starlike appearance in the optical strengthen the BL Lac nature.
We investigated the galaxies from 32 RASS correlations and 4 field sources detected in the HRI follow up observations. Two galaxies and one component of a galaxy with a double nucleus show no emission lines that would indicate activity. We therefore classify them as ”non active”. The other sources are classified as Seyferts (Sy1 (5), Sy1.2 (7), Sy1.5 (3), Sy1.8 (5), Sy1.9 (1), Sy2 (2)), NLS1 (1), LINER (3), Sy2/LINER (4), BL Lac (3), and QSO (1).
The soft X-ray (0.1–2.4 keV), the far-infrared (), and radio (1.4 GHz) fluxes and luminosities are listed in Table 4. A Hubble constant of H0 = 75 km s-1 Mpc-1 and cosmological deceleration parameter of q0 = 0.5 were used throughout. For the objects (col. 1) and redshifts from Table 2 we calculated the distance (col. 3).
To compute the soft X-ray (0.1–2.4 keV) energy flux (col. 6) from the count rate we assumed a power-law spectrum
| (1) |
where is the galaxy’s energy flux between photon energies and . We assume a fixed photon spectral index , which is the typical value found for extragalactic objects with ROSAT (cf. Hasinger et al. 1991, Walter & Fink 1993), and an absorbing column density fixed at the individual Galactic hydrogen value NHgal along the line of sight (col. 2, Dickey & Lockman 1990). With this procedure we do not correct for absorption of the X-rays within the galaxy. Our X-ray fluxes derived with this method therefore have to be understood as lower limits for the intrinsic fluxes if the X-rays are emitted from active nuclei within the galaxies. This absorption effect could be corrected for if one would be able to fit spectra to the individual X-ray sources. While such fits are possible for RASS sources with more than 500 counts the few photons (typically counts for our sample) do not allow such a procedure.
For the 12 sources with follow-up ROSAT HRI observations we used the HRI count rate to determine the X-ray flux. For 3 sources PSPC and HRI determined fluxes correspond within 20% (ESO 15- IG 011, PMN J0630-2406, ESO 209- G 012), for 7 sources the HRI flux is significantly lower (NGC 427, ESO 080- G 005, ESO 416- G 002, ESO 254- G 017, PMN J0623-6436, ESO 490- IG 026, and ESO 602- G 031 by a factor of 0.6, 0.4, 0.4, 0.7, 0.7, 0.6, and 0.2, respectively), and for 2 sources higher (ESO 113- G 010 and ESO 552- G 039 by 2.2 and 2.0). Several explanations can be put forward for the derived flux differences. The HRI rate could be lower, because in the RASS analysis additional unresolved emission is attributed to the source that is resolved by the HRI. Such additional emission could result from an extended galaxy halo or from other nearby X-ray sources or from diffuse X-ray emission due to galaxy cluster membership of our target. A careful check of the PSPC and HRI images most certainly rules out this possibility for all 5 sources. On the other hand HRI and PSPC fluxes could differ because we did not assume the appropriate spectral model for the flux determination. While this effect could explain reduced HRI fluxes by up to a factor of two it can not explain the extreme variations and especially the strong HRI flux increase detected in two sources. The most probable explanation for the flux differences therefore is true source variability. This explanation is also consistent with the fact that we see more often a flux decrease than an increase from RASS to HRI observations because most of the sources lie close to our detection threshold for the RASS. X-ray flux variability on these time scales is a common feature for active galactic nuclei (see e.g. Ulrich et al. 1997).
For two fields the HRI observations have been split in two observation intervals separated by half a year (see Table 1). This allowed to investigate variability on this time scale using the same detector and therefore avoiding the cross calibration problems mentioned above. The HRI flux of ESO 113- G 010 decreased by a factor of 3 between the observations. While the average HRI flux was a factor of 2.2 above the PSPC (see above) during December 1995 the HRI flux was higher by even a factor of 3.6 and dropped till June 1996, when it was however still higher than the PSPC flux by a factor of 1.3. The HRI flux of NGC 427 did not vary by more than 15% between the observations in January and June 1996 but stayed at the lower intensity with respect to the PSPC observation. The BL Lac candidate in the same field (RX J011219.5-320140) however showed an increase in flux between the observations by a factor of 1.5.
The optical B magnitude and the log of the monochromatic flux at the optical band at 4400 Å(using the relation given by Allen (1976), p. 174) are listed in columns 4 and 5, respectively. The absolute B-magnitude is given in column 9. Column 7 gives the integrated 40-120 flux and column 8 the monochromatic 1.4 GHz radio flux from the NVSS survey (Condon et al. 1996) or (if not available) the 4.85 GHz radio flux from NED, if available.
The total far-infrared (40-120m) fluxes, , were computed with the formula of Helou et al. (1985) from the IRAS 60 m and 100 m band fluxes taken from NED:
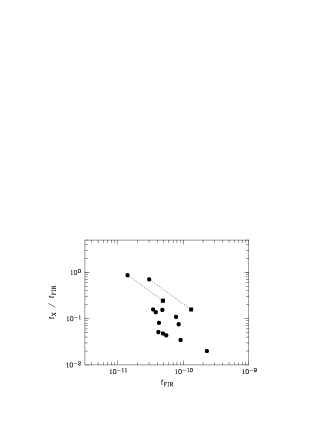
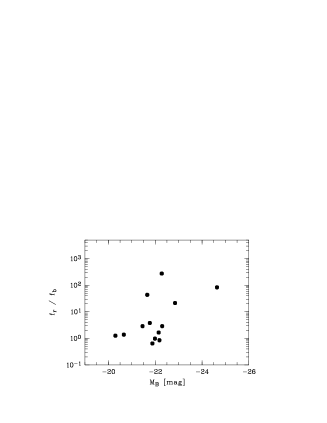
where and are given in Jansky. The soft X-ray, optical, far-infrared and radio fluxes were converted to luminosities using equation (7) of Schmidt & Green (1986) (col. 10 to 13). Column 14 to 17 give flux ratios between different bands. Flux ratios have been plotted as functions of absolute B magnitude and far infrared flux in Fig. 5.
5 Discussion


As shown in the last section the X-ray selected galaxies which were followed up optically cover redshifts from 0.014 to 0.13. Most of them turn out to harvest an active nucleus or even merging nuclei where at least one component is active. It is, however, not clear yet if these active nuclei, that we have classified using optical, radio and infrared data, really are the origin of the X-rays.
We have several ways to attack this problem and can propose solutions for individual galaxies:
-
1.
We can use the extent information from the RASS catalog. If a source is extended the major part of the X-ray emission will not originate from the nucleus. This is the case for AM 0426-625 S, ESO 120- G 017, and ESO 122- IG 016. From the optical spectra their nuclei have been classified as Sy2/LINER, non active, and LINER+non active, respectively. From this type of nucleus X-ray emission in the ROSAT band should be highly absorbed. The extended X-rays may originate from hot gas in the early type galaxies or in the groups they are member of.
-
2.
An HRI detection of a source which is centered on the nucleus and is unresolved strongly argues for a nuclear origin of the X-rays. This is the case for 9 sources (see Table 2). In addition we searched the ROSAT public archive for additional coverage of the galaxies in our sample. The only galaxy covered is UGC 716. It was observed serendipitously at 10′ offset from the center of an HRI pointing in January 1996. The X-ray source is clearly extended and most likely represents emission from a galaxy cluster.
-
3.
Time variability of the X-ray flux rules out emission from extended gas clouds and strongly argues for an AGN. As described above the comparison of the HRI and RASS fluxes for 9 sources indicates time variability supporting the AGN origin of the X-rays. This further points at an AGN identification in addition to the HRI point source detection argument in 2.
-
4.
We can compare the measured X-ray luminosity with X-ray luminosities expected from the AGN / morphology type of the galaxy or for the galaxy surroundings (group or cluster environment). While Seyfert 2 and LINER nuclei should not have luminosities in the ROSAT band above 1041 erg s-1 the hot gas in early type galaxies or in groups or cluster may be more luminous by factors of 100 or 1000. This would argue for an origin of the X-ray emission from the surrounding group or cluster as listed in NED for UGC 716, MCG -01-05-031, AM 0426-625 S, ESO 120- G 023, ESO 254- G 017, and ESO 122- IG 016. Hot gas in the early type host galaxy could explain the X-ray emission in IC 1867, NGC 1217, AM 0426-625 S, ESO 120- G 023, and UGC 12492. There are, however, galaxies for which these arguments to exclude a Sy2/LINER nucleus as the origin of the X-ray emission do not hold. HRI observations of ESO 254- G 017 show a X-ray variable nuclear point source and strongly argue for an nuclear origin of the X-ray emission (see 2 and 3 above). The optical spectrum of the nucleus is heavily disturbed by the host galaxy spectrum, but does not show any broad Balmer component that would indicate a Sy1 type. For the Sy2 galaxy UGC 3134 neither the morphological type (SBc) nor a known group or cluster surrounding can explain the X-ray luminosity of erg s-1. HRI observations could clarify the interpretation if we see emission from a nuclear source.
-
5.
We have performed a line fitting analysis of the prominent optical emission lines. The location of our objects in the diagnostic diagrams of Osterbrock (1989) clearly demonstrates their AGN nature (cf. Fig. 4). The flux ratios plotted in Fig. 5 are an additional indication for the AGN character of the objects. Using the nomograph shown in Fig. 1 of Maccacaro et al. (1988), one sees that the combined X-ray flux and optical B-magnitude agree well with those expected from AGN (cf. the left panel of Fig. 5). The middle panel of Fig. 5 gives the ratio of the X-ray to far-infrared (40-120 ) flux. All of the objects show flux ratios above a value of 0.01. As shown in Fig. 5 of Boller et al. (1997) most AGN exhibit flux ratios above that value. Theoretical models addressing the X-ray and far-infrared emission of galaxies in different states of nuclear activity suggest that flux ratios above about 0.01 require AGN activity, whereas values below about 0.01 can be explained by starburst activity (Bertoldi & Boller 1998). Using the formalism of Kellermann et al. (1989, see their Fig. 4) one can quantify the radio-quiet or radio-loud nature of our objects. The ratio of the radio to optical flux density for most objects is below 10 (right panel of Fig. 5) and objects below such a value are considered as radio-quiet (of course, there is no strict dividing line between radio-quiet and radio-loud objects and there is a continuous increase of the radio activity with increasing radio to optical flux ratio). We consider the six objects with flux ratios above 10 as radio-loud and the most intense radio emitters in our sample (RX J011232.8-320140 and NGC 1218) show a radio to optical flux ratio of about 275.
The considerations above propose 25 AGN identifications and 1 dubious case for the 33 X-ray sources. This represents a success rate of about 75% for detecting active nuclei using our selection criteria. If we do not consider the HRI pre-selection we still have a success rate of 50%.
Of specific interest are the 3 BL Lac objects identified (one as the central source of the field and two nearby sources). We tried in vain to identify possible optical absorption lines to get a handle on the distance of the objects. Therefore no luminosity determination was possible. Their fx/fr and fo/fr values clearly put them in the regime of X-ray selected BL Lac objects (see Fig. 11 of Brinkmann et al. (1995)).
The results of this first optical follow up observing run have demonstrated that our selection strategy from the RASS bright source catalog / galaxy correlations is rather efficient in detecting new active galactic nuclei. The results encourage further optical observations that will be reported in future papers of this series.
The detection of the more than 100 new members of the nearby AGN population expected from our program will allow to attack several important questions and will stimulate further investigations: (i) sub-arcsec near-infrared imaging and spectroscopy to study the physical conditions in the broad and narrow line regions; (ii) as already a few of our objects are strong Fe ii emitters (MCG -02-14-009, PMN J0623-6436, MCG -02-59-006) the sample offers new possibilities to study the Fe ii excitation mechanisms, which are expected to be connected to the strength of the X-ray emission; (iii) high resolution optical spectroscopy of our objects with asymmetric broad Balmer lines (VIII Zw 36, ESO 416- G 002, ESO 552- G 039, PMN J0623-6436, ESO 419- IG 026, ESO 209- G 012) will allow to further constrain broad-line region models; (iiii) Future X-ray missions will allow sub-arcsec imaging of the nuclear regions (AXAF) and detailed spectral modeling (AXAF, XMM).
Acknowledgements.
This research has made use of the SIMBAD database operated at CDS, Strasbourg, France and of the NASA/IPAC Extragalactic Database (NED) which is operated by the Jet Propulsion Laboratory, California Institute of Technology, under contract with the National Aeronautics and Space Administration. To overlay the X-ray data we used programs kindly provided by Andreas Vogler and images based on photographic data of the National Geographic Society – Palomar Observatory Sky Survey (NGS-POSS) obtained using the Oschin Telescope on Palomar Mountain and the UK Schmidt Telescope. The NGS-POSS was funded by a grant from the National Geographic Society to the California Institute of Technology. The UK Schmidt Telescope was operated by the Royal Observatory Edinburgh, with funding from the UK Science and Engineering Research Council, until 1988 June, and thereafter by the Anglo-Australian Observatory. Original plate material is copyright (c) the Royal Observatory Edinburgh and the Anglo-Australian Observatory. The plates were processed into the present compressed digital form with their permission. The Digitized Sky Survey was produced at the Space Telescope Science Institute under US Government grant NAG W-2166. The ROSAT project is supported by the German Bundesministerium für Bildung, Wissenschaft, Forschung und Technologie (BMBF/DARA) and by the Max-Planck-Gesellschaft (MPG). This work has been partially supported by Deutsche Agentur für Raumfahrtangelegenheiten (DARA) grant 50 OR 9408 9.References
- (1) Allen, C.W., 1976, ’Astrophysical Quantities’, The Athlone Press, London, p. 198
- (2) Baldwin, J.A., Phillips, M.M, Terlevich, R., 1981, PASP 93, 5
- (3) Bertoldi F., Boller Th., 1998, in preparation
- (4) Boller Th., Bertoldi F., Dennefeld M., Voges W., 1997, MPE Preprint 423, A&AS, in press
- (5) Brinkmann W., Siebert J., Reich W., et al., 1995, A&AS 109, 147
- (6) Brissenden R.J.V., Tuohy I.R., Remillard R.A., et al., 1987, Proc.Astr.Soc.Austr. 7, 212
- (7) Condon J.J., et al. 1996, in preparation
- (8) Coziol R., Demers S., Pena M., et al., 1993, AJ 105, 35
- (9) Coziol R., Demers S., Pena M., Barneoud R., 1994, AJ 108, 405
- (10) Da Costa L.N., Pellegrini P.S., Davis M., et al., 1991, ApJS 75, 935
- (11) de Vaucouleurs G., de Vaucouleurs A., Corwin H.G.Jr., 1976, second reference catalogue of bright galaxies, Austin, University of Texas Press
- (12) de Vaucouleurs G.H., et al., 1991, third reference catalogue of bright galaxies, version 3.9
- (13) Dickey J.M., Lockman F.J., 1990, ARA&A 28, 215
- (14) Fabbiano G., Kim G.-W., Trinchieri G., 1992, ApJS 80, 531
- (15) Fisher K.B., Huchra J.P., Strauss M.A., et al., 1995, ApJS 100, 69
- (16) Goodrich R.W., 1989, ApJ 342, 224
- (17) Hasinger G., Trümper J., Schmidt M., 1991, A&A 246, L2
- (18) Helou G., Soifer B.T., Rowan-Robinson M., 1985, ApJ 298, L7
- (19) Ho L., 1997, ASP Conf. Ser. 103, 105
- (20) Irwin M., Maddox S., McMahon R., 1994, Spectrum 2, 14
- (21) Keel W.C., de Grijp M.H.K., Miley G.K., 1988, A&A 203, 250
- (22) Kellermann K.I., Sramek R., Schmidt M., Shaffer D.B., Green R., 1989, AJ 98, 1195
- (23) Lauberts A., 1982, ESO/Uppsala survey of the ESO (B) atlas, Garching bei München, FRG: European Southern Observatory
- (24) Maccacaro T., Gioia I.M., Wolter A., Zamorani G., Stocke J.T., 1988, ApJ 326, 680
- (25) Maia M.A.G., Da Costa L.N., Latham D.W., 1989, ApJS 69, 809
- (26) Maza J., Ruiz M.T., Gonzalez L.E., Wischnjewsky M., 1992, Rev.Mex.Astron.Astrofis. 24, 147
- (27) Nilson P., 1973, Uppsala general catalog of galaxies,Uppsala, Sweden: Societatis scientiarum Upsaliensis
- (28) Osterbrock, D.E., 1989, Astrophysics of Gaseous Nebulae and Active Galactic Nuclei (University Science Books)
- (29) Osterbrock D.E., Pogge R.W., 1985, ApJ 297, 166
- (30) Paturel G., Fouque P., Bottinelli L., Gouguenheim L., 1989, A&AS 80, 299
- (31) Pietsch W., Vogler A., Kahabka P., Jain A., Klein U., 1994, A&A 284, 386
- (32) Pietsch W., Trinchieri G., Vogler A., 1998, A&A, in preparation
- (33) Ramella M., Focardi P., Geller M.J., 1996, A&A 312, 745
- (34) Sandage A.R., Tamman G.A., 1981, Revised Shapley-Ames catalogue of galaxies, Washington: Carnegie Institution of Washington
- (35) Schmidt M., Green R.F., 1986, ApJ 305, 68
- (36) Sekiguchi K., Wolstencroft R.D., 1993, MNRAS 263, 349
- (37) Shuder J.M., Osterbrock D.E., 1981, ApJ, 250, 55
- (38) Stocke J.T., Morris S.L., Gioia I.M., et al., 1991, ApJS 76, 813
- (39) Stumpff P., 1980, A&AS 41, 1
- (40) Takata T., Yamada T., Saito M., Chamaraux P., Kazes I., 1994, A&AS 104, 529
- (41) Trümper J., 1983, Adv. Space Res. 2, 241
- (42) Tully R.B., 1988, Nearby Galaxies Catalog, Cambridge University Press, Cambridge
- (43) Turnshek D.A., Bohlin R.L., Williamson R.L., et al., 1990, AJ 99, 1243
- (44) Ulrich M.-H., Maraschi L., Urry C.M., 1997, ARAA 35, in print
- (45) Voges W., 1993, AdSpR 13, 391
- (46) Voges W., Gruber R., Paul J., et al., 1992, in: Guyenne T.D., Hunt J.J. (eds.), Proc. European ISY conference, ESA ISY-3, p.223
- (47) Voges W., Aschenbach B., Boller Th., et al., 1996, IAU Circ. 6420
- (48) Walter R., Fink H.H., 1993, A&A 274, 105
- (49) Yentis D.J., Cruddace R.G., Gursky H., et al., 1992, in: H.T. MacGillivray, E.B. Thomson (eds.) Proc. on ”Digitized Optical Sky Surveys”, Kluwer Acad. Publ., p.67
- (50) Zabludoff A.I., Geller M.J., Huchra J.P., Vogeley M.S., 1993, AJ 106, 1273
- (51) Zimmermann H.-U., et al., 1998, in preparation (GAL-BSC)
Table 2. X-ray identification information
| ROSAT name | Gal. | Count rate | Name | RA, Dec (J2000.0) | Redshift | Morph. type | AGN type | Comment | ||
|---|---|---|---|---|---|---|---|---|---|---|
| 1RXS J or RX J | No. | (cts s-1) | (h m s) | (d m s) | (”) | (km s-1) | ||||
| (1) | (2) | (3) | (4) | (5) | (6) | (7) | (8) | (9) | (10) | (11) |
| 000805.6145027 | 13 | CGCG 433-025 | 0 08 05.6 | 14 50 23 | 4 | Sab | Sy1 | |||
| 003413.7212619 | 30 | HCG 4a | 0 34 13.5 | -21 26 20 | 3 | ∗SBCbc pec: | ∗Sy1.8 | |||
| 004236.9104919 | 38 | VIII Zw 36 | 0 42 36.7 | -10 49 22 | 4 | E2 | Sy1.5 | |||
| 010517.5582618 | 56 | ESO 113- G 010 | 1 05 16.8 | -58 26 13 | 8 | (R_1)SB(rl)0/a | Sy1.8 | X-var | ||
| 010517.3582615 | HRI | ESO 113- G 010 | 4 | |||||||
| 010918.0+131011 | 62 | UGC 716 | 1 09 18.4 | 13 10 08 | 7 | S0 | non active | ∗in cl, ID? | ||
| 011219.5320338 | 68 | NGC 427 | 1 12 19.1 | -32 03 44 | 8 | (R_1R’_2?)SB(r)a | Sy1.2 | X-var | ||
| 011219.3320340 | HRI | NGC 427 | 5 | |||||||
| 011232.8320140 | HRI | 1 12 32.6 | -32 01 44 | 5 | star like | BL Lac | X-var | |||
| 012018.8440748 | 72 | ESO 244- G 017 | 1 20 19.6 | -44 07 43 | 10 | (R:)SB(r)a | ∗Sy1.5 | |||
| 014526.6034945 | 99 | MCG -01-05-031 | 1 45 25.3 | -03 49 39 | 21 | Sbc pec | Sy2 | in cl, ID? | ||
| 014739.5660952 | 101 | ESO 080- G 005 | 1 47 39.5 | -66 09 49 | 3 | ∗Irr | Sy1.8 | X-var | ||
| 014739.2660946 | HRI | ESO 080- G 005 | 3 | |||||||
| 023513.9293616 | 132 | ESO 416- G 002 | 2 35 13.4 | -29 36 18 | 7 | Sa: | Sy1.9 | X-var | ||
| 023513.5293615 | HRI | ESO 416- G 002 | 3 | |||||||
| 023454.8293425 | HRI | 2 34 54.5 | -29 34 28 | 5 | star like | QSO | ||||
| 023536.8293842 | HRI | PHL 1389 | 2 35 36.6 | -29 38 44 | 3 | star like | BL Lac | |||
| 025552.4+091853 | 144 | IC 1867 | 2 55 52.2 | 9 18 42 | 11 | E3 | Sy2/LINER | in group, ID? | ||
| 030606.3390212 | 151 | NGC 1217 | 3 06 05.9 | -39 02 10 | 5 | ∗S0/a | LINER | in cl, ID? | ||
| 030825.9+040637 | 152 | NGC 1218 | 3 08 26.3 | 4 06 40 | 6 | S0/a | Sy1 | |||
| 034203.8211428 | 174 | ESO 548- G 081 | 3 42 02.8 | -21 14 26 | 14 | ∗SBa pec | ∗Sy1 | |||
| 042710.2624712 | 195 | AM 0426-625 S | 4 27 12.5 | -62 47 09 | 16 | Gpair, S0 pec | Sy2/LINER | ∗in group, ID? | ||
| 043520.2780150 | 201 | ESO 15- IG 011 | 4 35 16.2 | -78 01 57 | 14 | Gpair, S0: pec | ∗Sy1.8 + LINER | merger, DN | ||
| 043516.9780157 | HRI | ESO 15- IG 011 | 3 | |||||||
| 043813.8104740 | 203 | MCG -02-12-050 | 4 38 13.8 | -10 47 45 | 5 | SBb | Sy1.2 | |||
| 044148.1011806 | 205 | UGC 3134 | 4 41 48.3 | -01 18 10 | 5 | ∗SBc | Sy2 | |||
| 045142.3034834 | 210 | MCG -01-13-025 | 4 51 41.4 | -03 48 34 | 15 | ∗SB0 | ∗Sy1.2 | |||
| 045840.4215922 | 214 | ESO 552- G 039 | 4 58 40.3 | -21 59 32 | 4 | ∗SBa | Sy1.2 | X-var, in cl | ||
| 045840.2215928 | HRI | ESO 552- G 039 | 4 | |||||||
| 051621.5103341 | 223 | MCG -02-14-009 | 5 16 21.2 | -10 33 40 | 4 | SBb | Sy1 | |||
| 055559.4612438 | 238 | ESO 120- G 023 | 5 55 52.6 | -61 24 14 | 55 | SA0- | non active | pos? in group, ID? | ||
| 060635.4472957 | 244 | ESO 254- G 017 | 6 06 35.8 | -47 29 56 | 4 | ∗E2 pec | Sy2/LINER | X-var, in cl | ||
| 060635.9473001 | HRI | ESO 254- G 017 | 5 | |||||||
| 062307.7643618 | 254 | PMN J0623-6436 | 6 23 07.7 | -64 36 21 | 3 | ∗S0/a | ∗Sy1 | X-var | ||
| 062308.0643619 | HRI | PMN J0623-6436 | 3 | |||||||
| 063059.7240636 | 258 | PMN J0630-2406 | 6 30 59.4 | -24 06 46 | 11 | star like | BL Lac | |||
| 063059.4240643 | HRI | PMN J0630-2406 | 3 | |||||||
| 064011.5255337 | 261 | ESO 490- IG 026 | 6 40 11.8 | -25 53 43 | 7 | pec | Sy1.2 | ∗X-var, merger | ||
| 064011.9255343 | HRI | ESO 490- IG 026 | 1 | |||||||
| 071204.2603005 | 276 | ESO 122- IG 016 | 7 12 03.2 | -60 30 30 | 26 | ∗Irr | LINER + non active | ∗DN, in group, ID? | ||
| 080157.7494639 | 299 | ESO 209- G 012 | 8 01 57.9 | -49 46 42 | 4 | ∗Sa pec | Sy1.5 | |||
| 080157.8494645 | HRI | ESO 209- G 012 | 4 | |||||||
| 215656.8113920 | 826 | NGC 7158 | 21 56 56.5 | -11 39 32 | 13 | SBa pec | NLS1 | |||
| 223656.5221321 | 849 | ESO 602- G 031 | 22 36 55.9 | -22 13 12 | 13 | ∗Sb | ∗Sy1.8 | X-var | ||
| 223655.8221314 | HRI | ESO 602- G 031 | 2 | |||||||
| 230921.5+004540 | 867 | IC 5287 | 23 09 20.3 | 0 45 23 | 25 | (R’)SB(r)b | Sy1.2 | |||
| 231357.7113027 | 870 | MCG -02-59-006 | 23 13 57.0 | -11 30 19 | 14 | SBc pec: | Sy1.2 | |||
| 231853.1010338 | 876 | UGC 12492 | 23 18 53.7 | -01 03 38 | 9 | S0 | Sy2/LINER | |||
Position or morphological type from NED
col 11: DN = double nucleus, ID? = identification questionable, in cl = in cluster, pos? = X-ray
position questionable, X-var = indication for X-ray variability
∗ Notes to individual galaxies:
HCG 4a (R’_1)SB(rl)bc, member of HCG 4,
candidate for AGN (Coziol et al. 1993)
UGC 716 in Abell 150, faint foreground star 3” north of nucleus
ESO 244- G 017 Sy1 candidate (Maia et al. 1989), Sy1 (Maza & Ruiz 1992)
MCG -01-05-031 SB(rs)bc pec:
ESO 080- G 005 S…
NGC 1217 SA:(s:)a pec
ESO 548- G 081 SB(rs)a pec?, Sy1 (Stocke et al. 1991)
AM 0426-625 Pair of EGal, HD28667 nearby may contribute to X-ray emission
ESO 15- IG 011 interacting pair with plumes north,
Sy1 single category object, only one nuclear component investigated (Sekiguchi & Wolstencroft 1993).
We identify a Sy1 nucleus (center) cz=()km s-1
and LINER (south) cz=()km s-1
UGC 3134 SAB(s)c
MCG -01-13-025 SAB(s)0+ pec:, Sy1 (Brissenden et al. 1987)
ESO 52- G 039 S…
ESO 120- G 023 bright star 3’ SW influences X-ray position and count rate, brightest in group
ESO 254- G 017 E2? pec
PMN J0623-6436 ??Extended??, Sy1 with very strong Fe ii emission (Keel et al. 1988)
ESO 490- IG 026 colliding pair
ESO 122- IG 016 ?GPair?
ESO 209- G 012 Sa?
ESO 602- G 031 (R’)SAB(rs)b, Sy1 from poor spectrum (Coziol et al. 1994)
Table 3. Optical line properties. Line width W (col. 11) is given as FWHM
| Name | Exp. | cz(em) | cz(abs) | cz(others) | Ref. | [O iii]/Hβ | [S ii]/Hα | [N ii]/Hα | [O i]/Hα | W | comments∗ |
|---|---|---|---|---|---|---|---|---|---|---|---|
| (s) | (km s-1) | (km s-1) | (km s-1) | (km s-1) | |||||||
| (1) | (2) | (3) | (4) | (5) | (6) | (7) | (8) | (9) | (10) | (11) | (12) |
| CGCG 433-025 | 1800 | 38.0 | 8250 | H self-absorbed | |||||||
| HCG 4a | 900 | 1 | 8.2 | 0.7 | 1.7 | 0.2 | 2100 | ||||
| VIII Zw 36 | 900 | 13.4 | 0.5 | 0.9 | 0.2 | 1950 | H broad asymmetric | ||||
| ESO 113- G 010 | 900 | 5.3 | 0.4 | 1.4 | 0.1 | 2000 | |||||
| UGC 716 | 900 | SGS | |||||||||
| NGC 427 | 2700 | 2 | 1.1 | 1.8 | 0.8 | 5500 | H narrow not detected | ||||
| RX J011232.8320140 | 900 | ||||||||||
| ESO 244- G 017 | 900 | 3 | 7.1 | 0.3 | 1.5 | 0.2 | 3000 | ||||
| MCG -01-05-031 | 900 | 4 | 3.7 | 0.4 | 0.7 | 0.2 | |||||
| ESO 080- G 005 | 1800 | 13.0 | 0.3 | 0.8 | 0.1 | 3450 | |||||
| ESO 416- G 002 | 1500 | 22.1 | 1.0 | 2.6 | 0.6 | FWHM of H broad estimated | |||||
| RX J023454.8293425 | 3000 | ||||||||||
| PHL 1389 | 1200 | ||||||||||
| IC 1867 | 600 | 6.7 | 0.8 | EL: H,[N ii], [O i], SGS | |||||||
| NGC 1217 | 600 | 3 | EL: H,[N ii], [O i], [O iii], | ||||||||
| [S ii], SGS | |||||||||||
| NGC 1218 | 1500 | 3 | 9.5 | 21.5 | 2950 | SGS | |||||
| ESO 548- G 081 | 1500 | 3 | 1.7 | 7.9 | 0.5 | 4450 | |||||
| AM 0426-625 | 600 | SGS | |||||||||
| ESO 15- IG 011 N | 900 | 1 | 5.4 | 0.5 | 0.7 | 0.1 | 2750 | ||||
| ESO 15- IG 011 S | 1800 | 1 | 1.4 | 0.6 | 0.9 | 0.2 | |||||
| MCG -02-12-050 | 1800 | 38.1 | 1.1 | 1.1 | 0.5 | 5400 | |||||
| UGC 3134 | 900 | 4.0 | 0.4 | 0.8 | 0.1 | ||||||
| MCG -01-13-025 | 1200 | 3897 | 5 | 2.9 | 0.3 | 0.9 | 0.4 | 4500 | |||
| ESO 552- G 039 | 1500 | 18.4 | 1.2 | 1.6 | 0.7 | 4000 | H broad asymmetric | ||||
| MCG -02-14-009 | 900 | 8.6 | 0.2 | 0.9 | 2850 | very strong Fe ii multiplets | |||||
| ESO 120- G 023 | 600 | SGS | |||||||||
| ESO 254- G 017 | 1500 | 1.2 | 2.1 | EL: H,[N ii], [O i], [S ii], | |||||||
| SGS | |||||||||||
| PMN J0623-6436 | 1200 | 38853 | 6 | 2500 | H + H broad asymmetric, | ||||||
| very strong Fe ii multiplets | |||||||||||
| PMN J0630-2406 | 600 | ||||||||||
| ESO 490- IG 026 | 900 | 7751 | 7 | 16.4 | 0.9 | 1.4 | 0.3 | 4100 | H + H broad asymmetric | ||
| ESO 122- IG 016 NE | 1200 | EL: [N ii]?, SGS | |||||||||
| ESO 122- IG 016 SW | 1200 | SGS | |||||||||
| ESO 209- G 012 | 1200 | 8 | 8.6 | 0.8 | 1.6 | 0.2 | 3400 | H broad asymmetric | |||
| NGC 7158 | 900 | 10.9 | 0.1 | 0.9 | 0.1 | 2100 | |||||
| ESO 602- G 031 | 1800 | 1 | 10.1 | 0.4 | 1.3 | 0.1 | 5900 | ||||
| IC 5287 | 1800 | 1.8 | 4.8 | 4200 | |||||||
| MCG -02-59-006 | 900 | 0.1 | 1.3 | 3700 | redshifted H and H narrow | ||||||
| strong Fe ii multiplets | |||||||||||
| UGC 12492 | 600 | 9019 | 3 | EL: [N ii], SGS |
∗ SGS = strong galaxy spectrum, EL = emission lines
References:
(1) Da Costa et al. 1991;
(2) Ramella et al. 1996;
(3) De Vaucouleurs et al. 1991;
(4) Zabludoff et al. 1993;
(5) Brissenden et al. 1987;
(6) Keel et al. 1988;
(7) Takata et al. 1994;
(8) Fisher et al. 1995
Table 4. Multi-wavelength properties. Col. (1): Galactic NH
in units of 1021cm-2 (Dickey & Lockman 1990), (5) and (8): in units of
erg cm-2 s-1 Hz-1, (13): in units of erg s-1 Hz-1
| name | R | ||||||||||||||
|---|---|---|---|---|---|---|---|---|---|---|---|---|---|---|---|
| (Mpc) | (mag) | (mag) | ) | ||||||||||||
| (1) | (2) | (3) | (4) | (5) | (6) | (7) | (8) | (9) | (10) | (11) | (12) | (13) | (14) | (15) | (16) |
| CGCG 433-025 | 0.44 | 180.3 | 15.7 | -25.62 | -11.31 | -21.46 | 44.02 | 43.64 | 0.34 | ||||||
| HCG 4a | 0.16 | 105.3 | 13.7 | -24.82 | -11.34 | -9.64 | -24.36 | -22.30 | 44.35 | 43.14 | 44.84 | 30.10 | -0.49 | -1.70 | 0.46 |
| VIII Zw 36 | 0.26 | 165.2 | 14.6 | -25.18 | -11.33 | -22.37 | 44.38 | 43.55 | -0.12 | ||||||
| ESO 113- G 010 | 0.30 | 102.7 | 14.6 | -25.18 | -11.07 | -10.11 | -21.34 | 43.97 | 43.40 | 44.34 | 0.14 | -0.96 | |||
| UGC 716 | 0.41 | 236.1 | 15.6 | -25.58 | -11.75 | -22.15 | 44.29 | 43.45 | -0.14 | ||||||
| NGC 427 | 0.21 | 133.8 | 15.1 | -25.38 | -11.82 | -21.42 | 44.00 | 42.88 | -0.41 | ||||||
| RX J011232.8320140 | 0.21 | 21.11 | -27.78 | -11.70 | -25.34 | 2.10 | 2.45 | ||||||||
| ESO 244- G 017 | 0.24 | 93.9 | 14.6 | -25.18 | -11.26 | -10.46 | -21.15 | 43.89 | 43.12 | 43.92 | -0.05 | -0.80 | |||
| MCG -01-05-031 | 0.28 | 72.3 | 13.3 | -24.66 | -11.45 | -10.37 | -24.86 | -21.88 | 44.19 | 42.70 | 43.78 | 29.28 | -0.76 | -1.09 | -0.19 |
| ESO 080- G 005 | 0.25 | 107.7 | 16.0 | -25.74 | -12.19 | -20.05 | 43.45 | 42.32 | -0.42 | ||||||
| ESO 416- G 002 | 0.17 | 236.1 | 14.9 | -25.30 | -11.64 | -23.973 | -22.85 | 44.57 | 43.56 | 31.183 | -0.31 | 1.333 | |||
| RX J023454.8293425 | 0.17 | 2712.1 | 17.91 | -26.50 | -12.47 | -25.13 | 45.49 | 45.00 | 0.06 | ||||||
| PHL 1389 | 0.17 | 16.12 | -25.78 | -11.62 | -25.26 | 0.19 | |||||||||
| IC 1867 | 1.18 | 102.4 | 14.6 | -25.18 | -11.44 | -21.33 | 43.97 | 43.02 | -0.23 | ||||||
| NGC 1217 | 0.21 | 82.1 | 13.3 | -24.66 | -11.50 | -10.04 | -24.44 | -22.15 | 44.29 | 42.77 | 44.22 | 29.80 | -0.81 | -1.46 | 0.22 |
| NGC 1218 | 0.73 | 114.5 | 13.9 | -24.90 | -11.20 | -22.463 | -22.28 | 44.35 | 43.35 | 32.073 | -0.27 | 2.443 | |||
| ESO 548- G 081 | 0.28 | 54.8 | 12.8 | -24.46 | -11.28 | -10.42 | -21.77 | 44.14 | 42.63 | 43.49 | -0.79 | -0.86 | |||
| AM 0426-625 | 0.24 | 73.2 | 13.0 | -24.54 | -11.75 | -22.20 | 44.32 | 42.41 | -1.18 | ||||||
| ESO 15- IG 011 | 0.70 | 243.7 | 14.2 | -25.02 | -11.13 | -10.32 | -23.62 | 44.88 | 44.10 | 44.88 | -0.08 | -0.81 | |||
| MCG -02-12-050 | 0.60 | 143.1 | 15.2 | -25.42 | -11.67 | -10.38 | -24.97 | -21.46 | 44.02 | 43.08 | 44.36 | 29.76 | -0.22 | -1.29 | 0.46 |
| UGC 3134 | 0.47 | 115.5 | 14.2 | -25.02 | -11.63 | -10.31 | -25.03 | -21.99 | 44.23 | 42.93 | 44.24 | 29.51 | -0.58 | -1.32 | -0.01 |
| MCG -01-13-025 | 0.41 | 63.5 | 14.6 | -25.18 | -11.14 | -25.09 | -20.30 | 43.55 | 42.90 | 28.94 | 0.07 | 0.10 | |||
| ESO 552- G 039 | 0.28 | 158.3 | 16.3 | -25.86 | -11.37 | -20.58 | 43.67 | 43.47 | 0.52 | ||||||
| MCG -02-14-009 | 0.91 | 113.7 | 15.5 | -25.54 | -10.92 | -10.854 | -25.41 | -20.66 | 43.70 | 43.64 | 43.694 | 29.12 | 0.65 | -0.064 | 0.14 |
| ESO 120- G 023 | 0.49 | 150.4 | 15.3 | -25.46 | -11.57 | -21.47 | 44.02 | 43.23 | -0.08 | ||||||
| ESO 254- G 017 | 0.51 | 119.0 | 14.6 | -25.18 | -11.34 | -23.543 | -21.66 | 44.10 | 43.25 | 31.033 | -0.13 | 1.643 | |||
| PMN J0623-6436 | 0.56 | 515.2 | 14.81 | -25.26 | -11.05 | -23.343 | -24.64 | 45.29 | 44.84 | 32.463 | 0.24 | 1.923 | |||
| PMN J0630-2406 | 0.97 | 15.41 | -25.50 | -11.44 | -23.893 | 0.09 | 1.623 | ||||||||
| ESO 490- IG 026 | 1.09 | 99.3 | 14.1 | -24.98 | -11.19 | -10.07 | -24.41 | -21.77 | 44.14 | 43.24 | 44.35 | 30.01 | -0.18 | -1.12 | 0.58 |
| ESO 122- IG 016 | 0.97 | 130.3 | 14.6 | -25.18 | -11.37 | -21.86 | 44.18 | 43.30 | -0.16 | ||||||
| ESO 209- G 012 | 2.68 | 161.9 | 15.3 | -25.46 | -10.68 | -10.525 | -21.63 | 44.09 | 44.19 | 44.325 | 0.81 | -0.155 | |||
| NGC 7158 | 0.39 | 110.3 | 17.32 | -26.26 | -11.15 | -18.79 | 42.95 | 43.38 | -1.14 | ||||||
| ESO 602- G 031 | 0.22 | 131.9 | 14.3 | -25.06 | -11.89 | -25.14 | -22.18 | 44.31 | 42.79 | 29.52 | -0.80 | -0.07 | |||
| IC 5287 | 0.42 | 130.0 | 14.8 | -25.26 | -11.62 | -21.65 | 44.09 | 43.05 | -0.33 | ||||||
| MCG -02-59-006 | 0.27 | 303.9 | 15.7 | -25.62 | -11.46 | -22.59 | 44.47 | 43.96 | 0.19 | ||||||
| UGC 12492 | 0.42 | 116.1 | 14.6 | -25.18 | -11.74 | -21.61 | 44.08 | 42.83 | -0.53 | ||||||
(following Maccacaro et al. 1988)
1 from ROE/NRL digitized sky survey (Yentis et al. 1992)
2 from SIMBAD
3 GHz radio flux from NED
4 upper limit in 100 flux, log is below -10.31 (erg cm-2 s-1 ), log below 44.22
(erg s-1 ), above -0.61
5 upper limit in 100 flux, log is below -9.89 (erg cm-2 s-1 ), log below 44.95
(erg s-1 ), above -0.79