Weak Lensing by Two Clusters of Galaxies
Abstract
We report the detection of weak gravitational lensing of distant background galaxies by two rich, X-ray luminous clusters of galaxies, MS 113766 at and RXJ 171667 at . We detect a shear signal in each cluster over the radial range 700 kpc. Assuming the background galaxies lie in a sheet at , we measure a mass of and at kpc radius for MS 113766, and a mass of and for RXJ 171667 at the same radius. Both the optical lightmaps and weak lensing massmaps of RXJ 171667 show two spatially distinct sub-clusters, as well as a long filamentary structure extending out of the cluster to the northeast. In contrast, MS 113766 is an ultra-compact massive cluster in both massmaps and optical lightmaps, and contains a strongly-lensed arc system in the cluster core. These data add to the growing number of massive clusters at .
1 Introduction
The existence of high-mass, X-ray luminous clusters of galaxies at provides a strong constraint on cosmological models (Eke et al. 1996). The presence of any clusters at invalidates most CDM models (Bahcall et al. 1997, Henry 1997). Further, the surface densities, amounts of sub-clustering, and mass to light ratios for these high clusters can place even stronger constraints on cosmological models and the nature of dark matter (Wilson et al. 1997, Crone et al. 1996).
Currently, X-ray observations provide the most effective way of finding massive clusters at high redshifts. The Einstein Extended Medium Sensitivity Survey (EMSS) and the ROSAT North Ecliptic Pole (NEP) survey have, so far, found three clusters of galaxies (Gioia and Luppino 1994, Henry et al. 1997). One of these clusters, MS 105403, has had its mass confirmed by weak gravitational lensing measurements (Luppino and Kaiser 1997, hereafter LK). In this paper we report on the detection of weak gravitational lensing signals in two more clusters of galaxies, MS 113766 and RXJ 171667.
MS113766 is one of the high redshift clusters from the EMSS (Luppino and Gioia 1995). It has a redshift of and an x-ray luminosity of erg s-1. RXJ 171667 is a recently discovered high-redshift cluster from the ROSAT NEP survey. It has a redshift of and an x-ray luminosity of erg s-1 (converted from the 0.5-2.0 keV ROSAT data assuming a 6 keV). The X-ray luminosities of these clusters are comparable to MS 105403 and suggest they may also be massive systems.
Our observations, data reduction, and the weak lensing analysis are outlined in §2. In §3 we discuss the properties of the cluster and the weak lensing results. Section 4 contains our conclusions. We assume an cosmology throughout this paper, and all errors are .
2 Observations, Data Reduction, and Weak Lensing Analysis
Very deep optical -band images of RXJ 171667 and MS 113766 were obtained with the Keck II 10m telescope on the nights of August 17-18 1996 and January 10-11, 1997. The images were obtained using LRIS (Oke et al. 1995) in imaging mode, resulting in a scale of 0215 pixel-1 and a field of view of 6′ 8′. Total exposure times were 7500 s and 8700 s respectively.
Optical -band images were obtained with the UH 2.2 m telescope on the nights of July 20-22, 1996 for RXJ 171667 and April 6-7, 1995 and April 29 - May 1, 1997 for MS 113766. A thinned Tek 20482 CCD was mounted at the f/10 RC focus resulting in a scale of 022 pixel-1 and a field of view of 75 75. Total exposure times were 26100 s and 21000 s respectively.
The individual images in each filter were first debiased and then flattened using a median of all the images taken in that filter during each set of observations. The -band 88” images were shifted into registration and summed with cosmic-ray rejection. The -band Keck images were re-mapped with a bi-cubic polynomial to correct for the focal plane curvature and to map the images onto the -band plate scale. The sky was removed by subtracting a smoothed fit to the minima in the sky. The images were then summed with cosmic-ray rejection, with images showing high extinction after correction for airmass being rejected from the sum. The resulting images had seeing of in -band and in -band for RXJ 171667 and in -band and in -band for MS 113766. These images, along with some shallower -band images obtained from the UH 88” telescope, have been combined into the three color images shown in Figure 1 (plate xx: MS 113766) and Figure 2 (plate xx: RXJ 171667).
Photometric calibration was performed using the standard stars of Landolt (1992). The 1 surface brightness limits of the summed -band and -band images for a seeing-sized disc are 29.4 and 26.6 for MS 113766 and 29.0 and 26.8 for RXJ 171667.
The first step in the weak lensing analysis was detecting and measuring the positions and luminosities of all the objects in the field. We used a hierarchical peak finding algorithm to detect objects (Kaiser, Squires, and Broadhurst 1995), which provided both centroid positions and a rough measure of the object size. The luminosity of each object was measured using a circular aperture with radius equal to three times the smoothing radius at which the object was first detected. The catalog of objects was then used to mask the summed image. Small, residual bias around each object left by the sky subtraction was then measured in the masked image and subtracted. Noise peaks and non-splitable groups of objects were removed by rejecting extremely small and large objects, as well as objects with abnormally high eccentricities. With very few exceptions, all objects detected in the I-band images were also detected in the much deeper R-band images. The I-band magnitudes were calculated using an aperture , where is the smoothing scale at which the object is first detected in the R-band image. The resulting I-band magnitudes agree with the magnitudes from the initial detection in the I-band images to within 0.1 mag rms. For purposes of color selection, it is assumed that all objects present in the R-band images but not detected in the I-band images are bluer than objects of the same R-band magnitude with a detection in the I-band images.
The ellipticities of each object were measured using optical polarizations formed from the quadrupole moments where is the flux density and is a Gaussian weighting function of a scale equal to the smoothing radius at which the object was first detected. A low order polynomial fit to a sample of bright but unsaturated stars ( distributed across the field) was used to correct the ellipticities of the objects for psf variations across the field (spherical aberrations and coma in the focal plane, wind shake on the telescope, etc.). The resulting ellipticities should average to the object ellipticity, possibly sheared by the gravitational lens, smeared by a circular psf. Stars were removed from the catalog by using half-light radii of the objects.
Given that the smeared ellipticities reduce the strength of any lensing signal present, the next step is to boost the ellipticities of the galaxies to remove the effects of the psf smearing. This boost factor was calculated using the shear polarizability (LK), where and are as defined in Kaiser, Squires, and Broadhurst (1995), and denotes the values for stellar objects. The individual values of are rather noisy for small galaxies, but the mean value, , varies smoothly as a function of galaxy size. Thus by binning the galaxies by size an estimate of the shear was calculated. This shear is then related to the dimensionless surface density by where and where the critical density . Because of the factor in , the mass obtained from is dependent on the redshift of the source galaxies used in the weak lensing analysis. In this paper we will be assuming that the background galaxies lie on a sheet at . If, instead, the background galaxies were to lie on sheets at , , or , the measured masses would be , , or the quoted mass. It should be noted that the intrinsic ellipticities of the galaxies cannot be removed from measurements, and are the dominant source of noise in the analysis.
We used two different methods to derive from the measured shears of the background galaxies. The first was the unbiased inversion algorithm of Squires and Kaiser (1996). This technique, while producing two dimensional maps of the surface density, is only able to determine to within an unknown constant. The second technique is that of aperture mass densitometry, which measures the mass interior to a given radius (Fahlmen et al. 1994). The traditional statistic of aperture mass densitometry
provides a lower bound on interior to radius . However, because this statistic subtracts of the annulus outside , the final measured mass depends not only on the strength of the detected lensing but also on the mass profile of the cluster. Because of the large numbers of background galaxies in our deep images, we have been able to use a slightly altered statistic
which allows the subtraction of a constant for a fixed inner annulus radius for all apertures in the measurement, thereby eliminating the dependence of the statistic on the mass profile of the cluster. The measured mass profile is now the mass of the cluster minus an unknown, but presumably small, constant times . In both statistics the tangential shear is , where and is the azimuthal angle with respect to some chosen center (which we take to be the peak of the smoothed light distribution for each cluster).
Both clusters’ catalogs of objects were then divided into several subcatalogs by magnitude and color of the galaxies. As was the case with MS 105403 in LK, both MS 113766 and RXJ 171667 had the strongest weak lensing signal from the catalogs containing the faintest, bluest galaxies, specifically and . The discussion of the results below come from the subcatalogs of the faint blue galaxies.
3 Cluster Properties
3.1 MS 113766
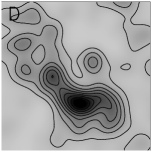
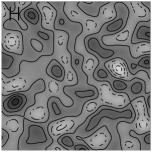
This cluster is easily identifiable as the compact group of red galaxies in the center of the field, seen in Figure 1 (plate xx). Using a 500 kpc aperture and a galaxy color selection of to isolate the cluster galaxies, an over-density of galaxies above the background level was determined from the galaxy density in the field outside the aperture. This corresponds to an Abell class 3 cluster richness (Bahcall 1981). A smoothed image of the luminosities of the selected galaxies is shown in Figure 3b. The centroid of the cluster light peak is consistent with the position of the BCG. The total magnitude for all selected galaxies inside a 500 kpc aperture centered on the BCG, minus a background determined from the galaxies outside the aperture, is , which corresponds to a cluster luminosity .
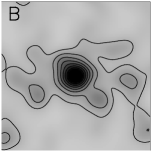
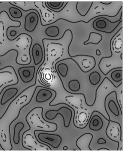
As can be seen in Figure 3a, MS 113766 has a mass distribution as compact as the light (Figure 3b) and galaxy distribution. The small peak just north of the cluster is centered around three galaxies with colors similar to the cluster galaxies, but of unknown redshift. The minimum mass enclosed in a 500 kpc radius centered on the BCG (coincident with the center of the mass peak in the 2-d reconstruction), calculated using aperture densitometry, is . The small northern peak is included in this estimate, but contributes less than of the total mass detected. Combining this mass estimate with the cluster luminosity estimate from §3 gives , which is similar to that found for MS 105403 (LK).
The ultra-deep Keck image has also revealed a system of giant arcs present in the core of MS 113766. The brightest arc is located 55 (22 kpc) south-west of the BCG and has a surface brightness of magarcsec2. A second arc is located 180 (73.6 kpc) north-east of the BCG and has a surface brightness of magarcsec2. There is a potential counter arc with the same surface brightness located 185 (75.7 kpc ) south of the BCG. There are also two more arc candidates, all of which are marked in Figure 1 (plate xx). No redshifts have yet been obtained for any of these arcs. It is interesting to note, however, that the outer giant arc is located presumably on the circle at which for the redshift of the arc. The weak lensing result, when extrapolated into this radius, has a . This implies that the source galaxy redshift of the outer giant arc is higher than the typical redshifts of the faint background galaxy (FBG) population over the magnitudes which we have measured. The outer giant arc can be used to measure the mass of MS 113766 interior to its radius unambiguously, and, because of the large radius of the arc from the cluster core, serve as an anchor point to the masses measured by the weak lensing.
3.2 RXJ 171667
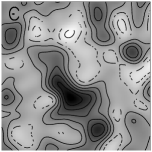
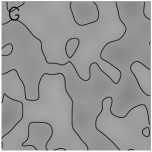
Unlike MS 113766, RXJ 171667 does not appear to be a well formed cluster. As can be seen in Figure 2 (plate xx), the BCG is located on the north-western edge of the main group of galaxies, and there is a smaller clump of galaxies to the north-east of the main group. A filament of galaxies extends north-east of the cluster, disappearing off the edge of the image. A smoothed image of the luminosities of galaxies with , shown in Figure 3d, has the main peak in the cluster luminosity located 8″southeast of the BCG. In a 500 kpc aperture centered on the peak of the cluster luminosity, RXJ 171667 has an over-density of galaxies of , corresponding to Abell class 3 (Bahcall 1981), and a cluster magnitude of which corresponds to .
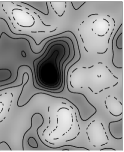
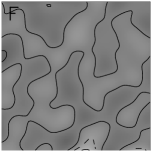
While much of the fine structure seen in the smooth cluster light image (Figure 3d) for RXJ 171667 is lost in the noise of the mass reconstruction (Figure 3c), the mass of the northeastern group of galaxies is clearly separated from the mass of the main cluster. Further, while the mass peak of the northeastern group is consistent with the center of light and the galaxy distribution of the group, the center of mass of the main cluster is located 27″(111 kpc) east and 11″(45 kpc) north of the BCG. This offset is in the same direction but far larger than the offset seen in the center of the light peak of the cluster. The minimum mass enclosed in a 500 kpc radius aperture centered on the center of mass for the main cluster, calculated using aperture densitometry, is . This includes both the mass of the main cluster and the smaller northeastern group of galaxies. Combining this with the cluster luminosity estimate of §3 gives .
4 Discussion
The mass profiles of both clusters are plotted in Figure 4, along with “universal” CDM profiles of Navarro, Frenk, and White (1996). While the CDM profiles are not robust fits (both parameters in the model can be adjusted to a small extent without affecting the goodness of fit), they can be used as a general comparison with mass profiles of lower redshift clusters. In both clusters, the observed masses are similar to those measured in lower redshift clusters (Squires et al. 1996, Fischer et al. 1997), but MS 113766 is much more compact than usual (Navarro et al. 1996).
We believe that this compactness may be an artifact of projecting 3D filamentary structures onto a 2D plane and that the compact profile of MS 113766 can be explained if we are looking down the length of a filamentary structure. This would cause all the mass of the central filament to be projected as a large, steeply sloped 2D surface potential, and would not seriously affect the strength of the weak lensing provided the tube has a length smaller than the typical background galaxy – 2D cluster center distance. We do not, however, have enough redshifts on cluster galaxies to determine if this is indeed the case.
Finally, these results show that a substantial part of the FBG population must lie at . Because of the dependence of on both the redshift of the lensing cluster and the redshifts of the background galaxies, we believe that the redshift distribution of the FBG population can be measured by using a number of clusters at varying redshifts. The outer giant arc in MS 113766 will prove to be a valuable tool in this measurement. The radius of the arc implies that the arc is being strongly lensed primarily by the core of the cluster, and any nearby galaxies will provide only a minor perturbation to the shape of the arc. Thus, once the redshift of the outer arc is known, it will be possible to obtain a mass measurement of the cluster interior to the arc with an uncertainty much lower than both weak lensing and X-ray observations can obtain.
References
- (1) Bahcall, N. A., Fan, X., & Cen, R. 1997, ApJ, 485, L53.
- (2) Bahcall, N. A. 1981, ApJ, 246, 122.
- (3) Crone, M. M., Evrard, A. E., & Richstone, D. O. 1996, ApJ, 467, 489.
- (4) Eke, V. R., Cole, S., & Frenk, C. S. 1996, MNRAS, 282, 263.
- (5) Fahlman, G., Kaiser, N., Squires, G., & Woods, D. 1994, ApJ, 437, 56.
- (6) Fischer, P., Bernstein, G., Rhee, G., & Tyson, J. A. 1997, AJ, 113, 521.
- (7) Gioia, I. M. & Luppino, G. A. 1994, ApJS, 94, 583.
- (8) Henry, J. P. 1997, ApJ, 489, L1.
- (9) Henry, J. P., Gioia, I. M., Mullis, C. R., Clowe, D. I., Luppino, G. A., Boehringer, H., Briel, U. G., Voges, W., & Huchra, J. P. 1997, AJ, 114, 1293.
- (10) Kaiser, N., Squires, G., & Broadhurst, T. 1995, ApJ, 449, 460.
- (11) Landolt, A. U. 1992, AJ, 104, 340.
- (12) Luppino, G. A. & Gioia, I. M. 1995, ApJ, 445, 77.
- (13) Luppino, G. A. & Kaiser, N. 1997, ApJ, 475, 20 (LK).
- (14) Morgan, J. A. 1995, PASPCS, 77, 129.
- (15) Navarro, J. F., Frenk, C. S., & White, S. D. M. 1996, ApJ, 462, 563.
- (16) Oke, J. B., Cohen, J. G., Carr, M., Cromer, J., Dingizian, A., Harris, F. H., Labrecque, S., Lucinio, R., Schaal. W., Epps, H., & Miller, J. 1995, PASP, 107, 375
- (17) Squires, G. & Kaiser, N. 1996, ApJ, 473, 65.
- (18) Squires, G., Kaiser, N., Babul, A., Fahlman, G., Woods, D., Neumann, D. M., & Boehringer, H. 1996, ApJ, 461, 572.
- (19) Wilson, G., Cole, S., & Frenk, C. S. 1996, MNRAS, 282, 501.
- (20)
(Plate): , 3 color image of MS 113766. R, G, and B colors are a 21000s -band exposure from the UH88” telescope, 8700s -band exposure from the Keck II telescope, and a 12600s -band exposure from the UH88” telescope respectively. All three colors are scaled with stretch. Inset in the lower right-hand corner is a greyscale close up of the cluster center in -band. Clearly evident are the two giant arcs (A and B). Also present are the counter arc candidate (C), and two giant arc candidates (D and E).
(Plate): , 3 color image of RXJ 171667. R, G, and B colors are a 26100s -band exposure from the UH88” telescope, a 7500s -band exposure from the Keck II telescope, and a 10800s -band exposure from the UH88” telescope respectively. All three colors are scaled with a stretch. The BCG is located in the lower center of the image, with a long filament leading out of the cluster to the north-east.