MCG+00-32-16: An Irregular Galaxy Close to the Lowest Redshift Absorber on the 3C 273 Line of Sight
Abstract
MCG+00-32-16 is the galaxy closest in position-velocity space to the lowest redshift Ly absorber along the line-of-sight to the quasar 3C 273. Its projected separation is kpc, where d is the distance from the Milky Way to the galaxy, and the redshift difference is only 94 km ; H I 1225+01 is slightly closer in projected separation to the absorber, but has a greater redshift difference. We present H I synthesis array mapping and CCD photometry in B and R for MCG+00-32-16. The H I disk is rotating in such a way that the side of the galaxy closer to the sight-line to the quasar has the larger velocity difference from the absorber. The absorber may be a “failed dwarf” member of a poor galaxy group of which MCG+00-32-16 and H I 1225+01 are the only members to have formed stars.
1 Introduction
Even before observational data became available, there were predictions of intergalactic Ly absorption, either continuous (Gunn & Peterson 1965) or in discrete lines from galaxy halos or clusters of galaxies (Spitzer 1956; Bahcall & Salpeter 1965; Bahcall & Spitzer 1969). The observed damped wing Ly absorption lines, rare in occurrence but high in H I column density (of order atoms ), are generally thought to be produced by inner protogalaxy disks, but there is on-going controversy about the very abundant Ly forest lines with very low H I column density ( atoms ). The Ly forest at high redshifts shows some velocity correlation which suggests some association with galaxies (Fernandez-Soto et al. 1996), but less so than at low redshifts (Ulmer 1996), and the high-z forest is usually thought of in terms of density enhancements which have not yet formed equilibrium structures. We shall not discuss models of this kind (Zhang et al. 1995; Hernquist et al. 1996; Miralda-Escudé et al. 1996; Bi & Davidsen 1997) here, but will discuss only the Ly forest associated with galaxies at low (and intermediate) redshifts, excluding the smaller number of absorbers in voids (Stocke et al. 1995; Shull et al. 1996).
At least two types of locations for Ly forest gas have been proposed: (1) direct association with the outskirts of an individual normal galaxy, and (2) somewhere in a galaxy group outside of individual galaxies. For locations of type (1), whether the association is in terms of the earlier spherical halo models or extended disks of ordinary galaxies (Maloney 1992) or almost invisible “failed dwarf” or “Cheshire Cat” galaxies (Salpeter 1993; Salpeter & Hoffman 1995; Jimenez et al. 1997) or a collection of clouds in a halo, one needs radii of a few hundred kpc for the extension of the galaxy, 10 to 100 times larger than optical galaxy radii. The hypothesis (2) of Ly forest absorbers residing in galaxy groups (Morris & van den Bergh 1994; Mo & Morris 1994) is motivated in part by the fact that the number density and typical size ( Mpc) of groups is compatible with the observed number of forest lines, if the area covering factor within each group is appreciable. For type (2) locations there is the further controversy over whether or not the absorbing gas was ejected from individual galaxies (via tidal interactions or starburst-powered outflows; Wang 1995) or resides in a separate optically invisible dwarf galaxy (faded or failed) with its own dark matter halo.
The discovery by Hubble Space Telescope (HST) of Ly absorbing clouds at low redshift along the lines of sight to a number of bright quasars (Bahcall et al. 1991, 1992a, 1992b, 1993; Morris et al. 1991; Weymann et al. 1995) has led to a number of follow-up studies. Some observations document locations (1), galaxy extensions up to kpc (Lanzetta et al. 1996; Barcons et al. 1995); some document locations (2), galaxy groups (Salzer 1992; Morris et al. 1993; Salpeter & Hoffman 1995; Lanzetta et al. 1996; Bowen et al. 1996, 1997a, 1997b; Tripp et al. 1997). Additional studies on explicit galaxy-absorber association, which seek correlations among the absorbers’ equivalent widths, impact parameters, velocity differences and the galaxies’ luminosities, suggest that both (1) and (2) occur (Chen et al. 1998; Le Brun et al. 1996; Pettijean et al. 1995; Rauch et al. 1996; Shull et al. 1996; van Gorkom et al. 1993, 1996).
In those cases where a galaxy has been observed moderately close in position and velocity to a Ly forest line, the sense of the galaxy’s rotation curve can give additional information toward a choice between types (1) and (2), if the galaxy’s major axis points roughly toward (or away from) the line-of-sight to the quasar. H I mapping by van Gorkom et al. (1996) uncovered two H I-rich galaxies with impact parameters kpc to quasar sight-lines and very small velocity differences from the absorbers, but both galaxies’ major axes are almost perpendicular to the directions to the absorbers. Barcons et al. (1995) have found two cases where the side of the galaxy closer to the quasar sight line also has a velocity closer to that of the forest absorption line, possibly suggesting a direct galaxy extension, but the velocity differences are still larger than expected from simple rotation. This paper adds another rotation curve to the sample.
We discovered that MCG+00-32-16, at projected separation kpc and velocity difference 94 km , was the galaxy closest in position-redshift space to the lowest redshift Ly absorber on the line-of-sight to 3C 273 in the course of our study of H I-bearing galaxies in that neighborhood (Salpeter & Hoffman 1995). At that time, the only H I observation of MCG+00-32-16 was the single-beam Nançay spectrum of Garcia et al. (1993). We were interested in the velocity field of the galaxy, and in particular whether or not an extrapolation of the H I disk observable in emission could be responsible for the absorption. Any indications of H I clouds outside of the galaxy proper would also have been of interest (van Gorkom et al. 1993, 1996). In Sect. 2, we present synthesis array mapping and CCD surface photometry in B and R for MCG+00-32-16 and undertake a rotation curve decomposition. We discuss various models in Sect. 3 and end with a summary and conclusions in Sect. 4.
2 Observations
2.1 Neutral hydrogen mapping
The H I mapping of MCG+00-32-16 was conducted at the Very Large Array111The Very Large Array of the National Radio Astronomy Observatory is a facility of the National Science Foundation, operated under cooperative agreement by Associated Universities, Inc. as detailed in Table 4, which lists the date of the observing run, the pointing center (epoch 1950), the heliocentric velocity to which the receivers were tuned, the array configuration, the number of spectral channels and channel separation in velocity units, and the time spent on source during the observations, not including time spent on calibrators. We have also listed the resulting beam size in arcsec, the rms noise per channel, and the detection limit for H I column density in each channel. We obtained both R and L circularly polarized data. On-line Hanning smoothing was employed, and the observations were calibrated using sources from the VLA calibrator list. Calibration and data-editing were accomplished using standard AIPS tasks. Continuum was subtracted in the uv domain using the task UVBAS, and maps were made and CLEANed using IMAGR with robustness parameter 0 for the best compromise between spatial resolution and maximum signal-to-noise. After imaging, the data cube was corrected for the VLA primary beam.
Figure 1 shows a mosaic of the line-bearing channels of the MCG+00-32-16 data cube. No other hints of signal were seen outside the field of view of these panes, nor in other velocity channels, even after the data were smoothed to resolution. We have no evidence of extended diffuse emission nor of outlying diffuse clouds of H I to our () sensitivity limit, atoms per velocity channel, or atoms per velocity channel after smoothing.
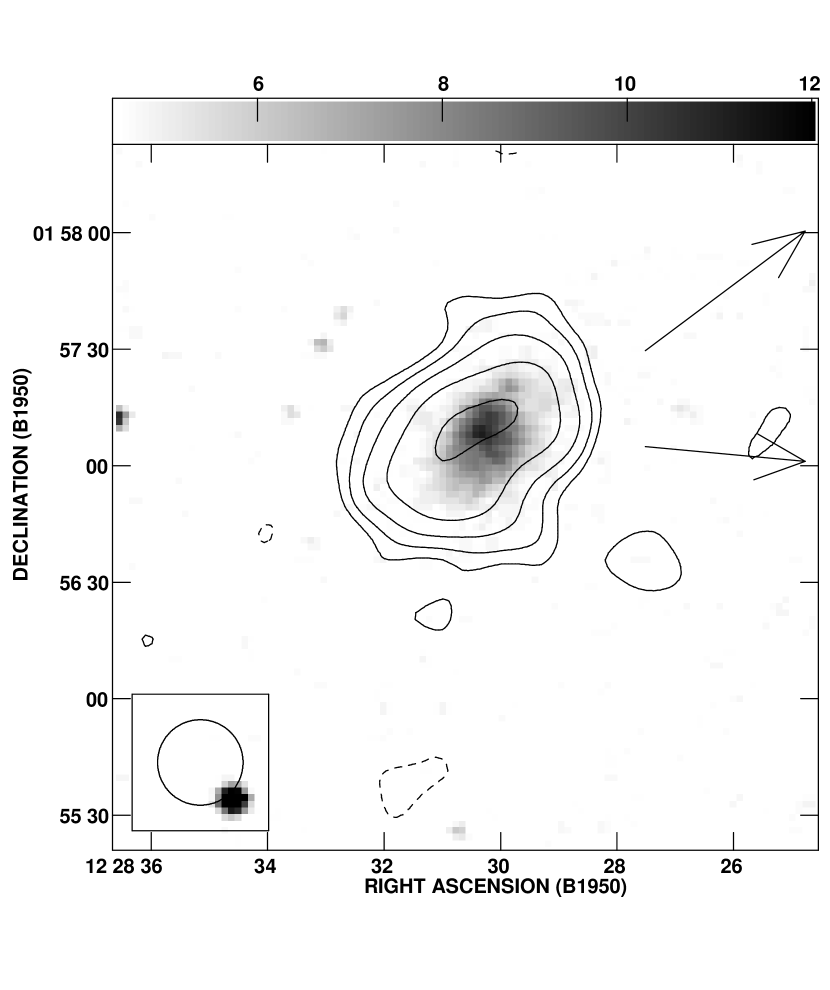
A contour map of the total H I emission (0th moment map with a flux cutoff of ) is superimposed on a grey scale image from the Digitized Sky Survey of the optical emission from MCG+00-32-16 in Fig. 2. H I extends, to our sensitivity, to the edge of the optical emission or a bit beyond; MCG+00-32-16 does not appear to be a dwarf with a dramatically extended H I disk like DDO 154 (Hoffman et al. 1993; Carignan et al. 1990; Krumm & Burstein 1984) or H I 1225+01 (Giovanelli et al. 1991). However, we have some marginal evidence that our C array observations have resolved out some diffuse flux: The total H I flux integrated over the map is 1.76 Jy km , whereas Garcia et al. (1993) found 2.3 Jy km using the Nançay single beam. Our flux amounts to where is the distance to the galaxy, assumed to be a member of the Southern Extension of the Virgo Cluster. MCG+00-32-16 is, in fact, within the “triple-valued region” of the Virgo Cluster, with possible distances of 8.6, 19 or 26 Mpc in a spherical infall model which has the global value of , , and a Local Group infall velocity of . Tully-Fisher (TF) estimates of the distance to the galaxy are inconclusive due to its small profile width and the wide scatter in the relation for irregular galaxies; however, application of the blue TF relation from Hoffman et al. (1988) favors the middle distance.
The velocity field of MCG+00-32-16 is shown in Fig. 3. The galaxy appears to be in quite regular solid body rotation out to the edge of the stellar distribution, typical of many dwarf irregulars. The line-of-sight velocity dispersion is essentially constant over the face of the galaxy; the average value is 10.7 km , but since this is comparable to the channel spacing it should be regarded more as an upper limit than a measurement.
In Fig. 4 we show position-velocity diagrams for a cut along the major axis of the galaxy and for the galaxy projected onto its major axis (i.e., summed along the minor axis). These confirm the solid-body nature of the rotation.
The integrated spectrum of the galaxy is shown in Fig. 5. From it, we can estimate a profile width at 50% of the peak and a systemic velocity at the midpoint between the two sides at the 50% points: km and km . These agree well within the uncertainties with those measured by Garcia et al. (1993) at Nançay.
The AIPS task GAL allows us to determine the rotation velocities within annuli centered on the optical nucleus of the galaxy. The nearly solid-body rotation curve of the galaxy makes it impossible for us to determine a kinematical inclination; we are forced to rely on the optical axes to determine . We keep that and the position angle of the H I distribution, (or for the receding end; this differs slightly from the position angle of the optical isophotes), fixed for all rings. In Fig. 6 the resulting rotation curve is plotted, with negative positions and velocities corresponding to the approaching (SE) side and positive values to the receding side. Clearly, no continuation of the rotating disk could account for the absorber since its velocity difference is opposite the sense of rotation of the galaxy. There is a suggestion of a warp, with the rotation curve turning over on the approaching side but continuing to rise steeply on the receding side, but the statistical significance is low. If we assume that the last point on each side is unduly influenced by non-circular motions and uncertainty in its inclination, we might take km as the maximum rotation velocity and assume that that value holds out to the maximum radius at which significant flux is observed, . Then the dynamical mass of the galaxy is , where we have included the contribution due to random velocities (Hoffman et al. 1996).
2.2 CCD surface photometry
CCD images in B and R were taken under photometric conditions with the 24-inch telescope at the Table Mountain Observatory of Jet Propulsion Laboratory on May 16, 1994 (UT). The resolution is limited by a poor seeing of about (FWHM). The total integration times are 1200 seconds in R and 2400 seconds in B. The final magnitudes were tied to the Johnson B and Cousins R systems via observing standard stars in Landolt (1983). Surface photometry analysis was performed on each of the images following the prescription given by Lu et al. (1993). The resulting surface brightness profiles are shown in Fig. 7. In Table 4, we give total magnitudes in B and R, the isophotal diameters at B 25 and R 24.5 mag arcsec-2, as well as the following parameters for the galaxy disk: the mean ellipticity, the position angle, the exponential scale length as defined in , and the central surface brightness . Since the R-band image is deeper, these disk parameters are derived from the fit to the R data alone. The quoted statistical r.m.s. uncertainties in Table 4 are our best estimates.
2.3 Rotation curve decomposition
Plots of mass surface densities in stars (assuming for the purposes of this figure) and gas (including H I and primordial helium but neglecting ionized and molecular gas) are given in the right-hand panel of Fig. 7. The stellar disk appears to fall exponentially over the entire range of radii for which surface brightnesses could be measured. The H I profile flattens out at small radii, but at large radii it continues the exponential distribution of the stellar disk. It is reasonable to suppose that the baryonic (stars plus gas) disk falls exponentially from the center to the outermost observed H I contour. The scalelength of the stellar disk is , or 0.86 kpc; that of the H I is 1.73 kpc if the fit includes all points at radii kpc, or 1.28 kpc if the fit is restricted to the first 4 points beyond the edge of the stellar disk.
If random motions are not included in the analysis, we cannot fit the observed rotation curve at all unless the galaxy is very close to face-on () or the mass-to-light ratio in the R band, , is miniscule. Therefore we take the dynamically relevant velocity to be as discussed in Hoffman et al. (1996). A maximum disk hypothesis then gives ; the decomposition is shown in Fig. 8. There is the usual need for a dark matter halo beyond kpc. Incidentally, that same mass-to-light ratio gives the best single exponential fit to the combined stars+gas disk, with a scalelength of kpc.
3 Discussion
The galaxy MCG+00-32-16 is about as “regular” as an irregular galaxy gets. With , (corresponding to a stellar mass ), , , blue optical radius kpc, and km (all assuming a 19 Mpc distance), MCG+00-32-16 is slightly high in as compared to radius, dynamical mass or H I mass, but well within the scatter of other irregular galaxies that have been mapped in H I (Salpeter & Hoffman 1996). There are no signs of out-lying H I clouds to a column density limit of about atoms . We know, however, that there is low column density gas at a radius , or kpc, more or less along the major axis toward the NW, as indicated by the arrow drawn on Fig. 2. This is the position of the line-of-sight to 3C 273, where HST observations found a Ly absorber at heliocentric velocity 1012 km (Bahcall et al. 1991; Morris et al. 1991; Morris et al. 1993). Among the galaxies closest in projection to the line-of-sight, MCG+00-32-16 has the closest redshift (1106 km ) to that of the absorber (Salpeter & Hoffman 1995) while the “protogalaxy” H I 1225+01 (Giovanelli & Haynes 1989), at kpc, is slightly closer in projected distance (redshift 1284 km ). The projected distance between MCG+00-32-16 and H I 1225+01 is kpc. Fig. 9 shows that the three objects are well separated from all other known galaxies at comparable redshifts in that part of the sky.
Note that, if the absorber were attached to MCG+00-32-16, the absorber must be counter-rotating with respect to the H I disk (see Fig. 6). The velocity difference between either galaxy and the absorber is much greater than the maximum rotation velocity of either galaxy. Therefore it seems unlikely that the absorber is directly associated with either galaxy. This should be compared to the findings of Barcons et al. (1995) for absorbers in the spectra of the quasars 17046048 and 21351446; in each of those cases the absorber happened to fall on the side of the major axis where the galaxy rotation creates gas velocity tending toward the absorber’s velocity while in our case the absorber falls on the opposite side of the major axis. Consequently, while the extended disk [type (1)] interpretation was tenable for Barcons et al. (although the galaxy-absorber velocity differences are rather large), it is not tenable for MCG+00-32-16. With the absorber being closer to one galaxy in velocity and closer to the other in projected distance, all three objects are likely to form one group (possibly with additional unobservable Ly forest clouds that happen not to fall along the line of sight to the quasar). There are no other galaxies with in the range 700 to km within of the 3C 273 sight-line. Mo et al. (1994) and Dalcanton et al. (1997a) have suggested that low surface brightness galaxies (of which MCG+00-32-16 and H I 1225+01 are examples) show slightly less correlation than bright galaxies and are likely to reside preferentially in loose galaxy groups with small velocity dispersion. The total velocity spread in this group (absorber to H I 1225+01) is only 272 km, suggesting a smaller velocity dispersion than for typical galaxy groups (Ramella et al. 1997).
Several of the papers cited in the Introduction have discussed low redshift Ly forest absorbers residing in galaxy groups, either as (a) tidal debris from individual visible galaxies or (b) separate, optically invisible objects, each with its own dark matter halo. Poor groups with very small total galaxy luminosity are better candidates for (b) than for (a). The possible fate of gas in a halo of radius with characteristic velocity , under the influence of the ubiquitous ionizing UV flux, has been discussed by many authors (at least for isolated halos): (i) For km, the gas temperature K imposed by the UV causes the gas to escape from the halo. In a group environment collisions heat the gas further and it can contribute very little to Ly absorption (Mulchaey et al. 1996). (ii) For km most, but not all, of the gas collapses to radii much smaller than conserving angular momentum acquired through tidal torquing (see Dalcanton et al. 1997b), forming a disk galaxy with a sharp outer H I edge (Maloney 1993; Corbelli & Salpeter 1993; Dove & Shull 1994). The small neutral fraction of gas between this edge and presumably supplies the Ly forest of type (1). (iii) For dwarf irregular galaxies with at or just above km, there are various possibilities for removing much of the inner gas to the halo leaving very little stellar luminosity (faded dwarfs or Cheshire Cats). These nearly invisible galaxies are good candidates for the type (2) Ly forest (Babul & Rees 1992; Salpeter 1993; Vedel et al. 1994; Efstathiou 1995; Salpeter & Hoffman 1995; Quinn et al. 1996; Babul & Ferguson 1996; Shull et al. 1996).
(iv) The transition region km has become an even more attractive candidate for the type (2) forest as a result of some recent calculations (Thoule & Weinberg 1996; Tegmark et al. 1997; Kepner et al. 1997). Over an appreciable range of values of most of the gas is able to stay in thermal and Virial equilibrium while filling the whole halo volume. Shull et al. (1996) have shown that a conservative extrapolation of the galaxy luminosity function (Marzke et al. 1994) could give enough such “failed dwarfs” for the Ly forest if kpc, contributing a dark matter density parameter . If scales with the optical radius for disk galaxies, then (Salpeter & Hoffman 1996) and slightly smaller values of may be more likely. There is ongoing controversy on the number density of undetected low surface brightness dwarfs (Briggs 1997; Dalcanton et al. 1997a), but there may be a sufficient number of failed dwarfs even for smaller . Calculations are still needed to see whether the intra-group gas pressure can confine gas in the halo of the failed dwarf for even smaller values of .
If Ly forest absorption in galaxy groups is partly due to tidal debris and partly due to failed dwarf galaxies, one might expect a double-humped distribution of metal abundances (tidal debris having the larger abundance). Better statistics are needed in general and for the 3C 273 absorber in particular there are only rather high upper limits (Weymann et al. 1995; Brandt et al. 1997).
4 Conclusions and summary
Neutral hydrogen synthesis mapping of the irregular galaxy MCG+00-32-16, closer than any other galaxy in position-redshift space to the lowest redshift absorber along the 3C 273 line-of-sight, reveals that it is rotating in the wrong sense for the absorber to have anything to do with an extended disk of the galaxy, even though the absorber is only 204 kpc distant in projection from the galaxy and has velocity difference only 94 km . Neither can an extended “disk” around the next closest (by a small margin) galaxy, H I 1225+01 (Giovanelli et al. 1991), account for the absorber. This system therefore runs counter to the interpretation [our Type (1)] presented by Barcons et al. (1995) for two otherwise similar cases in which the rotation turned out to be in the other sense.
Measurement of the luminosity profile in B and R, along with the H I column density profile, allow us to assess the contributions of the gas and stars to the observed rotation curve. The “maximum disk” fit requires only a modest for the stellar disk, but dark matter is required outside 1.5 scalelengths as in most irregular and spiral galaxies. Our measurements of total luminosity give , , and . The 50% profile width and blue optical radius kpc lead to (all assuming a 19 Mpc distance).
The failure of the extended disk hypothesis makes it more likely that MCG+00-32-16, H I 1225+01 and the 3C 273 absorber form part of a sparse galaxy group. The lack of evidence for tidal debris in the 3C 273 system has led us to consider other models for Ly gas in a galaxy group. In particular, the “failed dwarf” model (see Shull et al. 1996), assisted by intra-group gas pressure, may be attractive for absorbers in loose galaxy groups. Heavy element abundances would help to discriminate between fds and tidal debris, but the column densities of the 3C 273 low redshift absorbers are too low to permit the necessary measurements with existing (or envisioned) instruments.
References
- (1)
- (2) Babul, A., & Ferguson, H.C. 1996, ApJ, 458, 100
- (3)
- (4) Babul, A., & Rees, M.J. 1992, MNRAS, 255, 346
- (5)
- (6) Bahcall, J.N., Jannuzi, B.T., Schneider, D.P., & Hartig, G.F. 1993, ApJ, 405, 491
- (7)
- (8) Bahcall, J.N., Jannuzi, B.T., Schneider, D.P., Hartig, G.F., & Green, R.F. 1992a, ApJ, 397, 68
- (9)
- (10) Bahcall, J.N., Jannuzi, B.T., Schneider, D.P., Hartig, G.F., & Jenkins, E.B. 1992b, ApJ, 398, 495
- (11)
- (12) Bahcall, J.N., Jannuzi, B.T., Schneider, D.P., Hartig, G.F., Bohlin, R., & Junkkarinen, V. 1991, ApJ, 377, L5
- (13)
- (14) Bahcall, J.N., & Salpeter, E.E. 1965, ApJ, 142, 1677
- (15)
- (16) Bahcall, J.N., & Spitzer, L. 1969, ApJ, 156, L63
- (17)
- (18) Barcons, X., Lanzetta, K.M., & Webb, J.K. 1995, Nature, 376, 321
- (19)
- (20) Bi, H., & Davidsen, A.F. 1997, ApJ, 479, 523
- (21)
- (22) Bowen, D.V., Blades, J.C., & Pettini, M. 1996, ApJ, 464, 141
- (23)
- (24) Bowen, D.V., Osmer, S.J., Blades, J.C., & Tytler, D. 1997a, MNRAS, 284, 599
- (25)
- (26) Bowen, D.V., Pettini, M., & Boyle, B.J. 1997b, MNRAS, in press
- (27)
- (28) Brandt, J.C., et al. 1997, AJ, 114, 554
- (29)
- (30) Briggs, F.H. 1997, ApJ, 484, 618
- (31)
- (32) Carignan, C., Beaulieu, S., & Freeman, K.C. 1990, AJ, 99, 178
- (33)
- (34) Chen, H.-W., Lanzetta, K.M., Webb, J.K., & Barcons, X. 1998, ApJ, in press
- (35)
- (36) Corbelli, E., & Salpeter, E.E. 1993, ApJ, 419, 94
- (37)
- (38) Dalcanton, J.J., Spergel, D.N., Gunn, J.E., Smith, M., & Schneider, D.P. 1997a, AJ, 114, 635
- (39)
- (40) Dalcanton, J.J., Spergel, D.N., & Summers, F.J. 1997b, ApJ, 482, 659
- (41)
- (42) Dove, J.B., & Shull, J.M. 1994, ApJ, 423, 196
- (43)
- (44) Efstathiou, G. 1995, MNRAS, 272, L25
- (45)
- (46) Fernandez-Soto, A., Lanzetta, K.M., Barcons, X., Carswell, R.F., Webb, J.K., & Yahil, A. 1996, ApJ, 460, L85
- (47)
- (48) Garcia, A.M., Bottinelli, L., Garnier, R., Gouguenheim, L., & Paturel, G. 1993, A&AS, 97, 801
- (49)
- (50) Giovanelli, R., Williams, J.P., & Haynes, M.P. 1991, AJ, 101, 1242
- (51)
- (52) Gunn, J.E., & Peterson, B.A. 1965, ApJ, 142, 1633
- (53)
- (54) Hernquist, L., Katz, N., Weinberg, D.H., & Miralda-Escudé, J. 1996, ApJ, 457, L51
- (55)
- (56) Hoffman, G.L., Lu, N.Y., Salpeter, E.E., Farhat, B., Lamphier, C., & Roos, T. 1993, AJ, 106, 39
- (57)
- (58) Hoffman, G.L., Salpeter, E.E., Farhat, B., Roos, T., Williams, H., & Helou, G. 1996, ApJS, 105, 269
- (59)
- (60) Jimenez, R., Heavens, A.F., Hawkins, M.R.S., & Padoan, P. 1997, MNRAS, 292, L5
- (61)
- (62) Kepner, J.V., Babul, A., & Spergel, D.N. 1997, ApJ, 487, 61
- (63)
- (64) Krumm, N., & Burstein, D. 1984, AJ, 89, 1319
- (65)
- (66) Landolt, A.U. 1983, AJ, 88, 439
- (67)
- (68) Lanzetta, K.M., Webb, J.K., & Barcons, X. 1996, ApJ, 456, L17
- (69)
- (70) Le Brun, V., Bergeron, J., & Boissé, P. 1996, A&A, 306, 691
- (71)
- (72) Lu, N.Y., Hoffman, G.L., Groff, T., Roos, T., & Lamphier, C. 1993, ApJS, 88, 383
- (73)
- (74) Maloney, P. 1992, ApJ, 398, L89
- (75)
- (76) Maloney, P. 1993, ApJ, 414, 41
- (77)
- (78) Marzke, R.O., Huchra, J.P., & Geller, M.J. 1994, ApJ, 428, 43
- (79)
- (80) Meiksin, A. 1994, ApJ, 431, 109
- (81)
- (82) Miralda-Escudé, J., Cen, R., Ostriker, J.P., & Rauch, M. 1996, ApJ, 471, 582
- (83)
- (84) Mo, H.J., McGaugh, S.S., & Bothun, G.D. 1994, MNRAS, 267, 129
- (85)
- (86) Mo, H.J., & Morris, S.L. 1994, MNRAS, 269, 52
- (87)
- (88) Morris, S.L., & van den Bergh, S. 1994, ApJ, 427, 696
- (89)
- (90) Morris, S.L., Weymann, R.J., Dressler, A., McCarthy, P.J., Smith, B.A., Terrile, R.J., Giovanelli, R., & Irwin, M. 1993, ApJ, 419, 524
- (91)
- (92) Morris, S.L., Weymann, R.J., Savage, B.D., & Gilliland, R.L. 1991, ApJ, 377, L21
- (93)
- (94) Mulchaey, J.S., Mushotzky, R.F., Burstein, D., & Davis, D.S. 1996, ApJ, 456, L5
- (95)
- (96) Petitjean, P., Mucket, J.P., & Kates, R.E. 1995, A&A, 295, L9
- (97)
- (98) Quinn, T., Katz, N., & Efstathiou, G. 1996, MNRAS, 278, L49
- (99)
- (100) Ramella, M., Pisani, A., & Geller, M.J. 1997, AJ, 113, 483
- (101)
- (102) Rauch, M., Weymann, R.J., & Morris, S.L. 1996, ApJ, 458, 518
- (103)
- (104) Salpeter, E.E. 1993, AJ, 106, 1265
- (105)
- (106) Salpeter, E.E., & Hoffman, G.L. 1995, ApJ, 441, 51
- (107)
- (108) Salpeter, E.E., & Hoffman, G.L. 1996, ApJ, 465, 595
- (109)
- (110) Salzer, J.J. 1992, AJ, 103, 385
- (111)
- (112) Shull, J.M., Stocke, J.T., & Penton, S. 1996, AJ, 111, 72
- (113)
- (114) Spitzer, L. 1956, ApJ, 124, 20
- (115)
- (116) Stocke, J.T., Shull, J.M., Penton, S., Donajue, M., & Carilli, C. 1995, ApJ, 451, 24
- (117)
- (118) Tegmark, M., Silk, J., Rees, M.J., Blanchard, A., Abel, T., & Palla, F. 1997, ApJ, 474, 1
- (119)
- (120) Thoule, A.A., & Weinberg, D.H. 1996, ApJ, 465, 608
- (121)
- (122) Tripp, T.M., Lu, L., & Savage, B.D. 1997, ApJS, 112, 1
- (123)
- (124) Ulmer, A. 1996, ApJ, 473, 110
- (125)
- (126) van Gorkom, J. 1993, in The Environment and Evolution of Galaxies, ed. J.M Shull & H.A. Thronson (Dordrecht: Kluwer), 345
- (127)
- (128) van Gorkom, J.H., Bahcall, J.N., Jannuzzi, B.T., & Schneider, D.P. 1993, AJ, 106, 2213
- (129)
- (130) van Gorkom, J.H., Carilli, C.L., Stocke, J.T., Perlman, E.S., & Shull, J.M. 1996, AJ, 112, 1397
- (131)
- (132) Vedel, H., Hellsten, U., & Sommer-Larsen, J. 1994, MNRAS, 271, 743
- (133)
- (134) Wang, B. 1995, ApJ, 444, L17
- (135)
- (136) Weymann, R., Rauch, M., Williams, R., Morris, S., & Heap, S. 1995, ApJ, 438, 650
- (137)
- (138) Zhang, Y., Anninos, P., & Norman, M.L. 1995, ApJ, 453, L57
- (139)
![[Uncaptioned image]](/html/astro-ph/9801189/assets/x1.png)
![[Uncaptioned image]](/html/astro-ph/9801189/assets/x2.png)