Boron in Very Metal-Poor Stars111Based on observations obtained with the NASA/ESA Hubble Space Telescope (HST) at the Space Telescope Science Institute, which is operated by the Association of Universities for Research in Astronomy, Inc., under NASA contract NAS5-26555
Abstract
We have observed the B I 2497 Å line to derive the boron abundances of two very metal-poor stars selected to help in tracing the origin and evolution of this element in the early Galaxy: BD 23°3130 and HD 84937. The observations were conducted using the Goddard High Resolution Spectrograph on board the Hubble Space Telescope. A very detailed abundance analysis via spectral synthesis has been carried out for these two stars, as well as for two other metal-poor objects with published spectra, using both Kurucz and OSMARCS model photospheres, and taking into account consistently the NLTE effects on the line formation. We have also re-assessed all published boron abundances of old disk and halo unevolved stars. Our analysis shows that the combination of high effective temperature ( K, for which boron is mainly ionized) and low metallicity ([Fe/H] ) makes it difficult to obtain accurate estimates of boron abundances from the B I 2497 Å line. This is the case of HD 84937 and three other published objects (including two stars with [Fe/H] ), for which only upper limits can be established. BD 23°3130, with [Fe/H] and log N(B), appears then as the most metal-poor star for which a firm measurement of the boron abundance presently exists. The evolution of the boron abundance with metallicity that emerges from the seven remaining stars with K and [Fe/H] , for which beryllium abundances were derived using the same stellar parameters, shows a linear increase with a slope . Furthermore, the B/Be ratio found is constant at a value for stars in the range . These results point to spallation reactions of ambient protons and particles with energetic particles enriched in CNO as the origin of boron and beryllium in halo stars.
1 Introduction
Understanding the origins of the chemical elements is a fundamental goal of contemporary astrophysics. As this understanding has advanced in recent years, a few elements have been rather neglected. Boron is one such element. A primary reason for its neglect has been that stellar absorption lines of the boron atom and ions are not detectable in spectra obtainable from the ground; the low abundance of boron means that this element is detectable only through its strong resonance lines which are in the ultraviolet. The advance in ultraviolet stellar spectroscopy made possible by the Hubble Space Telescope (HST) and its Goddard High Resolution Spectrograph (GHRS) has led to new data on the boron abundance of cool and hot stars.
Pioneering work on stellar boron abundances was presented by Boesgaard & Heacox (1978) who analyzed the B II 1362 Å resonance line in spectra of early-type stars observed with the Copernicus satellite. To map the evolution of boron with metallicity it is necessary to observe unevolved metal-poor stars. Since these are cool, boron detection has to be made using the atomic resonance lines. No advance in our knowledge of the boron abundance came with the International Ultraviolet Explorer (IUE) satellite (an attempt to detect the B I resonance lines near 2497 Å in a metal-poor star was made by Molaro 1987). Duncan, Lambert, & Lemke’s (1992) detection and analysis of the B I 2497 Å lines in three metal-poor stars observed with the GHRS has been followed by other studies of these lines – see Edvardsson et al. (1994), Rebull et al. (1996), and Duncan et al. (1997a, 1998). Kiselman (1994) and Kiselman & Carlsson (1996) showed that non-local thermodynamic equilibrium (NLTE) effects have to be considered in analyses of the 2497 Å lines.
Standard big bang nucleosynthesis calculations do not predict a significant production of 6Li, 9Be, 10B, and 11B, which are thought to be produced by spallation reactions between cosmic rays and CNO nuclei (see Ramaty, Kozlovsky, & Lingenfelter 1996 and Ramaty et al. 1997 for recent discussions on the theoretical yields). Models of inhomogeneous big bang nucleosynthesis suggest that observable amounts of Be and B could be produced (e.g. Malaney & Fowler 1989; Kajino & Boyd 1990; Jedamzik et al. 1994), but this possibility has been questioned on the theoretical grounds (e.g. Terasawa & Sato 1990; Reeves et al. 1990).
In this paper, we derive the boron abundances of two metal-poor stars observed by us to fill in specific places of the study of the evolution of boron. BD °3130 is a cool very metal-poor star ([Fe/H]) selected to extend B abundance determinations to a star of a factor of two more deficient than HD 140283 ([Fe/H]; previously studied by Duncan et al. 1992 and Edvardsson et al. 1994), and is probably the most metal-poor slightly evolved star for which boron can be measured with HST. Duncan et al. (1997a) has also observed two stars (BD °3442 and BD 3°740) with metallicities [Fe/H]; however, they are much warmer and, hence, boron is mainly ionized making more difficult to obtain a precise measurement of its abundance from the B I lines. Our second star, HD 84937, is of special interest because 6Li (another expected product of spallation and fusion reactions driven by cosmic rays) has been traced in its atmosphere (Smith, Lambert, & Nissen 1993; Hobbs & Thorburn 1994, 1997). Both stars also have previous measurements of 7Li in the literature, and have been included in the samples for deriving beryllium and oxygen (from UV OH lines) abundances in metal-poor stars by García López et al. (1998) and Israelian, García López, & Rebolo (1998), respectively, using the same stellar parameters.
To better study the dependence of the derived abundances on the tools usually employed in the analyses, we present here the first detailed comparison of boron abundances derived using the two sets of model photospheres widely employed in the analyses of stellar spectra: those calculated with the ATLAS program, constructed by R. L. Kurucz, and those from the MARCS program, developed at Uppsala Astronomical Observatory. In both cases there have been considerable recent developments in these codes and their underlying input data. This careful analysis of boron abundances in very metal-poor stars, in which we also re-assess published abundances of old disk and halo unevolved stars, is aimed at better constraining observationally the nucleosynthetic origins of boron.
2 Observations
Observations of the stars BD °3130 and HD 84937 were carried out using the GHRS in the low resolution G270M/SSA mode (). The G270M grating was centered at 2497 Å to observe the B I doublet located at 2496.772 and 2497.723 Å (air values). The standard FP-SPLIT mode, which provides spectra in slightly different carrousel positions, was used to obtain high signal-to-noise ratios (S/N) and minimize the effects of the photocathode glitches and the geomagnetically-induced image motion problem (GIMP). Exposure times were estimated from the UV fluxes measured by IUE at 2500 Å for our targets. BD °3130 is a cool metal-poor giant with and was observed with HST during ten orbits (21434 sec exposure time) on 1995 August 4, while HD 84937 is a hotter metal-poor dwarf with which required three orbits (5440 sec) on 1996 March 21.
Data reductions were performed by standard procedures using the “stsdas” package of the IRAF222IRAF is distributed by National Optical Astronomy Observatories, which is operated by the Association of Universities for Research in Astronomy, Inc., under contract with the National Science Foundation, USA. suite of programs. Final S/N values of 100 and 125 per diode (50 and 63 per pixel) were achieved for BD °3130 and HD 84937, respectively. Their corresponding measured continuum fluxes at 2500 Å were and erg cm-2 s-1 Å-1. These values are about 30–40% larger than those measured by IUE at that wavelength, and these differences are reduced to 20–25% when the HST data are degraded to match the IUE spectral resolution. Differences in the flux calibrations of both instruments should explain these discrepancies.
The wavelength calibration provided a dispersion of 0.024 Å pixel-1, and the final spectra were shifted in wavelength to correct for stellar and Earth motions using the Fe I 2496.533 Å line as the reference. Continuum normalization is a difficult task in a crowded spectral region like this one. In principle, the HST spectra have been corrected for the spectrograph efficiency versus wavelength. A soft curve was fitted to the upper points of the spectra, assigning a value of 1 to those pixels corresponding to the region just shortwards of 2500 Å, considered by Duncan et al. (1992; 1997b) and Edvardsson et al. (1994) as the most line-free region in the data. Spectral syntheses performed afterwards showed that this criterion agrees well with the predictions of synthetic spectra. Figure 1 shows a portion of the final spectra for both stars.
3 Stellar Parameters
Effective temperatures () were estimated initially using the Alonso, Arribas, & Martínez-Roger (1996a) calibrations versus and colors, which were derived applying the Infrared Flux Method (Blackwell et al. 1990), and cover a wide range in spectral types and metal content. Both stars, BD °3130 and HD 84937, belong to a large sample of metal-poor stars for which García López et al. (1998) have derived beryllium abundances. All the details on photometric measurements, as well as on the selection of metallicity values for these two stars are provided in that work.
Surface gravities () were determined by comparing the observed Strömgren and indices with synthetic ones generated using the corresponding filter transmissions and a grid of Kurucz (1992) blanketed model atmospheres fluxes. This is also explained in detail by García López et al. (1998), where a comparison is given with the spectroscopic estimates by other authors. In particular, Nissen, Hg, & Schuster (1997) have recently derived surface gravities for a sample of 54 metal-poor stars using Hipparcos parallaxes to determine luminosities. For ten stars in common, the gravities derived by García López et al. are slightly lower systematically, with a mean difference of dex in . As we will see below, a difference of this magnitude does not affect the boron abundances derived from the B I 2497 Å lines in metal-poor stars. BD °3130 had been generally considered in the past as a subgiant star with , but the comparison of its Strömgren indices with our synthetic photometry indicates that it is a giant star with .
García López et al. (1998) computed synthetic spectra in the region around the Be II doublet at 3131 Å (used to derive beryllium abundances) for different combinations of the stellar parameters, within the error bars provided by the photometric calibrations, and Table 1 lists the values which best reproduce the observations. These values also reproduce well the B I region observed in BD °3130 and HD 84937, with the exception of the derived metallicity which is slightly higher than that found from optical and near-UV analyses, as explained in the next section.
Apart from our observations, we have also derived boron abundances for Procyon and for the other metal-poor stars with available measurements of the B I 2497 Å doublet. For Procyon we choose K, and [Fe/H], to be consistent with the analysis of Duncan et al. (1997b; see below). For consistency, we also estimated the stellar parameters for the other stars by the methods applied to our stars. Most of them were studied by García López et al. (1998). All metal-poor stars considered for boron abundances analysis in this work are listed in Table 1.
4 Abundances Analysis
4.1 Oscillator Strengths
Due to the general lack of accurate oscillator strengths for the lines in the B I region, we used a line list computed by comparing LTE synthetic spectroscopy with observed spectra of some stars. The initial line list was taken from Duncan et al. (1997b) who analyzed dwarfs and giants of approximately solar metallicity. The list was drawn from the Kurucz (1993) LOWLINES list with wavelengths measured in the laboratory but the values were adjusted to reproduce the spectra of Procyon, the Sun, Cen A & B, and the metal-poor star HD 140283. Several Fe I lines predicted by Kurucz as well as other lines of the same element studied by Johansson & Cowley (1988) and Johansson (1992) were added. Duncan et al.’s (1997b) line list is very similar to that compiled by Duncan et al. (1992).
Synthetic spectra were obtained by us using the code WITA2, a UNIX-based version of ABEL6 code (Pavlenko 1991), which computes LTE atomic and molecular synthetic profiles for a given model atmosphere. We employed initially a grid of models provided by Kurucz (1992), which are interpolated for given values of , , and [Fe/H]. To test the behavior of the Duncan et al. (1997b) line list using WITA2 and a high-resolution HST spectrum, we compared a spectrum of Procyon (observed by Lemke, Lambert, & Edvardsson 1993) with synthetic spectra obtained using the stellar parameters cited above, a microturbulent velocity km s-1, a wavelength step of 0.009 Å, and convolved with a gaussian with a FWHM of 0.027 Å to reproduce the observed spectral resolution. The stronger B I line at 2497.723 Å is seriously blended with other lines, and the abundance determination relies only on the B I line at 2496.772 Å, more isolated and weaker, which is blended with lines of Co I and Fe I at 2496.708 and 2496.870 Å, respectively. O’Brian & Lawler (1992) and Johansson et al. (1993) provide accurate values (which differ by only 0.03 dex) for the oscillator strength of this B I line. To improve the fit of the synthetic to the observed spectrum in the region surrounding the weaker B I line, we varied the s of 13 of the 20 lines present in the 2496.4–2497.4 Å region until a good fit was obtained. In particular, we adopted the value provided by O’Brian et al. (1991) for the Fe I 2496.533 Å line (with an uncertainty of 9%), the Fe I line 2496.933 Å was not taken into account, and we included two weak Fe I lines at 2497.153 and 2497.420 Å from the list used by Duncan et al. (1992), modifying also their s by 0.1 and 0.25 dex, respectively.
Figure 2 shows the comparison between the observed spectrum of Procyon and five synthetic spectra computed for different values of the boron abundance. The set of s employed to compute them reproduces the spectrum of Procyon with a similar quality to those illustrated by Lemke et al. (1993) and Duncan et al. (1997b). The boron abundance which best matches the observed spectrum is a value between log N(B) and 2.1 (in the customary scale where log N(B)log (B/H)12). The sensitivity of the observed feature to the boron abundance of the computed line is high, as can be seen in Figure 2: changes of 0.1 dex around log N(B) can be appreciated. Taking into account the uncertainty in the continuum placement and a change of 50 K in the assigned effective temperature, the boron abundance provided by this analysis is log N(B). Since the possibility of unidentified lines located close to the B I 2496.772 Å line cannot be excluded, this abundance should be considered strictly as an upper limit.
Our LTE boron abundance for Procyon is 0.15 dex smaller and 0.15 dex higher than those obtained by Duncan et al. (1997b) and Lemke et al. (1993), respectively. In the latter case, the model photosphere employed was computed using the MARCS code with the opacity sampling method (OSMARCS) as described by Edvardsson et al. (1993). Using the LTE code SPECTRUM included in the Uppsala Synthetic Spectrum Package, we have computed synthetic spectra for Procyon with the line list previously compiled and an OSMARCS model atmosphere. In this case, the boron abundance which best matches the observed spectrum is between log N(B) and 2.0, just 0.1 dex smaller than the value obtained using a Kurucz model. Figure 3 shows the fits to the observed spectrum using both sets of model photospheres and a common boron abundance log N(B). It can be seen that they are very similar, being the larger differences in the wavelength range 2496.8 to 2497.2 Å (very slight changes in the values used would be needed to obtain a similar good fit with the OSMARCS model), but not affecting significantly the abundance derived from the B I 2496.772 Å line. Kurucz models used in our analyses were computed with a mixing length parameter , and we have checked (by running the program ATLAS9 using the UNIX-based version assembled by M. Lemke and distributed through the CCP7 database333http://star.arm.ac.uk/ccp7/) that these models do not include overshooting. OSMARCS models do not include overshooting either and were computed with . A very good agreement between spectra computed with both sets of models was found also by García López, Severino, & Gomez (1995) for the analysis of the Be II 3131 Å region, showing negligible differences in beryllium abundances (using MARCS models treating the line blanketing by means of opacity distribution functions and applying wavelength-dependent scaling factors to the total H- opacity).
The very good agreement between these independent analyses in a metal-rich star like Procyon gives us a certain level of confidence to proceed to derive boron abundances in other stars. It should be noted, however, that gross similarities among the analyses does not preclude the possibility of systematic errors. Furthermore, the presence of greater uncertainties in the model photospheres for metal-poor stars (e.g. Gratton, Caretta, & Castelli 1996) will constrain also the validity of abundances derived in those stars.
4.2 BD +23°3130 and HD 84937
4.2.1 Spectral Synthesis
Using our line list and the stellar parameters listed in Table 1, we computed synthetic spectra of the two stars observed by us using both Kurucz and OSMARCS models. Computations were made with a step of 0.024 Å in wavelength and convolved with a gaussian to account for the spectral resolution of the observations. We had initially assigned a metallicity of to BD °3130 following the Be analysis by García López et al. (1998); however, a better overall fit to the B I region is obtained when values of [Fe/H] and are used for Kurucz and OSMARCS models, respectively. Figure 4 shows the comparison between observed and synthetic spectra (computed for different boron abundances) of this star using a Kurucz model. The major features surrounding the B I 2496.772 Å line are reproduced, although they are not fully fitted. The sensitivity of the synthetic spectra to boron abundance is seen in detail in Figure 4. The boron abundance of BD °3130 is log N(B), and changes of 0.1 dex around this value are clearly appreciated. The spectrum computed with log N(B)= (no boron) shows much smaller features for both lines of the B I doublet, indicating that we have a positive detection of boron in this star. The errors in the boron abundance associated with variations of K in , dex in , and dex in [Fe/H] are , 0, and , respectively. The B I line is too weak to be sensitive to the uncertainty of the adopted microturbulence ( km s-1). Placement of the continuum was checked by computing a synthetic spectrum in the 2499–2501 Å region using the Duncan et al. (1997b) line list at those wavelengths. At 2499.96 Å both synthetic and observed spectra reach a value of 1. Taking into account the S/N and the possible errors in normalizing the observed spectrum, an additional error of dex can be considered. Combining all these uncertainties, the final LTE boron abundance of BD °3130 is log N(B).
The analysis carried out with the same stellar parameters (except [Fe/H]) using OSMARCS models provided an abundance log N(B), showing the same sensitivity to changes in boron abundance as well as similar uncertainties related to the choice of the stellar parameters and continuum location. A comparison between the best fits to the observed spectrum obtained with both sets of models is shown in Figure 5.
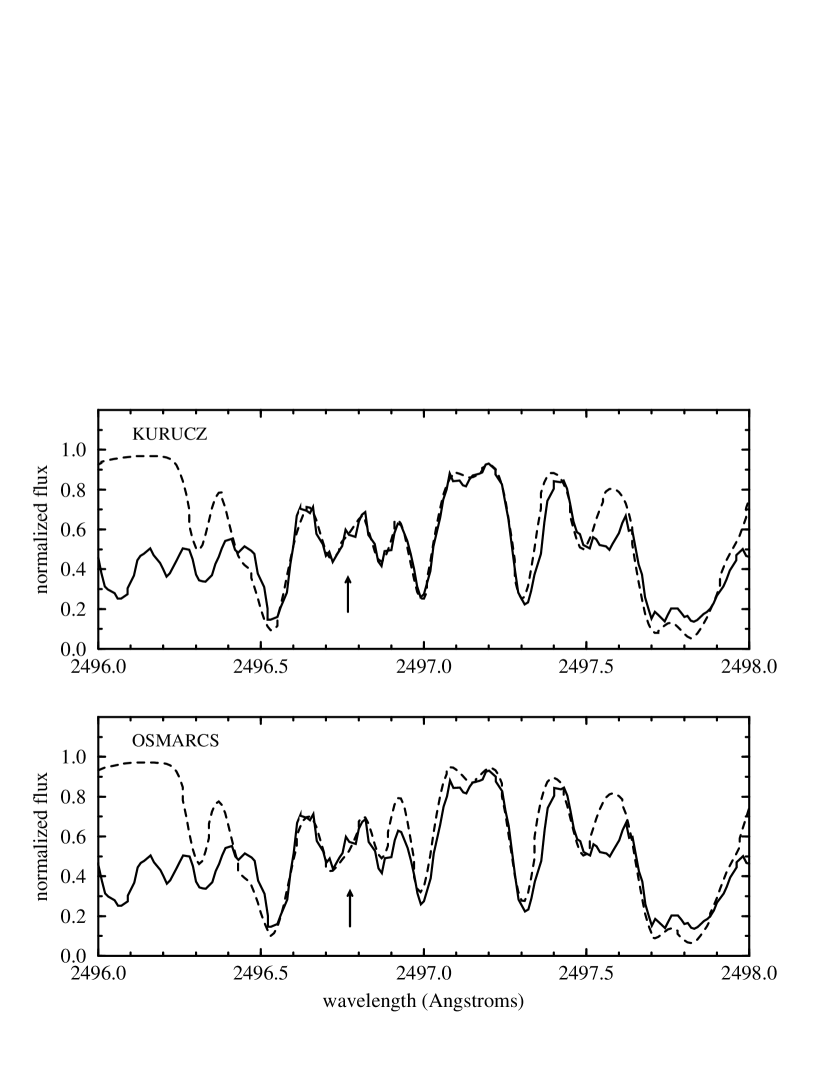
A similar procedure was followed to obtain the boron abundance of HD 84937. A comparison between observed and synthetic spectra computed with a Kurucz model is shown in Figure 6. The B I line is weaker for a given abundance in HD 84937 than in BD °3130 because boron is more ionized. The observed spectrum is reproduced with a value between log N(B) and (Figure 6) but, at this S/N level and with the uncertainties present in the parameters of the lines surrounding the B I line, a fit to the synthetic spectrum computed without boron (log N(B)), or with other intermediate boron abundance, cannot be ruled out. This means that log N(B) must be considered an upper limit to the boron abundance in this star. As in the previous case, it was necessary to increase the adopted metallicity from [Fe/H] to to obtain an overall good fit. Figure 7 shows the comparison between the fits to the observed spectrum obtained using Kurucz and OSMARCS models with the same stellar parameters and boron abundance. It can be seen how the overall behavior is very similar in both cases, as well as the upper limit at log N(B). The uncertainties of K in , dex in , in [Fe/H], and continuum placement will change this value within dex. Taking these uncertainties into account, Table 1 reflects a conservative upper limit log N(B) for this star.
Spectral lines appear to be broader in BD °3130 with respect to HD 84937. The instrumental profile should be the dominant contributor to the line widths and this ought to be the same for the two stars. Additional broadening would arise if BD °3130 were a spectroscopic binary such that a weaker line was present slightly shifted to lower wavelengths. However, this star does not appear as a binary or suspected binary star in the literature, especially in the survey of proper motions of about 500 stars studied by Carney et al. (1994). On the other hand, HD 84937 is listed as a suspected binary in the catalog of Carney et al. and classified as a certain binary by Stryker et al. (1985) from radial velocity measurements, although is not considered as a possible binary by Nissen et al. (1997). Duncan et al. (1997b) observed two giant K-type stars belonging to the Hyades, as well as the field giant Gem. The composite spectrum of the Hyades stars and the spectrum of Gem show similar broad lines which are, in general, deeper than those observed in BD °3130 due to the big differences in metallicity. In any case, the spectral syntheses carried out by us and by Duncan et al. (1997b) show a very high sensitivity of the B I feature to the boron abundance in giant stars.
4.2.2 Stellar Fluxes
A complementary test to check the validity of the model photospheres employed in the analysis consists in comparing predicted and observed stellar fluxes at the wavelength region under study. This is especially important in the ultraviolet, where an enormous number of lines are present such that the models may not account for the line blanketing. We exploit the absolute flux calibration provided with the HST spectra by following the Duncan et al.’s (1992) procedure, using the stellar magnitude at the (2.2 m) band to normalize the fluxes. magnitudes for our stars (6.98 for BD 23°3130 and 7.10 for HD 84937) were taken from Laird, Carney, & Latham (1988). Theoretical fluxes corresponding to the Kurucz models were obtained by interpolating the grid of models currently available at the CCP7 database, while they were computed individually for the OSMARCS models used in the analyses.
Below 4500 Å OSMARCS models are computed using opacity sampling techniques, while at longer wavelengths opacity distribution functions (ODF) are employed. The latter method is used for computing Kurucz models at all wavelengths. Comparisons between both set of models show a very good agreement for IR wavelengths ( m), which decreases slightly with decreasing wavelength, and a significant difference appears for Å. Figure 8 shows the comparison in the UV (surrounding the B I region) for the Kurucz and OSMARCS models used for computing the synthetic spectra of Figure 7. It can be seen in the upper panels the differences associated with both ways of considering the line blanketing. These differences are strongly reduced by degrading the OSMARCS fluxes to the same resolution as Kurucz ones. That is shown in the lower panels, where we have convolved the OSMARCS fluxes with a gaussian with a sigma of 7 Å. This behavior is consistent with the very small differences observed between their synthetic spectra, and indicates that the continuum fluxes are independent of model family.
Comparisons between observed and predicted fluxes were carried out at 2500 Å. The ratios of the observed to predicted fluxes obtained using OSMARCS models for BD 3130 and HD 84937 are 1.24 and 1.20, respectively. These values are larger than the mean ratio resulting from the three metal-poor stars analyzed by Duncan et al. (1992). However, a ratio of 1.2 is compatible with the combined uncertainties in the models and in the HST flux calibrations, and we conclude that the models correctly reproduce the flux at 2500 Å.
4.3 Other Metal-Poor Stars
With the aim of tracing the evolution of boron from the early times of the Galaxy to the present, we decided to include in our study all metal-poor stars observed for their boron abundances. These stars are analyzed in a recent work by Duncan et al. (1997a), including their own observations as well as the three stars observed by Duncan et al. (1992).
4.3.1 Spectral Synthesis
Rebull et al. (1996) derived the boron abundance in a very interesting metal-poor star: BD °3442. These authors found an LTE abundance of log N(B), considering the following stellar parameters: [Fe/H], , and K. This value was revised to by Duncan et al. (1997a, 1998) using slightly different parameters ([Fe/H], , and K). Given that we had found only an upper limit to the abundance of the less metal-poor star HD 84937 with similar , we decided to carry out the analysis of BD °3442 using our tools. We took the observed spectrum from Figure 2 of Rebull et al. (1996) and computed synthetic spectra with different boron abundances using the same stellar parameters. The fit obtained is very similar to that of Rebull et al. (1996) and the boron abundance derived is log N(B). With respect to the sensitivity of the synthetic spectra to the abundance, we found the same behavior as in HD 84937, i.e., there are very small differences between spectra computed within a range of three orders of magnitude in boron abundance. In order to have the abundance for this star on our scale, we computed new spectra using the stellar parameters listed in Table 1, but increasing the metallicity by 0.1 dex to obtain a better overall fit (with both Kurucz and OSMARCS model atmospheres). Our best estimate for the boron abundance of this star is an upper limit at dex, and considering the usual uncertainties in stellar parameters, S/N, and continuum placement this value could change by dex. The adopted upper limit taking into account this uncertainty is then log N(B).
A similar behavior can be seen for the star BD °3578 in Figure 2 of Duncan et al. (1997a). There is but a very small difference between their synthetic spectra computed with log N(B)= and without boron. Our analysis of this star gives an upper limit of log N(B), using our adopted and but increasing the metallicity to [Fe/H] and for Kurucz and OSMARCS models, respectively (instead of the value listed in Table 1). The upper limit adopted taking into account the uncertainties in the analysis is log N(B).
These spectral syntheses show that the combination of high effective temperature and low abundance makes it difficult to obtain accurate estimates of boron in metal-poor stars with K using the B I 2496.772 Å line. Therefore, we consider the available spectra of these stars (including also BD °740, for which we have not computed synthetic spectra) to provide upper limits to the boron abundances. This consideration removes four important objects (in terms of their low metallicities) from the sample used to delineate the boron evolution.
A systematic effect present in all our spectral syntheses is that the metallicity indicated by the far UV (boron) spectra seems to be higher than that needed to reproduce the near UV (beryllium) and optical regions. In two cases (HD 84937 and BD °3442) these differences are within the error bars of the adopted metallicities, in another case (BD °3130) the difference is 0.1 dex higher than the error bar, and for BD °3578 this difference is 0.10–0.15 dex larger than the adopted error bar. A poor fit to the metallic lines surrounding the B I region is also observed in the spectral synthesis provided by Rebull et al. (1996) for BD °3442.
Spectral lines in the B I region are not resolved with the resolution of these GHRS observations. A line like the Fe I 2496.533 Å is very deep and saturated, and thus the core of the line is formed at the top of the atmosphere. We have checked that the model atmospheres are sufficiently extensive that the line is computed correctly. There remains the question as to whether the model represents adequately the real upper photosphere. Errors in the UV opacity, departures from LTE, or effects of convective overshoot and thermal inhomogeneities might contribute to the fact that the far UV synthetic spectra seem to need a higher metallicity to reproduce the observations. Although there is no clear correlation between these differences and the adopted metallicities for the four stars considered, this effect could also be metallicity dependent and so could cause a slight change of slope in the boron–[Fe/H] relation discussed in this paper.
4.3.2 Equivalent Widths
To adapt the abundances given by Duncan et al. (1997a) to our stellar parameters for those stars for which we have not carried out a detailed spectral synthesis, we computed the B I 2496.772 Å line with the boron abundances and stellar parameters listed in that work using Kurucz model atmospheres, and measured the corresponding synthetic equivalent widths. The adopted LTE abundances were those which matched these equivalent widths with the stellar parameters listed in Table 1. The sensitivity of our spectral synthesis to the stellar parameters is similar to that carried out by Duncan et al. (1997a), and we adopted their final errors to the abundances. Table 1 shows the final abundances obtained in this way. The differences between LTE boron abundances obtained using our stellar parameters and those of Duncan et al. (1997a) are in the range to 0.08 dex for all the stars, except for BD °740 with a difference of 0.25 dex. These differences are mainly due to differences in (up to 170 K for BD °740), and for stars with low metallicity the changes in abundance are larger for a given difference in with respect to more metal-rich stars.
We also derived LTE abundances for these stars using OSMARCS models and the equivalent widths previously computed with Kurucz model atmospheres. These abundances are also listed in Table 1. As expected, there is a systematic slight difference between both sets of abundances with a mean value . In all abundance estimates we have used a microturbulent velocity of 1 km s-1. For the most metal-poor stars analyzed the synthetic spectra have shown that the dependence of boron abundance on the microturbulence is negligible. In the most metal-rich stars of the sample, with higher boron abundances, the effect of changing the microturbulence by one additional km s-1 induces a change of 1–5% in the equivalent widths of the B I lines. Changes of this order affect the boron abundance by 0.01–0.07 dex for stars with [Fe/H].
As explained in Section 3, effective temperatures were estimated using the and calibrations of Alonso et al. (1996a), and corrected afterwards until a good fit to the Be II 3131 Å region was obtained (García López et al. 1998). With this procedure, two of the stars considered in this paper (BD °740 and HD 140283) show values with significant differences with respect to those obtained using other calibrations. For BD °740 the temperature is directly a mean value between 6180 and 6410 K from and colors, respectively. However, given that it is hotter than 6000 K we are considering its boron measurement as an upper limit and it is not relevant for the discussion in the next Section. The temperature adopted for HD 140283 is lower than other values usually quoted in the literature. Using e.g. K (Carney 1983; Alonso, Arribas, & Martínez-Roger 1996b), the LTE boron abundance for this star would rise by about 0.05 dex only.
4.4 NLTE Boron Abundances
Kiselman (1994) showed that the approximation of line formation in local thermodynamic equilibrium leads to significant errors in abundance determinations for solar-type metal-poor stars using B I lines. These lines are especially susceptible to NLTE effects because the overexcitation and overionization effects work in the same direction in making the lines weaker than if Boltzmann and Saha equilibria were valid. This is not the case for the Be II lines that are used for beryllium abundance analysis – here overionization and overexcitation work in opposite directions on the line strengths as was shown by García López et al. (1995) and Kiselman & Carlsson (1995). The NLTE behavior of lithium is more complicated, partly because the generally higher lithium abundances make the lithium atoms susceptible for various NLTE effects typical for strong lines. Carlsson et al. (1994) have published NLTE abundance corrections for an extensive grid of photospheric parameters, and Pavlenko et al. (1995) and Pavlenko & Magazzù (1996) provide NLTE curves of growth which extend to very low effective temperatures.
Kiselman & Carlsson (1996) provide NLTE corrections for LTE boron abundances computed using OSMARCS models. These should in principle not be applied to LTE abundances acquired with other models. The fact an LTE analysis of a line gives similar results for two different models is not in itself a guarantee that the NLTE analysis would. Line formation in NLTE involves coupling between different frequency regions and thus a more complicated dependence on the photospheric temperature and pressure structures and the background opacities than what is the case in LTE. The different treatment of UV opacities (see our discussion on stellar fluxes) makes it possible that consistent NLTE line modeling using the Kurucz models could give results differing from the OSMARCS results, even though the LTE abundances are so similar.
In order to be fully consistent, we choose as our final estimates of boron abundances our OSMARCS LTE results with the NLTE corrections of Kiselman & Carlsson applied. Correcting the LTE abundances obtained with Kurucz models using the Kiselman & Carlsson prescriptions would mean that the final abundances would be formally on the OSMARCS NLTE scale and slightly overestimated. The resulting abundances are given in Table 1. We will adopt for the NLTE abundances the same error bars derived in the LTE analysis. The sensitivity on uncertainties in stellar parameters is not significantly different in LTE and NLTE. The dependence on atomic data is much more difficult to asses (especially on ), and the sensitivity on other data is of second order. Furthermore, possible systematic errors are not easy to estimate. The errors in the stellar radiation fields are probably the most pertinent ones which bother the NLTE corrections, but we are considering that the continuous opacities employed in the OSMARCS models reproduce the observed fluxes.
5 Discussion
5.1 HD 84937 and BD +23°3130
HD 84937 was selected as a key target for this work because it is the only star for which there exist previous measurements of 6,7Li and 9Be. However, due to its high , our observations failed to provide a convincing detection of the B I 2496.772 Å line and consequently we were forced to set an upper limit to the boron abundance. This disappointment led us to reexamine published spectra of similarly warm extremely metal-poor stars and to conclude that upper limits to rather than certain determinations of the boron abundance may be reached. This result has some influence on determinations of the evolution of the boron abundance with metallicity.
In the case of BD °3130, a cool giant, a concern may be that boron has been depleted below its initial abundance. To investigate this concern, we compare its Li and Be abundances with those of some other stars in our sample. Equivalent widths of the Li I 6708 Å line were taken from Thorburn (1994) and Ryan et al. (1996), and the abundances were derived using the stellar parameters adopted in Table 1 and NLTE curves of growth provided by Ya. V. Pavlenko (obtained as described in Pavlenko et al. 1995 and Pavlenko & Magazzù 1996). Beryllium abundances were derived by García López et al. (1998). Li and Be abundances are listed in Table 2, where the latter include an upwards correction of 0.1 dex to consider the mean difference with the gravities derived by Nissen et al. (1997) from Hipparcos parallaxes (which does not affect either boron or lithium abundances).
Evidently but not surprisingly Li is depleted in BD °3130 by more than 0.7 dex. A part of the observed depletion may have occurred as a dilution when the star evolved to the giant phase. Boron and beryllium are less fragile elements than lithium, and it is unlikely that their abundances have been reduced by nuclear reactions. It cannot be completely ruled out that these abundances have been slightly reduced by dilution. It will be shown below that the Be and B abundances of the star fit the trends with metallicity defined by the other stars, and a small increment of the observed abundances of BD °3130 would not change the general conclusions about the synthesis of boron.
5.2 Evolution of Boron with Metallicity
Initial results on the evolution of the B abundance with metallicity ([Fe/H]) were provided by Duncan et al. (1992) from just three LTE B abundances of halo stars. The linear trend between log N(B) and [Fe/H] was confirmed in essence by Kiselman & Carlsson (1996) who included non-LTE effects for boron, and by Duncan et al. (1997a) who analyzed additional stars. Our rediscussion adds two stars and recognizes that only upper limits to the B abundance are presently obtainable for the warmest stars. In addition, we give B and Be abundances for stellar parameters derived in a uniform way for the entire sample.
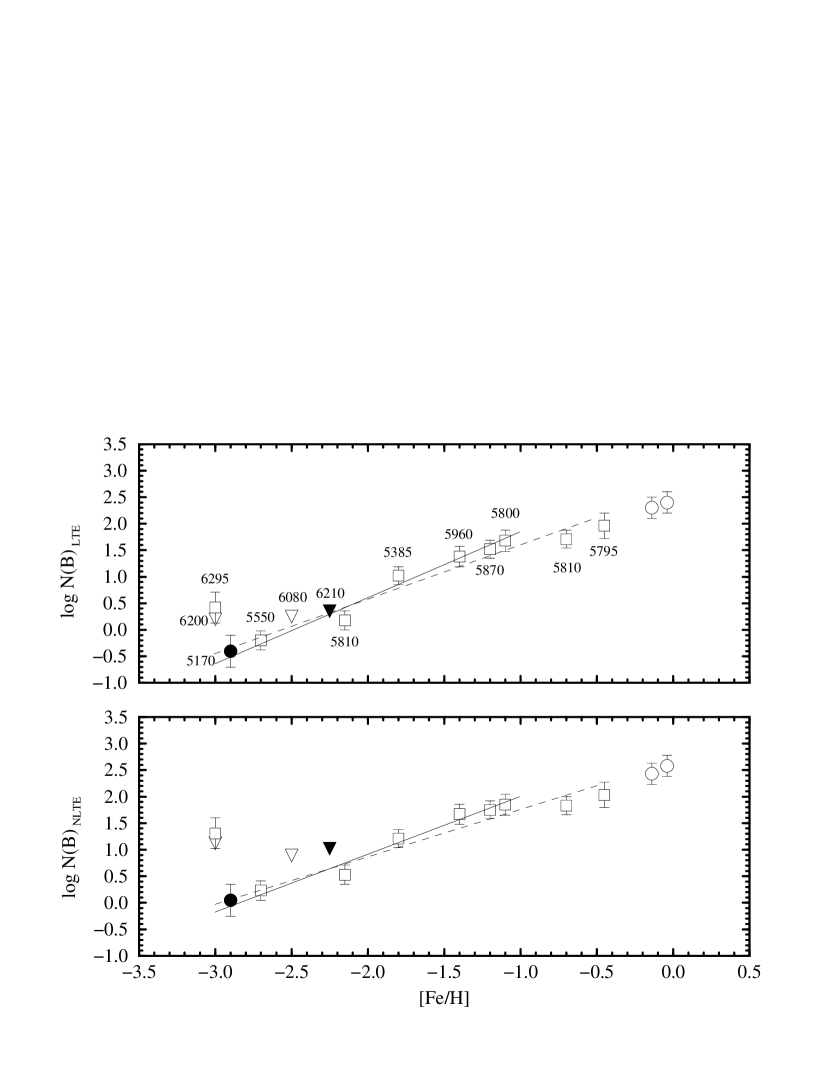
Figure 9 shows the LTE and NLTE boron abundances of those stars listed in Table 1 against [Fe/H]. In the upper panel the symbols are also labeled with the adopted effective temperatures. As explained in Section 4, we are only considering as real measurements those made in metal-poor stars with K. NLTE corrections also affect more strongly to the hotter stars, inducing a larger scatter in the boron-metallicity plot when including the abundances associated with the upper limits. For comparison, we have also included in Figure 9 the boron abundances of two solar-metallicity stars: Peg and UMa, taken directly from Lemke et al. (1993). NLTE effects on the B abundances were taken into account for these stars following Kiselman & Carlsson (1996).
Two sets of fits are shown in Figure 9. Dashed lines represent linear regressions performed using all metal-poor stars with K, and solid lines restrict the fits to cool stars with [Fe/H]. This distinction is done to compare with the behavior of beryllium abundances, for which a change of slope at [Fe/H] is apparent from the observations (García López et al. 1998). All regression analyses were carried out taking into account the error bars in boron abundances and metallicities, using the routine fitexy of Press et al. (1992) available in the IDL Astronomy User’s Library. These are the results:
-
•
LTE, K:
,
where is the number of stars included in the fit, is divided by the number of degrees of freedom (also called reduced ; in this case), and is the probability that a correct model would give a value equal or larger than the observed chi squared (a small value of indicates a poor fit; provides an acceptable fit).
-
•
LTE, K and [Fe/H]:
.
-
•
NLTE, K:
.
-
•
NLTE, K and [Fe/H]:
.
The plots make evident that a linear increase of the boron abundance with increasing metallicity describes very well the trend observed in the data, and a change of slope may occur at the halo-disk transition at [Fe/H] .
Duncan et al. (1997a) found slopes of and for their linear fits to 11 stars in LTE and NLTE, respectively. Our corresponding slopes of and , obtained using 9 stars (without upper limits) are consistent with those of Duncan et al. within the error bars. If we include the data associated with the metal-rich stars Peg and UMa, which have not been adjusted to our scale, the LTE and NLTE slopes do not change appreciably ( and , respectively). The slopes are slightly steeper and outside the error bars when compared with the results of Duncan et al., if we consider only those 7 stars with [Fe/H] . We will consider our NLTE abundances and the fit for stars with K and [Fe/H] as the actual values to be used in the discussion performed below this point.
In studies of boron evolution, oxygen abundances may be a preferable alternative to the iron abundances for astrophysical reasons. In particular, oxygen is synthesized primarily by the most massive supernovae whose ejecta (see below) may be the source of the energetic particles responsible for boron production by spallation. Unfortunately, observational determinations of oxygen abundances in metal-poor stars have been a matter of controversy during the last years (e.g. Abia & Rebolo 1989; Bessell, Sutherland, & Ruan 1991; Nissen et al. 1994; Cavallo, Pilachowski, & Rebolo 1997). We examined the boron-oxygen trend using the oxygen abundances found by Cavallo et al. (1997) from high-resolution spectra of the O I IR triplet in a sample of 24 stars with . These results were employed to define the relation between [O/H] and [Fe/H] which was then used to establish the B versus O trend. We find:
.
This slope is steeper than the comparable trend found by Duncan et al. (1997a), with a slope of 0.82 when using a mean [O/H] versus [Fe/H] relation established using abundances extracted from the literature for the stars in their sample. Almost in parallel with our analysis of boron, Israelian et al. (1998) are deriving oxygen abundances in a wide sample of metal-poor stars, including those considered here, using OH lines in the 3085–3256 Å region and the same stellar parameters employed in this paper. Until controversy about oxygen in metal-poor stars is clearly resolved, it must suffice to note that the boron and oxygen abundances are approximately linearly related.
5.3 Boron and Beryllium
Two modes of nucleosynthesis of boron compete (in theory) for primacy: spallation reactions driven by energetic (cosmic rays) particles in extra-stellar environments, and neutrino-induced spallation of 12C occurring in Type II supernovae. A measure of the relative contributions of the two modes is offered by the B/Be ratio (at a given [Fe/H]) because beryllium is synthesized (in theory) only by spallation reactions with high energy particles. Moreover, in these spallation reactions, the B/Be production ratio is essentially independent of the composition and the energy spectrum of the high energy particles. Thus, the observed B/Be ratio reveals the relative roles of the two modes of boron nucleosynthesis.
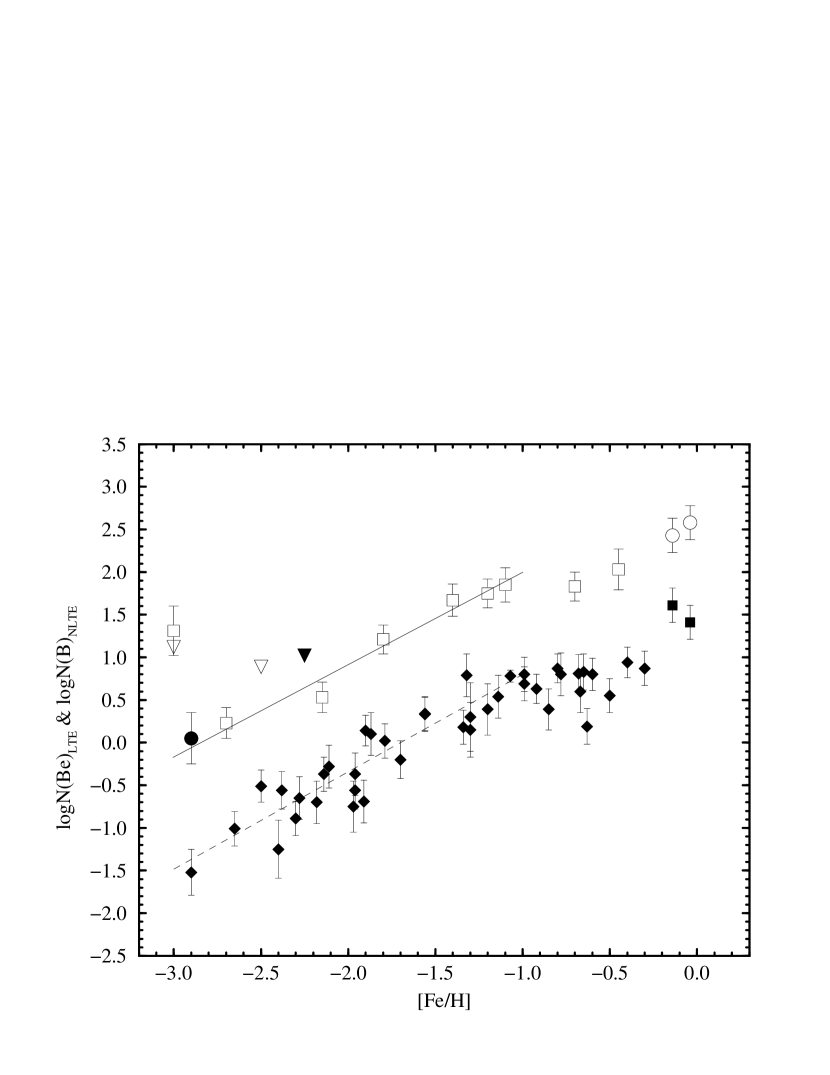
Figure 10 shows the comparison between boron (NLTE) and beryllium abundances against metallicity. Beryllium data were taken from García López et al. (1998), who carried out a detailed spectral synthesis of the Be II 3131 Å region for 28 stars with , using high-resolution observed spectra. These authors also included all metal-poor stars with accurate Be abundance available, and repeated measurements on the same star were averaged both in Be and in [Fe/H]. Also shown for comparison are the Be abundances given by Lemke et al. (1993) for the metal-rich stars Peg and UMa, estimated from Boesgaard’s (1976) equivalent widths measured on photographic spectra. A linear regression analysis for stars with [Fe/H] , without considering the upper limits (not shown in Fig. 10), provides:
.
These values of and indicate an excellent fit over a significant sample of metal-poor stars. These are LTE abundances but corrections for non-LTE effects are small ( dex in general –see García López et al. 1995 and Kiselman & Carlsson 1995–).
The slopes of the observed trends against metallicity are very similar for Be and B for stars with [Fe/H] . Indeed, the slopes are identical within the error bars. Duncan et al. (1997a) found a similar behavior when comparing their NLTE B abundances and published Be abundances for their sample of stars.
Using the Be abundances given by García López et al. (1998), derived with the stellar parameters listed in Table 1 and shown in Table 2, the average B/Be ratio for the seven stars with K and [Fe/H] is BNLTE/Be (1 ). For all of these stars, with the exception of BD °3130, independent beryllium measurements are available in the literature based on high-resolution CCD spectra, slightly different stellar parameters, and employing spectral synthesis or curves of growth. García López et al. (1995) showed that these independent LTE analyses provide very similar Be abundances when adjusted for differences in the stellar parameters (especially the surface gravity). The average Be abundances for these seven stars differ by dex from the individual values listed in Table 2. Using the average Be values we obtain a mean ratio BNLTE/Be . Figure 11 shows the behavior of log (BNLTE/Be) against metallicity. The solid line represents the mean value and dotted lines show the uncertainties: . All ratios are compatible with this mean value and its uncertainty within the error bars. A linear regression fit taking into account the errors in both coordinates provides:
,
which is fully consistent with the mean value and is shown as a dashed line in Figure 11. Duncan et al. (1997a) obtained a mean value BNLTE/Be using 9 stars. Be abundances adopted by Duncan et al. (1997a) are, in general, larger than those adopted here and that is the main reason why they obtain a smaller B/Be ratio.
It is worthwhile to consider the trends given by the regression analyses of boron and beryllium against metallicity, which better represent their overall behavior. Molaro et al. (1997) derived beryllium abundances for a sample of metal-poor stars and, combining them with measurements available in the literature, obtained a linear fit of Be abundance against metallicity with a slope of for 19 stars in the interval . This value is compatible with the slope found by García López et al. (1998) for 29 stars in the interval . Using this relation and the fit obtained in this work between log N(B)NLTE and [Fe/H] for stars with K and [Fe/H] , we find a mean ratio of BNLTE/Be . Using our boron relation and the beryllium fit provided by Molaro et al. (1997), this ratio is just 17.
5.4 Nucleosynthesis
Two observational facts about the B and Be abundances stand out: (i) metal-poor ([Fe/H]) stars have a constant boron-to-beryllium ratio , and (ii) the relation between boron (or beryllium) and metallicity has a slope of . The linear dependence, first seen for Be vs Fe by Gilmore et al. (1992) and then by Duncan et al. (1992) for B vs Fe, was a surprise. Simple models of spallation of ambient CNO nuclei in the interstellar medium by cosmic ray protons and s had predicted a quadratic dependence (B Fe2). Several explanations for the observed linear dependence have been advanced. In essence, most explanations invoke spallation of CNO nuclei in energetic collisions with ambient protons and s. If the composition of the energetic particles is greatly enriched in CNO, as could be assumed for supernovae ejecta or winds from Wolf-Rayet stars, a quasi-linear relation between B (and Be) and metallicity would result (Duncan et al. 1992; Vangioni- Flam et al. 1996). Other possibilities, such as local spallation by high-energy protons and s in enriched regions around supernovae, seem less probable (Feltzing & Gustafsson 1994). At any rate, fact (ii) is to be explained largely by astrophysical issues.
The simplest interpretation of fact (i) is that B and Be are made by the same nucleosynthetic process. This process is spallation of CNO nuclei by collisions with protons and s. Early calculations of yields from spallation gave a B/Be ratio near 20: Reeves (1994) gives the ratio as 17 for production by high energy ( 100 MeV nucleon-1) cosmic rays. The primary factors setting the ratio are the cross-sections for the spallation reactions, i.e., nuclear physics rather than astrophysics. Theoretical yields are thoroughly discussed by Ramaty et al. (1996) who investigate their dependence on the energy spectrum and composition of the energetic particles (cosmic rays), and on the composition of the ambient medium. This investigation shows that a ratio of B/Be from spallation does not constrain the composition of either the energetic particles or the ambient medium, and, provided the energy spectrum of the particles is not biased to threshold energies for the proton and on CNO nuclei spallation reactions, the ratio does not constrain the energy spectrum. Ramaty et al. stress that the various combinations of energy and composition of energetic particles and composition of the ambient medium call for different amounts of energy to be put into energetic particles: certain combinations are very inefficient. If the particles have the predicted composition of the (most massive) supernovae ejecta or Wolf-Rayet winds, Ramaty et al.’s condition on the energy available for high energy particles is met. The condition is very difficult to impossible to meet if the high energy particles have the composition of the Sun, the galactic cosmic rays or of the ejecta of low mass Type II supernovae. It is intriguing that this argument about the composition of the high energy particles is consistent with that adduced from the linear relation between B (and Be) and Fe. This constancy of Be/Fe and B/Fe for metal-poor stars led Ramaty et al. (1997) to relate the production rates of Be and B to the Fe production rate by Type II supernovae via cosmic-ray acceleration. Considering that the 11B/10B value in metal-poor stars is probably not lower than the solar system ratio of (Chaussidon & Robert 1995), a B/Be would imply an initial acceleration energy of about 60 MeV nucleon-1 (see Fig. 13 of Ramaty et al. 1997), and a rapid increase in the initial energy needed ( MeV nucleon-1) for slightly lower values (17–18) of B/Be.
Beryllium is thought to be synthesized only by spallation reactions but boron synthesis by spallation may be supplemented by Type II supernovae in which boron is made by neutrino-induced spallation of carbon (the -process). Timmes, Woosley, & Weaver (1996) in a detailed study of galactic chemical evolution suggest that predicted yields of boron by supernovae reproduce well the B versus Fe trend of the halo and disk without the introduction of spallation processes. This is incompatible with the attribution of Be synthesis to spallation processes and the observed ratio B/Be which implies that boron synthesis is also by spallation processes. We conclude that yields of boron from the -process have been overestimated. Vangioni-Flam et al. (1996), on the basis of few published B abundances, concluded that the -process is at least a factor of 5 less efficient than supposed by Timmes et al. (1995).
Alternative models of chemical evolution of the Galactic halo (e.g., Casuso & Beckman 1997) also give consistent results with the observed linear trends of B and Be vs. Fe at very low metallicity. These authors consider an exponentially increasing flow of gas from the halo to form the bulge. The strong Be and B enrichment in the halo is attributed to the presence of more star-forming gas at very low metallicity, and to increased yields of carbon in intermediate and low-mass metal-poor stars. The Be/B ratios that they predict are also similar to the observed ones. It seems that under certain hypothesis for the evolution of the gas and for the Initial Mass Function, conventional cosmic ray spallation processes may then provide an explanation to the observations.
In short, the ratio B/Be is strong evidence that B and Be are products of spallation reactions between protons and/or s and CNO nuclei.
The beryllium abundances (Figure 10) indicate that there is a change of slope in the run of Be with Fe at about [Fe/H] , the canonical transition between halo and disk (a more detailed discussion based on the Be data is presented in García López et al. 1998). The very limited data on the boron abundance in disk stars suggests that the B versus Fe trend follows the Be versus Fe trend such that B/Be remains constant at . Additional data for boron at these metallicities is crucial to confirm this and for a better understanding of the halo-disk transition. The meteoritic abundances (Grevesse, Noels, & Sauval 1996) give B/Be in agreement with our result from metal-poor stars.
6 Conclusions
BD 3130 observed and analyzed here is the most metal-poor star for which a firm measurement of the boron abundance presently exists (two slightly more metal-poor stars – BD and BD 740 – have been analyzed but we consider that the B I 2497 Å line has not been positively identified in published spectra.) Our result and slightly revised results from other metal-poor stars establish the run of boron with iron for halo stars: the boron abundance increases linearly, with a slope , with the iron abundance. With beryllium abundances consistently derived for the same stars using the same atmosphere parameters, the B/Be ratio is found to be .
A direct interpretation of these results is that B and Be in the halo were synthesized by spallation reactions between ambient protons and s and high energy particles with a composition enriched in CNO. The B/Be ratio is in fine agreement with the predictions (Vangioni-Flam et al. 1996; Ramaty et al. 1996, 1997). This is a significant result because the predicted B/Be ratio is largely independent of the details of the modeling of the spallation process being largely determined by laboratory measurements of spallation cross-sections. The linear trend of B (and Be) with Fe is dependent on the astrophysics of spallation in the halo but can be reproduced with plausible assumptions (Vangioni-Flam et al. 1996).
A consistent picture of boron synthesis has emerged for the halo of our Galaxy. Stars more metal-poor than BD 3130 are now known but it will not be easy to extend measurements of boron abundance to these stars. The B I 2497 Å line will be too weak in the warmest of these stars, as we have found for less extreme stars. Some extension to lower metallicity will be possible for cool stars but for the fact that the candidate stars are faint requiring prohibitively long exposures with HST. Almost certainly, the boron plateau signifying detection of primordial boron will elude us; boron (and beryllium) from homogeneous and inhomogeneous big bangs is predicted to have an abundance 7 or 8 dex below the abundance found here for BD 3130 (Thomas et al. 1993, 1994).
References
- (1)
- (2) Abia, C., & Rebolo, R. 1989, ApJ, 347, 186
- (3)
- (4) Alonso, A., Arribas, S., & Martínez-Roger, C. 1996a, A&A, 313, 873
- (5)
- (6) Alonso, A., Arribas, S., & Martínez-Roger, C. 1996b, A&AS, 117, 227
- (7)
- (8) Bessell, M. S., Sutherland, R. S., & Ruan, K. 1991, ApJ, L71
- (9)
- (10) Blackwell, D. E., Petford, A. D., Arribas, S., Haddock, D. J., & Selby, M. J. 1990, A&A, 232, 396
- (11)
- (12) Boesgaard, A. M. 1976, ApJ, 210, 466
- (13)
- (14) Boesgaard, A. M., & Heacox, W. D. 1978, ApJ, 226, 888
- (15)
- (16) Carlsson. M., Rutten, R. J., Bruls, J. H. M. J., & Shchukina, N. G. 1994, A&A, 288, 860
- (17)
- (18) Carney, B. W. 1983, AJ, 88, 623
- (19)
- (20) Carney, B. W., Latham, D. W., Laird, J. B, & Aguilar, L. A. 1994, AJ, 107, 2240
- (21)
- (22) Casuso, E., & Beckman, J. E. 1997, ApJ, 475, 155
- (23)
- (24) Cavallo, R. M., Pilachowski, C. A., & Rebolo, R. 1997, PASP, 109, 226
- (25)
- (26) Chaussidon, M., & Robert, F. 1995, Nature, 374, 337
- (27)
- (28) Duncan, D. K., Lambert, D. L., & Lemke, M. 1992, ApJ, 401, 584
- (29)
- (30) Duncan D. K., Peterson, R. C., Thorburn, J. A., Pinsonneault, M. H., & Deliyannis, C. P. 1997b, ApJ (in press)
- (31)
- (32) Duncan, D. K., Primas, F., Rebull, L. M., Boesgaard, A. M., Deliyannis, C. P., Hobbs, L. M., King, J. R., & Ryan, S. G. 1997a, ApJ, 488, 338
- (33)
- (34) Duncan, D. K., Rebull, L. M., Primas, F., Boesgaard, A. M., Deliyannis, C. P., Hobbs, L. M., King, J. R., & Ryan, S. G. 1998, A&A (in press)
- (35)
- (36) Edvardsson, B., Andersen, J., Gustafsson, B., Lambert, D. L., Nissen, P. E., & Tomkin, J. 1993, A&A, 275, 101
- (37)
- (38) Edvardsson, B. Gustafsson, B., Johansson, S. G., Kiselman, D., Lambert, D. L., Nissen, P. E., & Gilmore, G. 1994, A&A, 290, 176
- (39)
- (40) Feltzing, S., & Gustafsson, B. 1994, ApJ, 423, 68
- (41)
- (42) García López, R. J., Rebolo, R., Pérez de Taoro, M. R., & Alonso, A. 1998, A&A (in preparation)
- (43)
- (44) García López, R. J., Severino, G., & Gomez, M. T. 1995, A&A, 297, 787
- (45)
- (46) Gilmore, G., Gustafsson, B., Edvardsson, B.,& Nissen, P. E. 1992, Nature, 357, 392
- (47)
- (48) Gratton, R., Caretta, E., & Castelli, F. 1996, A&A, 314, 191
- (49)
- (50) Grevesse, N., Noels, A., & Sauval, A. J. 1996, ASP Conf. Ser., 99, 117
- (51)
- (52) Gustafsson, B., Bell, R. A., Eriksson, K., & Nordlund, Å 1975, A&A, 42, 407
- (53)
- (54) Hobbs, L. M., & Thorburn, J. A. 1994, ApJ, 428, L25
- (55)
- (56) Hobbs, L. M., & Thorburn, J. A. 1997, ApJ (in press)
- (57)
- (58) Israelian, G., García López, R. J., & Rebolo, R. 1998, ApJ (in preparation)
- (59)
- (60) Jedamzik, K., Fuller, G. M., Matheus, G. J., & Kajino, T. 1994, ApJ, 422, 423
- (61)
- (62) Johansson, S. G. 1992, private communication
- (63)
- (64) Johansson, S. G., & Cowley 1988, J. Opt. Soc. Am. B, 5, 2264
- (65)
- (66) Johansson, S. G., Litzén, U., Kasten, J., & Kock, M. 1993, ApJ, 403, L25
- (67)
- (68) Kajino, T., & Boyd, R. N. 1990, ApJ, 359, 267
- (69)
- (70) Kiselman, D. 1994, A&A, 286, 159
- (71)
- (72) Kiselman, D., & Carlsson, M. 1995, in The Light Element Abundances, ed. P. Crane (Springer), 372
- (73)
- (74) Kiselman, D., & Carlsson, M. 1996, A&A, 311, 680
- (75)
- (76) Kurucz, R. L. 1992, private communication
- (77)
- (78) Kurucz, R. L. 1993, CD-ROM # 1
- (79)
- (80) Laird, J. B., Carney, B., & Latham, D. W. 1988, AJ, 95, 1843
- (81)
- (82) Lemke, M., Lambert, D. L., & Edvardsson, B. 1993, PASP, 105, 468
- (83)
- (84) Malaney, R. A., & Fowler, W. A. 1989, ApJ, 345, L5
- (85)
- (86) Molaro, P. 1987, A&A, 183, 241
- (87)
- (88) Molaro, P., Bonifacio, P., Castelli, F., & Pasquini, L. 1997, A&A, 319, 593
- (89)
- (90) Nissen, P. E., Gustafsson, b., Edvardsson, b., & Gilmore, G. 1994, A&A, 285, 400
- (91)
- (92) Nissen, P. E., Hg, E., & Schuster, W. J. 1997, proceedings of the “Hipparcos Venice’97 Symposium”, ESA SP-402 (in press)
- (93)
- (94) O’Brian, T. R., & Lawler, J. E. 1992, A&A, 255, 420
- (95)
- (96) O’Brian, T. R., Wickliffe, M. E., Lawler, J. G., Whaling, W., Brault, J. W. 1991, J. Opt. Soc. Am. B8, 1185
- (97)
- (98) Pavlenko, Ya. V. 1991, SvA, 35, 212
- (99)
- (100) Pavlenko, Ya. V., & Magazzù, A. 1996, A&A, 311, 961
- (101)
- (102) Pavlenko, Ya. V., Rebolo, R., Martín, E. L., & García López, R. J. 1995, A&A, 303, 807
- (103)
- (104) Press, W. H., Teukolsky, A. A., Vetterling, W. T., & Flannery, B. P. 1992, Numerical Recipes, 2nd. ed., Cambridge University Press, Cambridge
- (105)
- (106) Ramaty, R., Kozlovsky, B., & Lingenfelter, R. E. 1996, ApJ, 456, 525
- (107)
- (108) Ramaty, R., Kozlovsky, B., Lingenfelter, R. E., & Reeves, H. 1997, ApJ, 488, 730
- (109)
- (110) Rebull, L. M., Duncan, D. K., Boesgaard, A. M., Deliyannis, C. P., Hobbs, L. M., King, J. R., & Ryan, S. G. 1996, ASP Conf. Ser. 99, 184
- (111)
- (112) Reeves, H. 1994, Rev. Mod. Phys. 66, 193
- (113)
- (114) Reeves, H., Richer, J., Terasawa, N., & Sato, K. 1990, ApJ, 355, 18
- (115)
- (116) Ryan, S. G., Beers, T. C., Deliyannis, C. P., & Thorburn, J. A. 1996, ApJ, 458, 543
- (117)
- (118) Smith, V., Lambert, D. L., & Nissen, P. E. 1993, ApJ, 408, 262
- (119)
- (120) Stryker, L. L., Hesser, J. E., Hill, G., Garlick, G. S., & O’Keefe, L. M. 1985, PASP, 97, 247
- (121)
- (122) Terasawa, N., & Sato, K. 1990, ApJ, 362, L47
- (123)
- (124) Thomas, D., Schramm, D. N., Olive, K. A., & Fields, B. D. 1993, ApJ, 406, 569
- (125)
- (126) Thomas, D., Schramm, D. N., Olive, K. A., Mathews, G. J., Meyer, B. S., & Fields, B. D. 1994, ApJ, 430, 291
- (127)
- (128) Thorburn, J. A. 1994, ApJ, 421, 318
- (129)
- (130) Timmes, F. X., Woosley, S. E., & Weaver, T. A. 1995, ApJS, 98, 617
- (131)
- (132) Vangioni-Flam, E., Cassé, M., Fields, B. D., & Olive, K. A. 1996, ApJ, 468, 199
- (133)


| Star | [Fe/H] | log N(B) | log N(B) | log N(B) | Ref. | ||
|---|---|---|---|---|---|---|---|
| LTE | LTE | NLTE | |||||
| KURUCZ | OSMARCS | OSMARCS | |||||
| BD °3130 | 5170150 | 2.500.30 | 0.05 | 1,a | |||
| HD 84937 | 6210120 | 4.000.10 | 1,a | ||||
| BD °3442 | 6200150 | 3.500.20 | 2,a | ||||
| BD °3578 | 6080120 | 3.850.10 | 3,a | ||||
| HD 142373 | 5795100 | 4.300.10 | 1.96 | 2.03 | 3,b | ||
| HD 184499 | 5810100 | 4.000.10 | 1.71 | 1.83 | 3,b | ||
| HD 76932 | 5800100 | 3.850.10 | 1.68 | 1.85 | 3,b | ||
| HD 201891 | 5870100 | 4.000.10 | 1.52 | 1.75 | 4,b | ||
| HD 194598 | 5960120 | 4.150.10 | 1.38 | 1.67 | 3,b | ||
| HD 64090 | 5385100 | 4.450.10 | 1.02 | 1.21 | 3,b | ||
| HD 19445 | 5810150 | 4.300.10 | 0.18 | 0.53 | 4,b | ||
| HD 140283 | 5550100 | 3.350.10 | 0.23 | 4,b | |||
| BD °740 | 6295120 | 4.000.10 | 0.42 | 1.31 | 3,b |
References. — 1, this work; 2, star observed by Rebull et al. (1996); 3, by Duncan et al. (1997a); 4, by Duncan, Lambert, & Lemke (1992).
References. — a, LTE boron abundance derived by spectral synthesis; b, using estimated equivalent widths.
| Star | [Fe/H] | log N(Be) | log N(Li) |
|---|---|---|---|
| (LTE) | (NLTE) | ||
| HD 76932 | |||
| HD 201891 | |||
| HD 194598 | |||
| HD 64090 | |||
| HD 19445 | |||
| HD 140283 | |||
| BD °3130 |