Dynamical Mass Determination for Elliptical Galaxies
Abstract
The mass and anisotropy of an elliptical galaxy can be simultaneously determined from velocity dispersion and line profile shape measurements. We describe the principles, techniques, and limitations of this approach, and the results obtained sofar. We briefly discuss how best to combine these stellar-dynamical results with X-ray measurements and gravitational lensing analyses.
Astronomisches Institut, Universität Basel, Venusstrasse 7, CH-4102 Binningen, Switzerland
Universitäts–Sternwarte, Scheinerstr. 1, D-81679 München, Germany
1. Introduction
To place elliptical galaxies in the context of galaxy formation theories, it is vital to understand their mass distributions and dynamical structure. Yet despite nearly two decades of work we are only beginning to answer important questions such as:
What are the density distribution, the flattening, the extent of elliptical galaxy halos? Are these similar as for the halos of spiral galaxies, for the same stellar mass?
To what extent has the luminous matter in ellipticals dissipatively segregated in the dark matter potential? Is there a “conspiracy” between luminous and dark matter to produce a flat circular orbit rotation curve, like in spiral galaxies?
How anisotropic, radially or tangentially, are the velocity ellipsoids?
How do the derived halo properties and dynamical structure compare with those obtained from numerical simulations of the merger of two spiral galaxies? Can the results be used to constrain the rôle of the baryons in hierarchical merging?
Progress in this field has been beset by well–known difficulties: There is no single ideal tracer like a spiral galaxy’s rotation curve, and the interpretation of velocity dispersion data is ambigous, suffering from a fundamental degeneracy between anisotropy and mass. However, recent advances on several fronts give reason for optimism:
From absorption line profile data it is now possible to determine both the mass distribution and anisotropy out to, at present, half–light radii . How this can be done, and what the results are to date, is the subject of this article. The method works, in principle, for all nearby ellipticals.
The improved spatial and spectral resolution of ROSAT and ASCA has allowed accurate mass determinations to large radii for several massive ellipticals (Mushotzky et al. 1994, Kim & Fabbiano 1995). Resolution limits the analysis to . The number of X–ray bright ellipticals analysed in this way is still relatively small.
Galaxy–galaxy (strong) lensing gives accurate surface mass measurements at a specific radius defined by the lensed images (e.g., Kochanek & Keeton 1997). Galaxy–galaxy weak lensing (Brainerd, Blandford & Smail 1996) will in future allow a statistical determination of outer surface mass profiles for galaxies at typical redshift of a few tenths.
Both X–ray and gravitational lensing mass measurements will be described elsewhere in these proceedings. In this article we explain the stellar dynamical principles of how line profile data can break the traditional degeneracy (Section 2). We show that the analysis of real data does indeed work (Section 3), and then describe the results obtained sofar (Section 4). It is important to note that combining results from several approaches will be very useful; thus we briefly comment on how the new dynamical determinations fit in with the results from other techniques (Section 5).
2. Mass and anisotropy from line profile data: Principles
Illustrative line–of–sight velocity profiles (vps) for isotropic, radially, and tangentially anisotropic distribution functions in fixed potentials are given, e.g, in Dejonghe (1987), Merritt (1987) and Gerhard (1991) for spherical systems, and in Dehnen & Gerhard (1993, 1994), Evans (1993), and Qian et al. (1995) for axisymmetric systems. The signature of radial orbits is a broad central profile, and a peaked profile with extended wings beyond the half–mass radius, where the profile is dominated by orbits near tangent point, the point along the line–of–sight closest to the galaxy center. Tangential orbits tend to generate narrow profiles in the center and broad, sometimes double–peaked profiles at large radii. In axisymmetric potentials, rotation introduces a noticeable asymmetry with respect to the vp center, and the minor and major axis anisotropies can be decoupled.
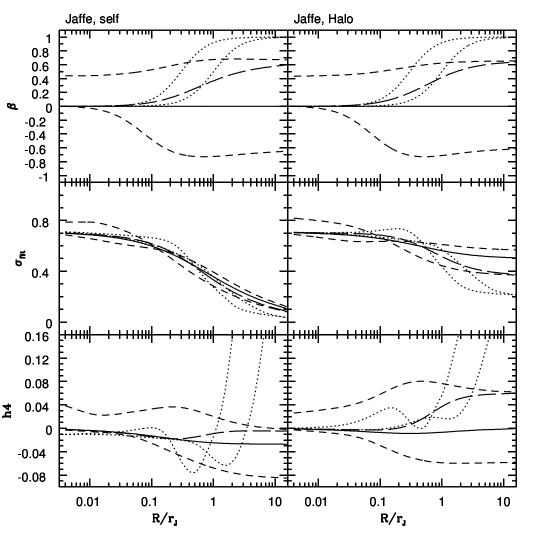
While the anisotropy of an elliptical galaxy is thus clearly constrained by vp shape measurements, it can not be directly inferred because the vps also depend on the gravitational potential (Gerhard 1993). An updated illustration for spherical Jaffe models of various anisotropy structure is given in Fig. 1. The vp shapes are conveniently represented by Gauss–Hermite moments (Gerhard 1993, van der Marel & Franx 1993). In the spherical case the vp is symmetric, and is parametrized in Fig. 1 by the fitted profile width and lowest order even coefficient (van der Marel & Franx 1993). Fig. 1 shows a general trend: As the mass of the model at large is increased at constant anisotropy, both the projected dispersion and increase. Increasing at constant potential, on the other hand, lowers and increases . This suggests that by modelling and both mass and anisotropy can in principle be found.
Locally, this trend may be reversed, as shown by the two Osipkov-Merritt-models in Fig. 1; in this case a large number of high-energy radial orbits all turning around near radius lead to flat-topped vps in a small radial range near . Although the properties of these models are extreme and they have not been very useful sofar for modelling observed vps, this nonetheless suggests that a global non-parametric analysis of the data is required.
3. Analysis of observed line–profile data
In recent studies, analyzing simulated and real line-profile data has proceeded in two distinct steps (Merritt 1993, Rix et al. 1997, Gerhard et al. 1997): First, the gravitational potential is held fixed, and in this current potential a best–estimate df is determined from the data. Then, this process is repeated for different potentials, and confidence intervals are found for the parameters entering the functional form of .
In the first step, the df is written as a sum of elements (which can be values in grid cells, orbits, or basis functions). These elements are projected into observational space, and their weights are adjusted to fit the data. The equation relating the df to the projected df (over line-of-sight velocities and sky positions) is linear, so this is relatively straightforward. Also, at least in the spherical case we know that the solution is unique for ideal data (Dejonghe & Merritt 1992). The same is likely to be true for edge-on axisymmetric systems, as long as only one orbit family is involved. Because real data provide only a sparse and noisy subset of the projected df, only gross features of the phase-space df can be extracted, and significant smoothing is necessary. This is done by the concept of regularisation (see Merritt 1993). For each set of data an optimal regularisation parameter must be determined.
Fig. 3 shows the application of such a technique to Monte Carlo data, which is obtained from a model df in a known potential, but using the sampling and radial extent of real data for the E0 galaxy NGC 6703 (Gerhard et al. 1997).


The assumed sizes of the error bars in this example are for the velocity dispersion , and for the vp shape parameter . The elements used in this particular technique are various isotropic and tangentially anisotropic basis functions constructed along the lines described by Gerhard (1991). Fig. 3 shows that the true df can be recovered well from such data, and Fig. 3 shows quantitatively the cumulative distribution of per data point for random Monte Carlo realizations. In this example, the algorithm will match the data with with confidence, and recover an underlying smooth df to within an rms of .
The second step, that of constraining the potential, is harder because enters non-linearly into the equation for the projected df. Moreover, experiments suggest that the potential is in practice determined only nearly uniquely (Gerhard et al. 1997). In other words, there is likely a finite region in –space within which for each there exists a positive df that matches even exquisite kinematic data. It is not practical at present to optimize the gravitational potential non-parametrically. Thus in work sofar a functional form with one or two parameters has been assumed, and confidence limits were obtained for the values of these parameters. See Section 4 for an example. Then one must, of course, assess whether the results are dependent on the chosen parametrization.
4. Results sofar: The E0 galaxy NGC 6703, and others
In this Section we discuss the results obtained sofar. We will concentrate on the case of NGC 6703 which we have analyzed (Gerhard et al. 1997), but mention briefly the results obtained for NGC 2434 by Rix et al. (1997). Both galaxies are E0, so presumably nearly spherical, which simplifies the analysis.
The kinematic data for NGC 6703 were obtained during three observing runs at the Calar Alto 3.5-m telescope with a Boller & Chivens longslit twin spectrograph, during a total of 18.5 hrs of observations. A major axis spectrum and two spectra perpendicular to the major axis and shifted by 24” and 36” from the center were taken. The instrumental resolution was . The data were reduced as described by Bender (1990) and Bender, Saglia & Gerhard (1994); extensive Monte Carlo simulations were used to test the effects of continuum fitting and instrumental resolution, and to determine the error bars. The data for and are shown in Fig. 6 below.
Dynamical models were fit to these data along the lines described in the previous section. For the luminous component we used a Jaffe model which fits the surface brightness data to mag and the cumulative mass profile to . Models in which this luminous component has constant M/L and contains all the mass in NGC 6703, fail to fit the data by a large margin in (Fig. 5). Either the velocity dispersion profile is fit approximately, but then the line profiles cannot be reproduced, or the profile is fitted well, but then is poorly matched. The non-parametric algorithm finds a bad compromise which is ruled out at high statistical significance.
Models with dark matter were investigated using a two-parameter family of dark halo potentials and rotation curves:
| (1) |


These halo mass models have a constant density core, and the parameters are chosen such that the halo matters only at large radii. This is similar to the maximum disk hypothesis in spiral galaxies. We therefore call these luminous plus dark matter models maximum stellar mass models; we show a sequence of such models in Fig. 5.
Dynamical models for NGC 6703 were derived from the data in a variety of these maximum stellar mass potentials, including those shown in Fig. 5. Because the dispersion profile is falling, only one of the two halo parameters can be determined. We have found that a well–constrained parameter is the circular orbit velocity at the radius of the last kinematic data point, . Fig. 5 shows the results. A self–consistent potential is clearly inconsistent with the data, while a model with a completely flat rotation curve is marginally consistent with the data at . All models that are not ruled out at confidence (according to Fig. 3) have at . This corresponds to a total mass in NGC 6703 inside (, where ) of , and to an integrated B-band mass–to–light ratio out to this radius of , rising from the central by at least a factor of .
Fig. 6 shows the predicted kinematics from several models together with the data, and the implied anisotropy profiles. The anisotropy of the stellar distribution function in NGC 6703 thus changes from near-isotropic at the centre to slightly radially anisotropic ( at 30”, at 60”). It is not well-constrained at the outer edge of the data, where , depending on variations of the potential in the allowed range. Notice that large anisotropy gradients between 40” and 70” and across the outer data boundary are implied if the rotation curve of NGC 6703 were completely flat. The model with is thus not a very plausible one for this galaxy.

Rix et al. (1997) have analyzed the velocity profiles of the E0 galaxy NGC 2434 with a linear orbit superposition method. This galaxy provides an interesting contrast to NGC 6703 because it has an essentially flat dispersion profile. Its kinematics are likewise inconsistent with a constant–M/L potential, but are well–fit by a model with . This can be interpreted as a maximum stellar mass model in the sense defined above, in which the luminous component with maximal contributes most of the mass inside . In this case, . The kinematics of NGC 2434 are also well–fit by a range of specific, cosmologically motivated mass models (Navarro, Frenk & White 1997) which, if applicable, would imply lower , down to 4.3, and significant dark mass inside .
It is clear that the dynamical analysis determines only the distribution of total mass, but cannot fix the mass–to–light ratio of the stellar component separately. To do this, we must, like in spiral galaxies, use extra constraints such as from population analysis. The fact that the central mass–to–light ratio in NGC 6703 comes out low () even in a maximum stellar mass model may mean that the contribution of the halo to the mass within cannot be very large. This needs to be studied in more detail; if true it would give an interesting constraint on galaxy formation theories.
5. Conclusions and Discussion
The principal result of the work described here is that both the anisotropy and the mass distribution of an elliptical galaxy out to can be derived from velocity dispersion and line profile shape measurements. The two ellipticals analyzed so far do have dark halos, the resulting circular rotation velocity curves are nearly flat, and the mass–to–light ratios of the stellar populations have come out low. In NGC 6703 there are indications for deviations from a flat rotation curve in the sense expected if the luminous matter has segregated to the center; these need to be confirmed with more accurate observations. Future studies must show whether there are differences between the shapes of the true circular velocity curves of elliptical galaxies.
The strength of the dynamical analysis of elliptical halos is that it simultaneously yields the stellar-dynamical anisotropy structure, a further strong constraint on formation theories. Moreover, since the dynamical analysis works best at high surface brightness, it is best–suited for constraining small halo core radii. The drawback of the dynamical analysis is that it can hardly be pushed further than to about , and that there are problems in deprojecting non-spherical systems (Gerhard and Binney 1996). These can, however, be eased by concentrating on the flattest elliptical galaxies. For the E0 galaxy NGC 6703, current data determine the true circular velocity at the radius of the last kinematic data point to about at confidence, within the framework of spherical models. The largest part of the quoted uncertainty is due to the finite radial extent of the data.
X-ray observations have the advantage that they can yield the mass distribution out to very large radii. Only few systems have been studied sofar, however, some of which are cluster brightest galaxies. A typical resolution limit is . Gravitational lensing observations can either give an accurate determination of the mass within an Einstein radius (in the case of strong lensing), or a statistical determination of the outer mass profiles of distant ellipticals (in the case of weak lensing). Lensing observations only test projected masses, but they have the advantage that dynamical equilibrium need not be assumed.
We will therefore learn most about ellipticals by combining the different techniques, emphasizing their strengths and minimizing the uncertainties, and covering as large a radial range as possible. For example, if the gravitational potential of an elliptical galaxy at several is known from X–ray data, this will substantially reduce the error in the dynamically derived outer anisotropy. Stellar dynamical models derived from absorption line kinematics can be combined with discrete velocity samples at larger radii, such as from planetary nebulae searches (Arnaboldi & Freeman 1997), and stellar dynamical mass–to–light ratios are required for normalisation in gravitational lensing studies (Kochanek & Keeton 1997).
The fact that also ellipticals have dark halos has been clear from X-ray and other observations and is not too surprising. However, the detailed study of their dark matter halos is of particular interest, since at least cluster ellipticals are now believed to be very old (see Bender et al. 1998 and references therein) and must have formed when the mean density of the Universe was still high. It will also be interesting to see whether the uniformity of ellipticals in the fundamental plane extends to their detailed dynamical properties, and whether this is caused by dynamical processes (Merritt 1997) or reflects the details of the hierarchical formation process.
Acknowledgments.
We acknowledge financial support by the Schweizerischer Nationalfonds under grants 21-40464.94 and 20-43218.95, and by the Deutsche Forschungsgemeinschaft under SFB 375.
References
Arnaboldi, M., Freeman, K.C. 1997, in The Nature of Elliptical Galaxies, Stromlo Symposium, eds. Arnaboldi M., Da Costa G.S., Saha P., A.S.P. 116, 54
Bender, R. 1990, A&A, 229, 441
Bender, R., Saglia, R.P., Gerhard, O.E. 1994, MNRAS, 269, 785
Bender, R., Saglia, R.P., Ziegler, B., Belloni, P., Greggio, L., Hopp, U. 1998, ApJ, 493, in press
Brainerd, T.G., Blandford, R.D., Smail, I. 1996, ApJ, 466, 623
Dejonghe, H. 1987, MNRAS, 224, 13
Dejonghe, H., Merritt, D. 1992, ApJ, 391, 531
Dehnen, W., Gerhard, O.E. 1993, MNRAS, 261, 311
Dehnen, W., Gerhard, O.E. 1994, MNRAS, 268, 1019
Evans, N.W. 1993, MNRAS, 260, 191
Gerhard, O.E. 1991, MNRAS, 250, 812
Gerhard, O.E. 1993, MNRAS, 265, 213
Gerhard, O.E., Binney, J. 1996, MNRAS, 279, 993
Gerhard, O.E., Jeske, G., Saglia, R.P., Bender, R. 1997, MNRAS, , in press
Kim, D.-W., Fabbiano, G. 1995, ApJ, 441, 182
Kochanek, C.S., Keeton, C.R. 1997, in The Nature of Elliptical Galaxies, Stromlo Symposium, eds. Arnaboldi M., Da Costa G.S., Saha P., A.S.P. 116, 21
Merritt, D. 1985, AJ, 90, 1027
Merritt, D. 1987, ApJ, 313, 121
Merritt, D. 1993, ApJ, 413, 79
Merritt, D. 1997, ApJ, 486, 102
Mushotzky, R.F., Loewenstein, M., Awaki, H., Makishima, K., Matsushita, K., Matsumoto, H. 1994, ApJL, 436, 79
Navarro, J.F., Frenk, C.S., White, S.D.M. 1997, ApJ, 490, 493
Osipkov, L.P. 1979, Pis’ma Astr. Zh. 5, 77
Qian, E.E., de Zeeuw, T., van der Marel, R.P., Hunter, C. 1995, MNRAS, 274, 602
Rix, H-W., de Zeeuw, P.T., Carollo, M., Cretton, N., van der Marel R. 1997, ApJ, 488, 702
van der Marel, R.P., Franx, M. 1993, ApJ, 407, 525