A HST Spectroscopic study of QSOs with intermediate redshift damped Ly systems††thanks: Based on observations made with the NASA/ESA Hubble Space Telescope, obtained at the Space Telescope Science Institute, which is operated by the Association of Universities for Research in Astronomy, Inc., under NASA contract NAS 5-26555
Abstract
We present HST spectra for a sample of six QSOs with intermediate redshift () damped Ly systems. These observations aim at measuring the H i column density and detect metal lines in order to investigate the metal enrichment of the gas, as well as the presence of neutral species, molecules and dust.
All systems selected on the basis of 21 cm absorption and/or strong Fe ii lines relative to Mg ii ones turn out to have larger than cm-2. From our detection of weak lines from minor metals and already published optical data, we determine relative abundances of Si, Mn, Fe, Ni, Zn. In PKS 1229021, we measure [Zn/H] at while in two other cases with intervening spiral galaxies and for which only [Fe/H] and [Mn/H] could be estimated, the metallicity could be close to solar. Thus, it appears that although the scatter of metallicities is large at as at high redshift, an increasing proportion of systems with metallicities 30% solar are found when going at lower redshifts.
C i lines are tentatively detected in two systems. Given the low metallicity, the observed C i/H i ratio suggests that physical conditions in the absorbers are comparable to those in our Galaxy. In PKS 1229021, the 21 cm absorption data combined with the new Ly observations, imply a low temperature, K, for the absorbing gas. For the three systems in which they could be searched for, H2 molecules are not detected with an upper limit of about cm-2 on . No evidence is found for Galactic-type dust, except possibly in the 3C 286 system.
Our results suggest that available observations may be biased against dust-rich absorbers. Further, when all available measurements of and [Zn/H] are considered, a clear deficiency of systems with large and high metallicity is apparent. We conclude that dust extinction causes a preferential selection of QSOs with intervening gas relatively poor in metals, dust and molecules. As a consequence, the high end of the H i column density distribution (and hence , the contribution of neutral gas to the cosmological mass density) is probably more heavily underestimated than previously thought, especially at low redshift. Such a bias could also explain the high incidence of non-spiral morphologies in our sample.
We stress that observation of a larger sample of low damped Ly systems as well as surveys of damped Ly systems in fainter QSOs would give a more representative view of the true diversity of absorber properties and should help to probe the denser phases of the interstellar medium in distant galaxies.
Our program also provides a few new results on other (likely non-damped) metal systems. In PKS 0454+039, we detect for the first time Mg ii absorption from a dwarf galaxy halo at . Strong Mg ii and Fe ii absorption is also found in EX 0302223 from a spiral galaxy at .
Key Words.:
quasar: absorption lines – galaxies: ISM – galaxies: halos – galaxies: abundances1 Introduction
The study of high redshift damped Ly absorption systems (hereafter DLAS) detected in the optical spectra of QSOs is now recognized as a powerful means to investigate the properties of distant galaxies or protogalaxies. Many characteristics of the associated intervening objects can be determined from absorption line data: H i column density, metallicity, ionization state and velocity distribution of the gas. For radio-loud quasars, even more physical parameters are accessible such as the temperature of the H i gas (if 21 cm absorption has been searched for) or Faraday rotation measures induced by the intervening plasma. The large values together with the low ionization degree and small velocity dispersion inferred from ground-based observations for the absorbers bear much resemblance to the properties observed in local galactic disks (Wolfe et al. 1986). Further, in average, metals are observed to be underabundant with respect to Solar values but by a factor of typically 10 (Pettini et al. 1997a) which is naturally accounted for by cosmic evolution (Pei & Fall 1995). DLAS are therefore believed to trace the internal regions of distant ”normal” galaxies or their progenitors up to the redshifts of the most distant QSOs known to date ().
| Quasar | Coordinates (J2000) | MAB(B) | Grism | Exposure | Observation | |||
|---|---|---|---|---|---|---|---|---|
| R.A. | Dec | time | date | |||||
| EX 0302223 | 03 02 36.1 | -22 23 34 | 1.409 | 1.0095 (DLAS cand.) | 19.60 | G270H | 2400 s | 07 Dec 1995 |
| PKS 0454+039 | 04 56 47.1 | +04 00 53 | 1.345 | 0.8596 (DLAS) | 19.95 | G190H | 3640 s | 3 Jan 1995 |
| G270H | s | |||||||
| 3C 196 | 08 13 36.0 | +48 13 03 | 0.871 | 0.437 (DLAS, 21 cm) | 21.52 | G160L | 3200 s | 14 Oct 1994 |
| Q 1209-107 | 12 11 40.6 | +10 30 03 | 2.191 | 0.6295 (DLAS cand.) | 21.21 | G160L | 3200 s | 3 Feb 1995 |
| PKS 1229021 | 12 32 00.0 | 02 24 05 | 1.038 | 0.3950 (DLAS, 21 cm) | 18.42 | G190H | 3640 s | 1 Jan 1995 |
| G270H | s | |||||||
| 3C 286 | 13 31 08.3 | +30 30 32 | 0.849 | 0.6922 (DLAS, 21 cm) | 20.17 | G190H | 3870 s | 26 Jan 1995 |
| G270H | s | |||||||
To verify this assumption in a direct way, and especially investigate the contribution of faint objects (such as dwarf or low surface-brightness galaxies) that QSO absorption line studies have the power to reveal, we have undertaken a HST study of damped (or candidate damped) Ly systems at low . Indeed, because of their anticipated faintness and low angular separation to the QSO, it is very difficult to detect and characterize the associated intervening objects using images obtained from the ground (see e.g. Boissé & Boulade 1990; Steidel et al. 1994a). In the latter, the presence of normal galaxies can be detected at low impact parameters but their morphological type, magnitude or extent can hardly be determined due to blending with the bright QSO image. Fainter objects or galaxies at angular separations smaller than about 0.5″ cannot be reliably detected.
In a previous paper (Le Brun et al. 1997, hereafter Paper I), we used high angular resolution HST images to search for galaxies close to the line of sight of QSOs with damped (or candidate damped) Ly systems. Thanks to a careful subtraction of the QSO image, we could show that galaxy-like objects are always present at small impact parameters and that, contrary to Mg ii absorbers, damped Ly lines are associated with objects displaying a broad range of morphologies and surface brightness.
The present paper is devoted to a spectroscopic study of the same QSO sample. Our primary aim is to complement data already obtained on a few intermediate redshift systems (Steidel et al. 1993; Cohen et al. 1994; Cohen et al. 1996) and investigate several other cases that have not yet been studied. More specifically we wish i) to determine the H i column density and confirm the damped nature of each system, ii) to detect metal lines suitable for measuring the relative abundance of heavy elements and iii) to investigate other properties such as the amount of dust and molecules. Since we now have some information on the morphological type, luminosity and extent of the intervening galaxies and know which part of them is probed by the QSO sightline, QSO spectra can give important clues to connect the absorption line data to our knowledge of nearby galaxies. More generally, such a global study of systems at intermediate redshift (i.e. intermediate look-back time) is essential to better understand the cosmic evolution of the damped Ly absorbers from up to (Pettini et al. 1997a).
This paper is organized as follows: in Sect. 2, we present the observations and data analysis. The main new results emerging from the spectra are summarized for each target in Sect. 3 while in Sect. 4, we discuss the properties of the DLAS that can be inferred from the new FOS data. Some other metal-rich systems of interest are presented in Sect. 5. Finally, we discuss the implications of these observations on the cosmic evolution of damped Ly absorbers and the bias induced by dust extinction on the apparent properties of the large systems.
| N | Ident. | |||||
|---|---|---|---|---|---|---|
| 1 | 2255.80 | 0.45 | 0.22 | 1122.53 | Fe iii | 1.0096 |
| 2 | 2264.54 | 2.60 | 1.12 | 972.54 | Ly | 1.3285 |
| 3 | 2274.29 | 0.80 | 0.34 | 977.02 | C iii | 1.3278a |
| 4 | 2300.83 | 0.37 | 0.18 | 1144.94 | Fe ii | 1.0096 |
| 5 | 2306.01 | 0.51 | 0.27 | 1206.50 | Si iii | 0.9113 |
| 0.23 | 1025.72 | Ly | 1.2482 | |||
| 6 | 2323.09 | 1.60 | 0.84 | 1215.67 | Ly | 0.9110 |
| 7 | 2339.62 | 0.33 | 0.14 | 972.54 | Ly | 1.0093 |
| 8 | 2344.10 | 0.42 | 0.42 | 2344.21 | Fe ii | 0.0000 |
| 9 | 2350.46 | 0.49 | 0.20 | 977.02 | C iii | 1.4057 |
| 10 | 2383.05 | 0.66 | 0.66 | 2382.76 | Fe ii | 0.0001 |
| 11 | 2388.63 | 5.31 | 2.29 | 1025.72 | Ly | 1.3287 |
| 12 | 2391.89 | 0.62 | 0.31 | 1190.41 | Si ii | 1.0093 |
| 13 | 2397.65 | 0.86 | 0.43 | 1193.29 | Si ii | 1.0093 |
| 14 | 2412.19 | 1.46 | 0.73 | 1200.0 | N i | 1.0102a |
| 1036.34 | C ii | 1.3276 | ||||
| 15 | 2425.02 | 2.48 | 1.23 | 1206.50 | Si iii | 1.0100 |
| 16 | 2442.96 | 21.5 | 10.7 | 1215.67 | Ly | 1.0096 |
| 17 | 2467.40 | 1.03 | 0.43 | 1025.72 | Ly | 1.4055 |
| 18 | 2482.31 | 0.93 | 0.39 | 1031.93 | O vi | 1.4055 |
| 19 | 2495.89 | 0.54 | 0.22 | 1037.62 | O vi | 1.4054 |
| 20 | 2532.81 | 1.55 | 0.77 | 1260.42 | Si ii | 1.0095 |
| e | 1259.52 | S ii | 1.0095 | |||
| 21 | 2577.86 | 0.41 | 0.41 | 2576.88 | Mn ii | 0.0004 |
| 22 | 2586.66 | 0.58 | 0.58 | 2586.65 | Fe ii | 0.0000 |
| 23 | 2600.25 | 0.55 | 0.55 | 2600.17 | Fe ii | 0.0000 |
| 24 | 2616.59 | 0.66 | 0.33 | 1302.17 | O i | 1.0094 |
| 25 | 2620.96 | 0.98 | 2344.21 | Fe ii | 0.1181a | |
| 1304.37 | Si ii | 1.0094 | ||||
| 26 | 2654.27 | 0.45 | 0.40 | 2374.46 | Fe ii | 0.1178 |
| 27 | 2663.71 | 0.28 | 0.25 | 2382.76 | Fe ii | 0.1179 |
| 28 | 2681.83 | 1.53 | 0.76 | 1334.53 | C ii | 1.0096a |
| 1335.71 | C ii* | 1.0096 | ||||
| 29 | 2732.97 | 0.77 | 0.34 | 1215.67 | Ly | 1.2481a |
| 30 | 2770.58 | 0.37 | 0.16 | 1190.42 | Si ii | 1.3274 |
| 31 | 2777.51 | 0.19 | 0.08 | 1193.29 | Si ii | 1.3276 |
| 32 | 2796.45 | 0.61 | 0.61 | 2796.35 | Mg ii | 0.0000 |
| 33 | 2800.88 | 1.75 | 0.87 | 1393.76 | Si iv | 1.0096 |
| 34 | 2803.69 | 0.56 | 0.53 | 2803.53 | Mg ii | 0.0001 |
| 35 | 2808.37 | 0.84 | 0.36 | 1206.50 | Si iii | 1.3277 |
| 36 | 2818.98 | 1.40 | 0.70 | 1402.77 | Si iv | 1.0096 |
| 37 | 2830.52 | 6.14 | 2.64 | 1215.67 | Ly | 1.3284a |
| 38 | 2852.95 | 0.78 | 0.78 | 2852.96 | Fe ii | 0.0000 |
| 39 | 2891.47 | 0.38 | 0.34 | 2586.65 | Fe ii | 0.1178 |
| 40 | 2906.47 | 1.18 | 1.06 | 2600.17 | Fe ii | 0.1178 |
| 41 | 2916.39 | 0.24 | 0.13 | 1526.71 | Si ii | 0.9102 |
| 42 | 2924.26 | 0.81 | 0.50 | 1215.67 | Ly | 1.4055 |
| 43 | 2934.31 | 0.61 | 0.50 | 1260.42 | Si ii | 1.3280a |
| 44 | 2958.49 | 0.96 | 0.50 | 1548.19 | C iv | 0.9109 |
| 45 | 2963.26 | 0.85 | 0.44 | 1550.77 | C iv | 0.9108 |
| 46 | 2980.19 | 0.26 | 0.11 | 1238.82 | N v | 1.4057 |
| 47 | 2990.01 | 0.23 | 0.09 | 1242.80 | N v | 1.4059 |
| 48 | 3031.91 | 0.21 | 0.09 | 1260.42 | Si ii | 1.4055 |
| 0.09 | 1302.17 | O i | 1.3284 | |||
| 49 | 3068.21 | 1.19 | 0.59 | 1526.71 | Si ii | 1.0097 |
| 50 | 3106.83 | 0.73 | 0.31 | 1334.53 | C ii | 1.3280 |
| 51 | 3111.32 | 2.58 | 1.28 | 1548.19 | C iv | 1.0096 |
| 52 | 3116.74 | 2.01 | 1.00 | 1550.77 | C iv | 1.0098 |
| 53 | 3126.04 | 0.78 | 0.70 | 2796.35 | Mg ii | 0.1179 |
| 54 | 3134.25 | 0.76 | 0.68 | 2803.53 | Mg ii | 0.1180 |
| 55 | 3232.15 | 0.52 | 0.26 | 1608.45 | Fe ii | 1.0095 |
a Blend
2 Observations and data reduction
2.1 The sample
Since no confirmed DLAS had been discovered by the HST at the time when our study was undertaken, we had to rely on the presence of 21 cm absorption or a high ratio to select our targets (see Paper I for details). Three quasars in our sample satisfy the first criterion: 3C 196, PKS 1229021 and 3C 286. It is to be noted that the presence of 21 cm absorption does not necessarily guarantee that the Ly line is damped because part of the radio flux originates from extended components such as jets or lobes (3C 196 and PKS 1229021) and the H i distribution in the absorber may exhibit spatial structure at scales comparable to the extent of these features. The other three objects, EX 0302223, PKS 0454+039 and Q 1209+107, have a system with a high ratio.
We have retrieved from the HST database the G270H spectrum of EX 0302223 which has been observed by another team (program 6224, dataset Y2SH0103T). The main characteristics of the QSOs and absorption systems of interest, as well as the log of the HST observations, are given in Table 1 (the absolute magnitudes of the candidate absorbers listed in paper I are affected by an error; corrected values are given in Table 1).
2.2 Data reduction
The only modifications introduced to the HST pipe-line reduced data involves the wavelength scale and zero point of the intensity scale. When two distinct exposures were obtained for a given object and grism, the two spectra were averaged (with weights according to the exposure time). To define the absolute wavelength scale, we apply uniform shifts determined using strong Galactic lines from singly ionized species, the latter being assumed at rest. In some spectra, no such line is seen with a good enough signal-to-noise ratio; we then rely on strong unblended lines from already known absorption systems with well determined optical redshifts. Further, when a common transition is detected both in the G190H and G270H spectra, this feature is used to constrain the relative shift of these two spectra. The shifts applied to the original wavelengths for PKS 0454+039, PKS 1229021 and 3C 286 are 1.4, 2.3 and 1.2 Å respectively for the G190H spectra and 1.5, 2.3 and 1.8 Å for the G270H data (the G270H spectrum of EX 0302223 has been shifted by Å ). For the G160L data, only the strongest absorption features from known systems are useful; Å and 6 Å have been added to the original wavelengths for Q 1209+107 and 3C 196 respectively.
Regarding the intensity scale, we used the profiles of damped Ly lines or of Lyman edges to determine the true zero level. Generally, damped Ly lines seen in the high resolution data do not go exactly to zero, even when they are clearly saturated at the line core. Although the observed offsets are quite small, they would have a significant effect on the fitting procedures, so we subtracted them. These offsets are generally positive and are presumably due to scattered light in the instrument. Their effect on measurements is however always negligible as compared to .
2.3 Data analysis and results
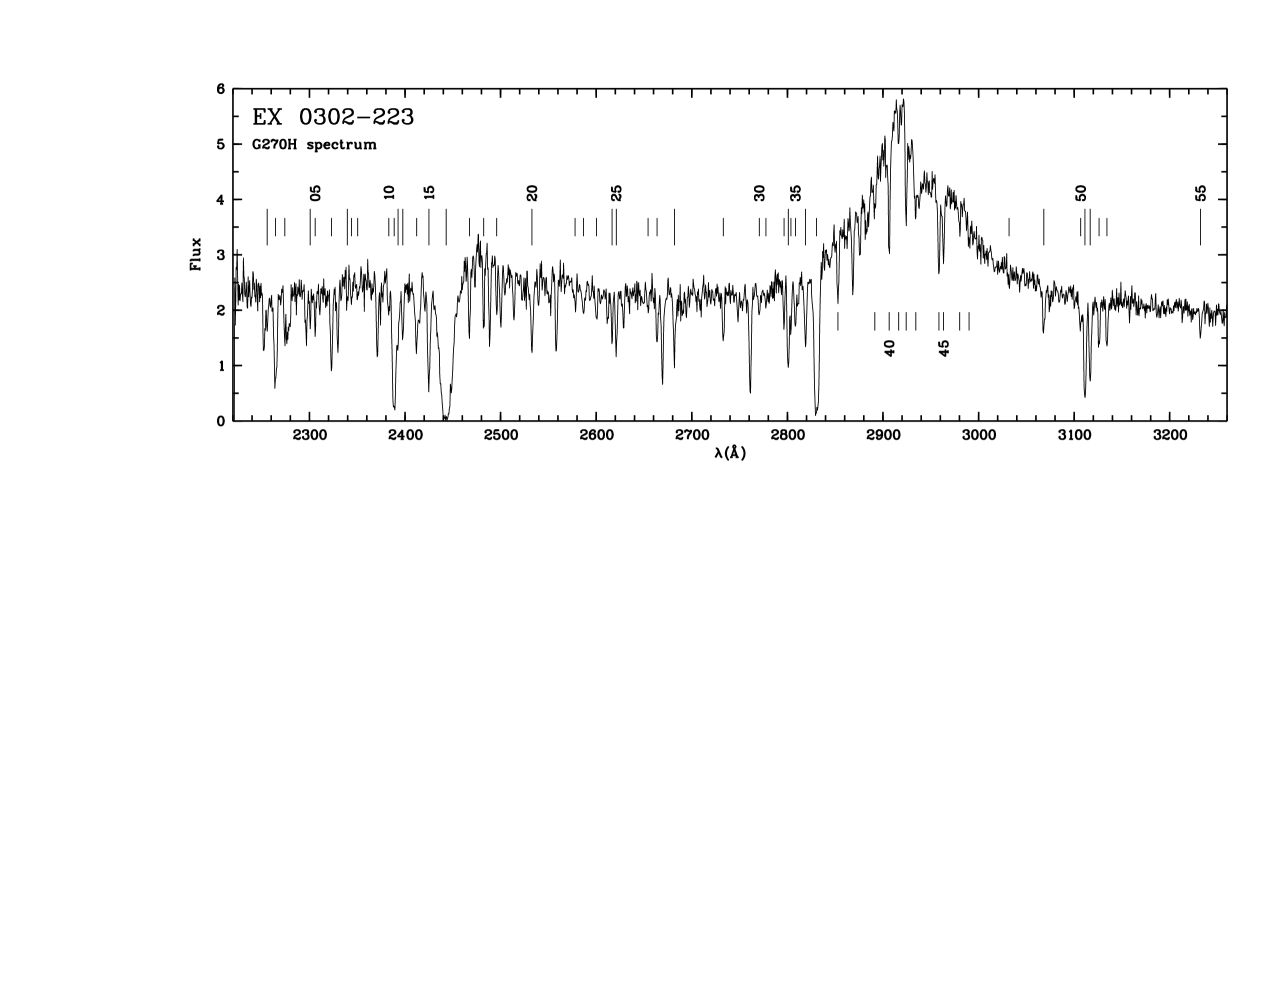
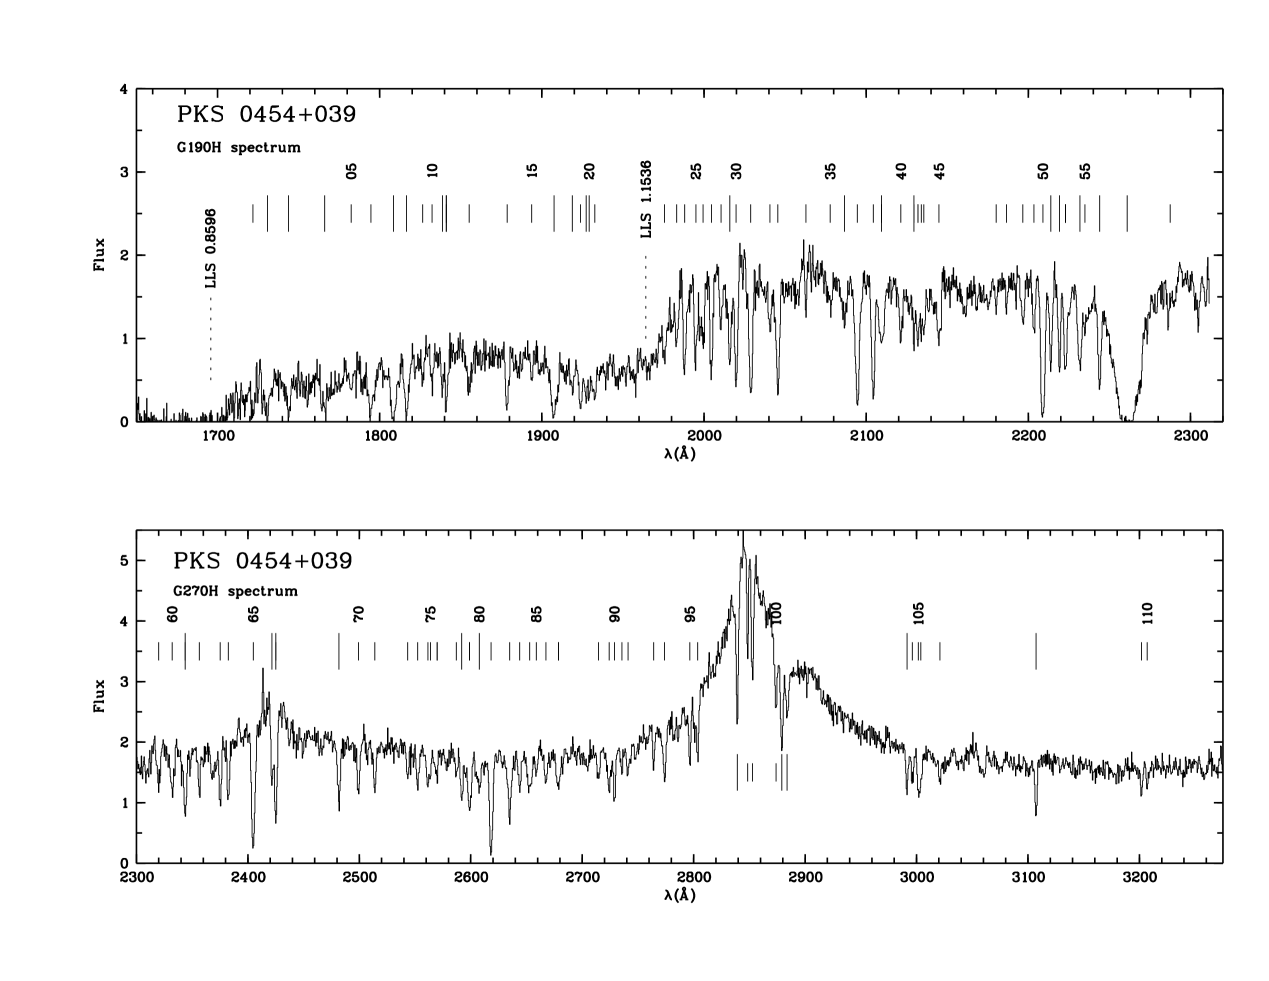
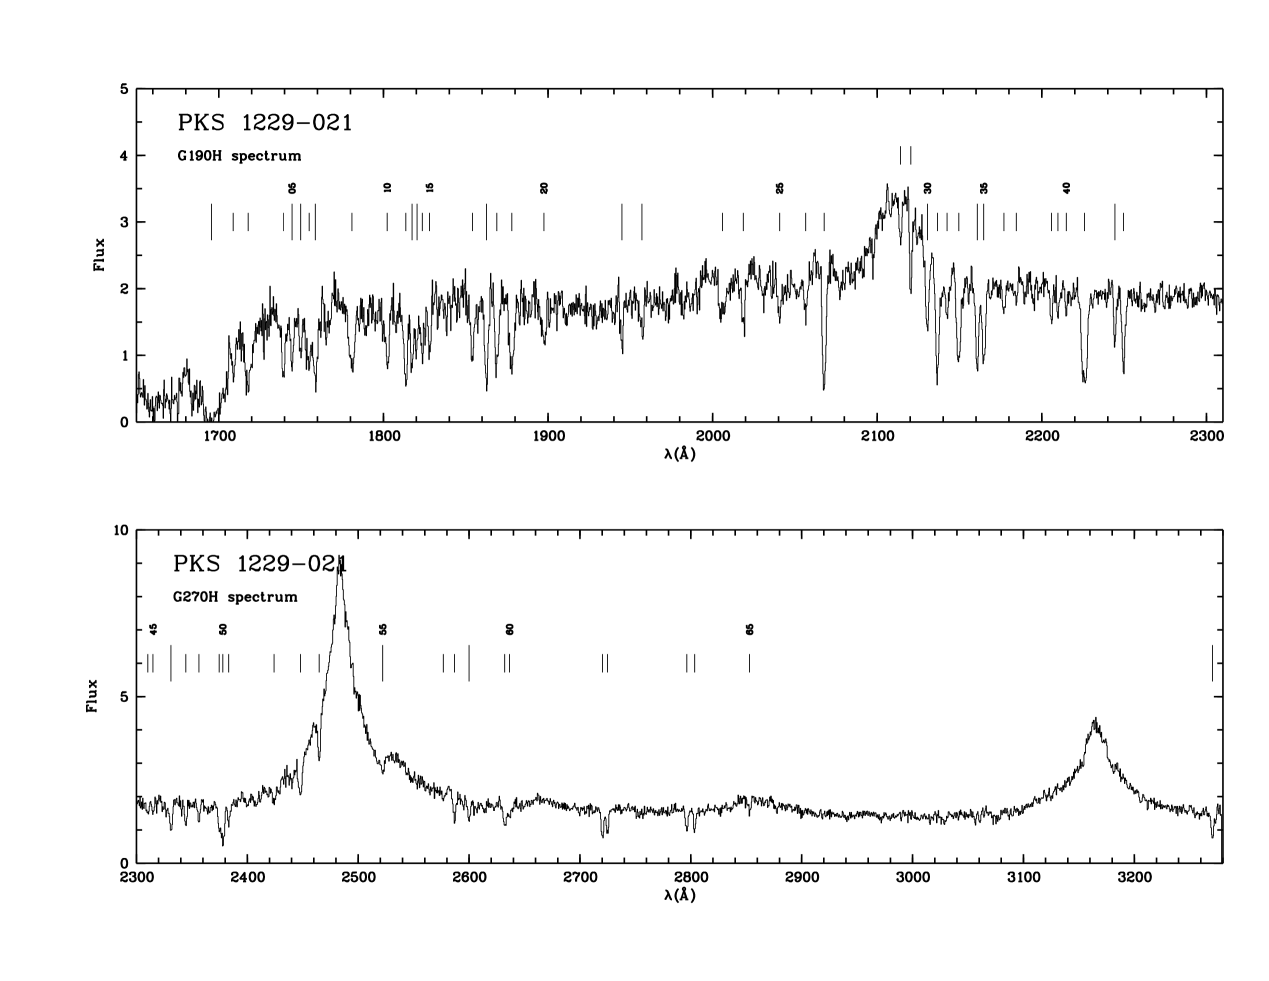
Figures 1 to 6 present the spectra obtained for EX 0302223 (G270H), PKS 0454+039 (G190H and G270H), 3C 196 and Q 1209+107 (G160L), PKS 1229021 and 3C 286 (G190H and G270H). The full width at half-maximum (FWHM) of an unresolved line is 1.5, 2.0 and 6.3 Å in the G190H, G270H and G160L data respectively. All spectra are given in flux units of erg cm-2 s-1 Å-1. The detection, measurement and identification of all absorption lines have been performed interactively. The uncertainty on observed equivalent widths is derived (in the same manner as Young et al. 1979) from the noise level measured in selected portions of the spectra which look free from any absorption line. For weak unresolved features, lies in the range 0.06 – 0.10 Å over most of all the G190H and G270H ranges (0.07 – 0.08 Å being by far the most common values). Locally, can be smaller (e.g. on emission lines where values as low as Å are reached) or larger (e.g. when blending occurs). The central wavelengths of the absorption lines are obtained by fitting a Gaussian to the observed profile (after normalizing the adjacent continuum if necessary, e.g. for absorption lines located on an emission line). For the identification of features significant at the level, we first search for absorption from already known metal systems using the list of strong lines given by Bahcall et al. (1993; their Table 1). The presence of weaker transitions that might be expected on the basis of the results obtained in this first step is then examined, especially from the DLAS, for which we accept lines at a lower significance level. To this aim, we consider the extensive line list given by Verner et al. (1994). The identification is performed on the basis of criteria involving redshift agreement, line width as compared to the instrumental profile and relative strength, when several transitions from the same species are detected. When two or more lines strongly overlap, wavelengths and equivalent widths are measured after deblending. This was performed using the context FIT/LYMAN developed by A. Fontana within MIDAS, the ESO data analysis software package; this routine was also used to fit line profiles and extract gaseous column densities for damped Ly lines or Lyman edges. Among the lines left unidentified, we have searched for the presence of metal doublets and, in the Ly forest, for lines from the Lyman series possibly associated with the strongest candidate Ly features.
This results in the line lists given in Tables 2 to 5. For EX 0302223, only lines from metal systems are given in Table 2. Although the S/N ratio is quite good, some ambiguities remain due to 1) the large number of absorption features expected from the DLAS and 2) the presence in EX 0302223, PKS 0454+039 and PKS 1229021 of several other metal systems. When two or more transitions might contribute to a given feature, they are indicated in the Tables. Le Brun & Bergeron (1997) have performed an identification of Ly absorbers in the field of 3C 286 and give for this object a more extensive list of candidate Ly lines (down to the significance level).
3 Comments on individual objects
Here, we briefly summarize spectroscopic data previously obtained on our targets and indicate the main results provided by the new spectra.
| N | Ident. | N | Ident. | ||||||||||
|---|---|---|---|---|---|---|---|---|---|---|---|---|---|
| 1 | 1721.81 | 1.47 | 1215.67 | Ly | 0.4163 | 56 | 2243.97 | 1.38 | 0.74 | 1206.50 | Si iii | 0.8599 | |
| 926.23 | Ly | 0.8589 | 57 | 2260.90 | 18.70 | 10.05 | 1215.67 | Ly | 0.8598 | ||||
| 2 | 1730.82 | 2.30 | 1.24 | 930.65 | Ly | 0.8598 | 58 | 2287.45 | 1.00 | 0.53 | 1215.67 | Ly | 0.8816 |
| 3 | 1743.86 | 2.03 | 1.09 | 937.80 | Ly | 0.8595 | 59 | 2319.98 | 1.13 | 0.59 | 1215.67 | Ly | 0.9084 |
| 4 | 1766.09 | 2.70 | 0.94 | 949.74 | Ly | 0.8596 | 60 | 2332.12 | 1.50 | 0.78 | 1215.67 | Ly | 0.9183 |
| 5 | 1782.40 | 0.54 | 0.37 | 1215.67 | Ly | 0.4662 | 61 | 2343.76 | 1.85 | 1260.42 | Si ii | 0.8595f | |
| 6 | 1794.58 | 3.30 | 1.53 | 832.93 | O iii | 1.1545a | 2344.21 | Fe ii | -0.0002 | ||||
| 7 | 1808.54 | 3.90 | 2.10 | 972.54 | Ly | 0.8596 | 62 | 2356.43 | 1.00 | 0.51 | 1215.67 | Ly | 0.9384 |
| 8 | 1816.54 | 2.51 | 1.35 | 977.02 | C iii | 0.8593 | 63 | 2367.94 | 0.59 | 0.29 | 1144.94 | Fe ii | 1.0682c |
| 9 | 1826.47 | 0.60 | 0.30 | 923.15 | Ly | 0.9785 | 64 | 2375.15 | 1.07 | 1.07 | 2374.46 | Fe ii | 0.0002c |
| 10 | 1832.29 | 0.85 | 0.43 | 926.23 | Ly | 0.9782 | 65 | 2382.42 | 1.11 | 1.11 | 2382.77 | Fe ii | -0.0001 |
| 11 | 1838.77 | 0.86 | 0.46 | 988.77 | O i | 0.8597 | 66 | 2404.78 | 3.23 | 1.63 | 1215.67 | Ly | 0.9781 |
| 12 | 1841.06 | 1.40 | 989.87 | Si ii | 0.8599b | 67 | 2421.57 | 1.25 | 0.67 | 1302.17 | O i | 0.8596 | |
| 930.75 | Ly | 0.9780 | 68 | 2424.97 | 2.38 | 1215.67 | Ly | 0.9948 | |||||
| 13 | 1855.19 | 1.57 | 0.79 | 937.80 | Ly | 0.9782 | 1304.37 | Si ii | 0.8591 | ||||
| 14 | 1878.62 | 1.57 | 0.79 | 949.74 | Ly | 0.9780 | 69 | 2481.75 | 1.35 | 0.73 | 1334.53 | C ii | 0.8596 |
| 15 | 1893.75 | 0.57 | 0.36 | 1215.67 | Ly | 0.5577 | 70 | 2499.23 | 1.02 | 0.50 | 1215.67 | Ly | 1.0558 |
| 16 | 1907.49 | 3.70 | 1.99 | 1025.72 | Ly | 0.8597 | 71 | 2513.90 | 0.85 | 0.41 | 1215.67 | Ly | 1.0679 |
| 17 | 1918.78 | 0.80 | 0.51 | 1031.93 | O vi | 0.8594 | 72 | 2543.37 | 0.64 | 0.31 | 1215.67 | Ly | 1.0922 |
| 18 | 1923.85 | 1.28 | 0.65 | 972.54 | Ly | 0.9782 | 73 | 2552.30 | 0.83 | 0.40 | 1215.67 | Ly | 1.0995 |
| 19 | 1927.28 | 0.66 | 0.35 | 1036.34 | C ii | 0.8597 | 74 | 2561.57 | 0.66 | 0.32 | 1238.82 | N v | 1.0678 |
| 20 | 1929.16 | 0.42 | 0.22 | 1037.62 | O vi | 0.8592 | 75 | 2563.75 | 0.44 | 0.20 | 1190.42 | Si ii | 1.1537 |
| 21 | 1932.64 | 1.00 | 0.63 | 1215.67 | Ly | 0.5898 | 76 | 2569.85 | 0.58 | 1242.80 | N v | 1.0678 | |
| 22 | 1975.58 | 0.57 | 0.35 | 1215.67 | Ly | 0.6251 | 1193.29 | Si ii | 1.1536 | ||||
| 23 | 1983.13 | 0.56 | 0.26 | 920.96 | Ly | 1.1533 | 77 | 2587.02 | 0.38 | 0.38 | 2586.65 | Fe ii | 0.0001 |
| 24 | 1988.08 | 1.24 | 0.58 | 923.15 | Ly | 1.1539 | 78 | 2591.92 | 0.92 | 0.49 | 1393.86 | Si iv | 0.8595 |
| 25 | 1995.00 | 1.12 | 0.52 | 926.23 | Ly | 1.1539 | 79 | 2599.00 | 1.42 | 2600.17 | Fe ii | -0.0001 | |
| 26 | 1999.44 | 1.24 | 0.75 | 1215.67 | Ly | 0.6447 | 1206.50 | Si iii | 1.1542 | ||||
| 27 | 2004.57 | 1.25 | 0.58 | 930.75 | Ly | 1.1537 | 80 | 2607.68 | 0.63 | 1402.77 | Si iv | 0.8591c | |
| 28 | 2010.54 | 0.80 | 0.39 | 972.54 | Ly | 1.0673 | 1260.42 | Si ii | 1.0689 | ||||
| 29 | 2015.87 | 1.80 | 0.97 | 1083.99 | N ii | 0.8597 | 81 | 2618.27 | 3.02 | 1.40 | 1215.67 | Ly | 1.1538 |
| 30 | 2019.73 | 1.84 | 1.05 | 937.80 | Ly | 1.1537 | 82 | 2634.90 | 1.86 | 0.86 | 1215.67 | Ly | 1.1674 |
| 31 | 2028.78 | 2.26 | 1.12 | 1025.72 | Ly | 0.9779 | 83 | 2643.95 | 0.67 | 0.31 | 1215.67 | Ly | 1.1749 |
| 32 | 2040.63 | 0.47 | 0.28 | 1215.67 | Ly | 0.6786 | 84 | 2652.83 | 1.23 | 0.56 | 1215.67 | Ly | 1.1822c |
| 33 | 2045.49 | 1.80 | 0.84 | 949.74 | Ly | 1.1537 | 85 | 2658.77 | 0.35 | 0.16 | 1215.67 | Ly | 1.1871 |
| 34 | 2062.79 | 0.32 | 0.19 | 1215.67 | Ly | 0.6968 | 86 | 2667.41 | 0.61 | 0.28 | 1238.82 | N v | 1.1532 |
| 35 | 2077.82 | 0.66 | 0.38 | 1215.67 | Ly | 0.7092c | 87 | 2678.63 | 1.19 | 1215.67 | Ly | 1.2034c | |
| 36 | 2086.61 | 0.45 | 0.24 | 1121.99 | Fe ii | 0.8597c | 1242.80 | N v | 1.1553c | ||||
| 37 | 2094.54 | 2.76 | 1.28 | 972.54 | Ly | 1.1537 | 88 | 2714.49 | 0.60 | 0.28 | 1260.42 | Si ii | 1.1536 |
| 38 | 2104.36 | 1.91 | 0.88 | 977.02 | C iii | 1.1539 | 89 | 2724.17 | 1.20 | 0.54 | 1215.67 | Ly | 1.2409 |
| 39 | 2109.45 | 1.75 | 1134.66 | N i | 0.8591 | 90 | 2728.95 | 0.95 | 0.42 | 1215.67 | Ly | 1.2448 | |
| 972.54 | Ly | 1.1690 | 91 | 2735.56 | 0.32 | 0.14 | 1215.67 | Ly | 1.2502 | ||||
| 40 | 2121.38 | 0.78 | 0.37 | 1025.72 | Ly | 1.0682 | 92 | 2741.05 | 0.53 | 0.23 | 1215.67 | Ly | 1.2548 |
| 41 | 2129.40 | 0.50 | 988.77 | O i | 1.1536 | 93 | 2764.14 | 0.60 | 0.26 | 1215.67 | Ly | 1.2738 | |
| 1144.94 | Fe ii | 0.8598 | 94 | 2773.87 | 1.25 | 0.55 | 1215.67 | Ly | 1.2818 | ||||
| 42 | 2131.87 | 0.62 | 989.80 | N iii | 1.1538d | 95 | 2796.57 | 1.05 | 1.05 | 2796.35 | Mg ii | 0.0001 | |
| 43 | 2133.94 | 0.36 | 0.17 | 1031.93 | O vi | 1.0679 | 96 | 2803.58 | 1.38 | 1.38 | 2803.53 | Mg ii | 0.0000 |
| 44 | 2135.50 | 0.51 | 0.29 | 1215.67 | Ly | 0.7566 | 97 | 2839.12 | 1.49 | 0.80 | 1526.71 | Si ii | 0.8596 |
| 45 | 2144.87 | 1.30 | 0.74 | 1215.67 | Ly | 0.7644e | 98 | 2848.44 | 0.50 | 0.21 | 1215.67 | Ly | 1.3431 |
| 46 | 2180.18 | 0.20 | 0.11 | 1215.67 | Ly | 0.7934 | 99 | 2852.75 | 0.87 | 0.87 | 2852.96 | Mg i | -0.0001 |
| 47 | 2186.54 | 0.21 | 0.11 | 1215.67 | Ly | 0.7986 | 100 | 2873.88 | 1.01 | 0.47 | 1334.53 | C ii | 1.1535 |
| 48 | 2196.62 | 0.70 | 0.39 | 1215.67 | Ly | 0.8069 | 101 | 2879.08 | 1.45 | 0.78 | 1548.20 | C iv | 0.8596 |
| 49 | 2203.45 | 0.63 | 0.35 | 1215.67 | Ly | 0.8125 | 102 | 2883.81 | 1.01 | 0.54 | 1550.77 | C iv | 0.8596 |
| 50 | 2208.96 | 2.97 | 1.38 | 1025.72 | Ly | 1.1536 | 103 | 2991.49 | 0.90 | 0.48 | 1608.45 | Fe ii | 0.8598 |
| 51 | 2213.88 | 1.17 | 0.63 | 1190.42 | Si ii | 0.8597 | 104 | 2996.15 | 0.77 | 0.72 | 2796.35 | Mg ii | 0.0715 |
| 52 | 2219.17 | 1.07 | 0.57 | 1193.29 | Si ii | 0.8597 | 105 | 3001.56 | 0.85 | 0.39 | 1393.76 | Si iv | 1.1536 |
| 53 | 2222.93 | 1.66 | 1025.72 | Ly | 1.1672 | 106 | 3003.81 | 0.71 | 0.66 | 2803.53 | Mg ii | 0.0714 | |
| 1031.93 | O vi | 1.1541 | 107 | 3020.98 | 0.51 | 0.24 | 1402.77 | Si iv | 1.1536 | ||||
| 54 | 2231.76 | 1.60 | 1199.55 | N i | 0.8605 | 108 | 3107.24 | 1.17 | 0.63 | 1670.79 | Al ii | 0.8597 | |
| 1036.34 | C ii | 1.1535 | 109 | 3201.83 | 0.57 | 0.28 | 1548.20 | C iv | 1.0681 | ||||
| 55 | 2234.84 | 0.38 | 1037.62 | O vi | 1.1538 | 110 | 3206.98 | 0.45 | 0.22 | 1550.77 | C iv | 1.0680 |
a also O ii834
b also N iii989
c blend
d also Si ii989
e blend with O vi at
f also S ii1259
3.1 EX 0302223
Metal-rich absorption systems have been mentioned for this object at (Mg ii: Bergeron, unpublished) and (Fe ii and Mg ii: Petitjean & Bergeron 1990). The FOS spectrum (Fig. 1), clearly shows that the Ly line from the latter is damped and reveals several strong features from C ii, C iv, N i, O i, Si ii, Si iii and Si iv. No less than four new metal systems are detected. In agreement with the prediction made in paper I, relatively strong lines from Fe ii and Mg ii are seen at a redshift , similar to that of a bright spiral galaxy located kpc from the QSO line of sight. Second, a strong C iv doublet together with Ly is present at . In addition to Ly, Ly and Ly the FOS spectrum shows weak features from C ii, C iii, Si ii and Si iii at ; this system induces a Lyman edge near 2120 Å which is clearly apparent in the IUE spectrum (Lanzetta et al. 1995). On the other hand, no convincing line is seen from the Mg ii system (the line at 2371 Å could be Al ii1670 at , but this feature seems to be too strong given that we do not detect Fe ii1608). Finally, a narrow high ionization system with strong O vi lines is detected at . The HST data do not confirm the and 0.9874 candidate damped Ly lines proposed by Lanzetta et al. (1995) (the former turns out to be Ly at 1.3284).
3.2 PKS 0454+039
Before this study, two absorption systems were known in this object, at and 1.1537 (Burbidge et al. 1977, Caulet 1989; Steidel & Sargent 1992). Steidel et al. (1995) have shown that the first one is a low metallicity (about 1/10 solar) DLAS, as indeed suggested by the strength of Mg ii and Fe ii lines, while in the second system, the Ly line is not damped. More than twenty metal lines are seen at together with a Lyman edge near 1700 Å (Fig. 2). The Si ii1304 line is definitely blended with another (Lyonly) line since i) it appears too strong with respect to e.g. Si ii1260 and ii) the match in redshift is not satisfactory. In addition to several metal lines from Si ii, Si iii, Si iv, C ii and C iii, the system displays a beautiful set of 9 lines from the Lyman series ending with a partial Lyman edge; the presence of N v and O vi lines in this system remains uncertain. One additional motivation for observing this QSO is the presence of two intervening galaxies detected by Steidel et al. (1993). The closest one is a dwarf star-forming galaxy at from which we do detect Mg ii absorption. The second galaxy is a more luminous one at and kpc which could induce C iv absorption; no lines are seen from this galaxy but we detect a new C iv doublet at .
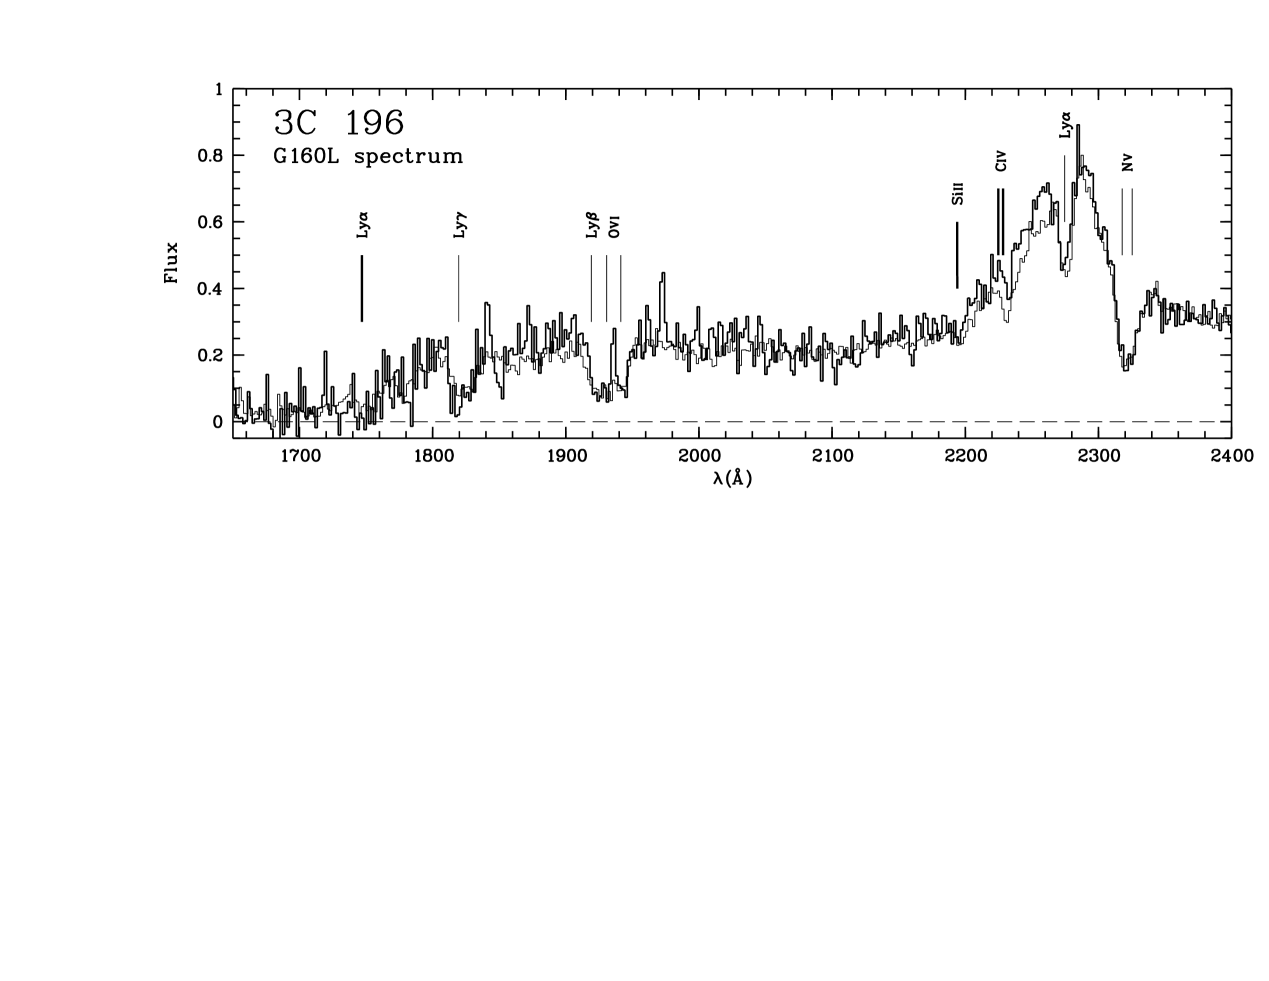
3.3 3C 196
The 21 cm absorption system at is known to display very strong associated Fe ii and Mg ii lines as well as Mn ii and Ca ii (Foltz et al. 1988; Boissé & Boulade 1990). An additional system is present at . The G160L HST data presented by Cohen et al. (1996) show that, unfortunately, the latter produces a Lyman edge nearly coincident with the Ly line at , which renders the determination of very difficult. An additional source of uncertainty in the analysis is related to the possible contribution of scattered light which makes the zero of the intensity scale ill defined. Our new (post-COSTAR) spectrum, although of lower integration time, is of interest in this regard. In order to perform a quantitative comparison, we retrieved from the HST archive the spectrum obtained in 1992 and analyzed by Cohen et al. (1996). Using the few narrow lines detected at either , 0.437 or 0.871 (Fig. 3), we measure shifts of 14 and 6 Å in the wavelength scales of the late and new spectrum respectively (these values are not accurate but the relative shift of 8 Å is well constrained by the data). Once corrected, the two spectra appear in quite good agreement but a systematic difference is seen in the blue wing of the Ly emission line (Fig. 3). If not instrumental, such an effect could be due to variable Ly absorption from gas ejected by the QSO; the time elapsed between the two observations is 2.05 yr and during that interval the amount or ionization degree of the gas may have changed (see e.g. Schartel et al. 1997 for another example of variable absorption). An alternative possibility is intrinsic emission line variability. Variable BAL-type absorption is supported by two facts: i) the gas responsible for the narrow absorption (to which the higher velocity gas is probably associated) is known to cover only partially the broad line region (Cohen et al. 1996) and ii) only a small variation of of about cm-2 is needed to account for the strength of the effect (assuming optical thinness).
3.4 Q 1209+107
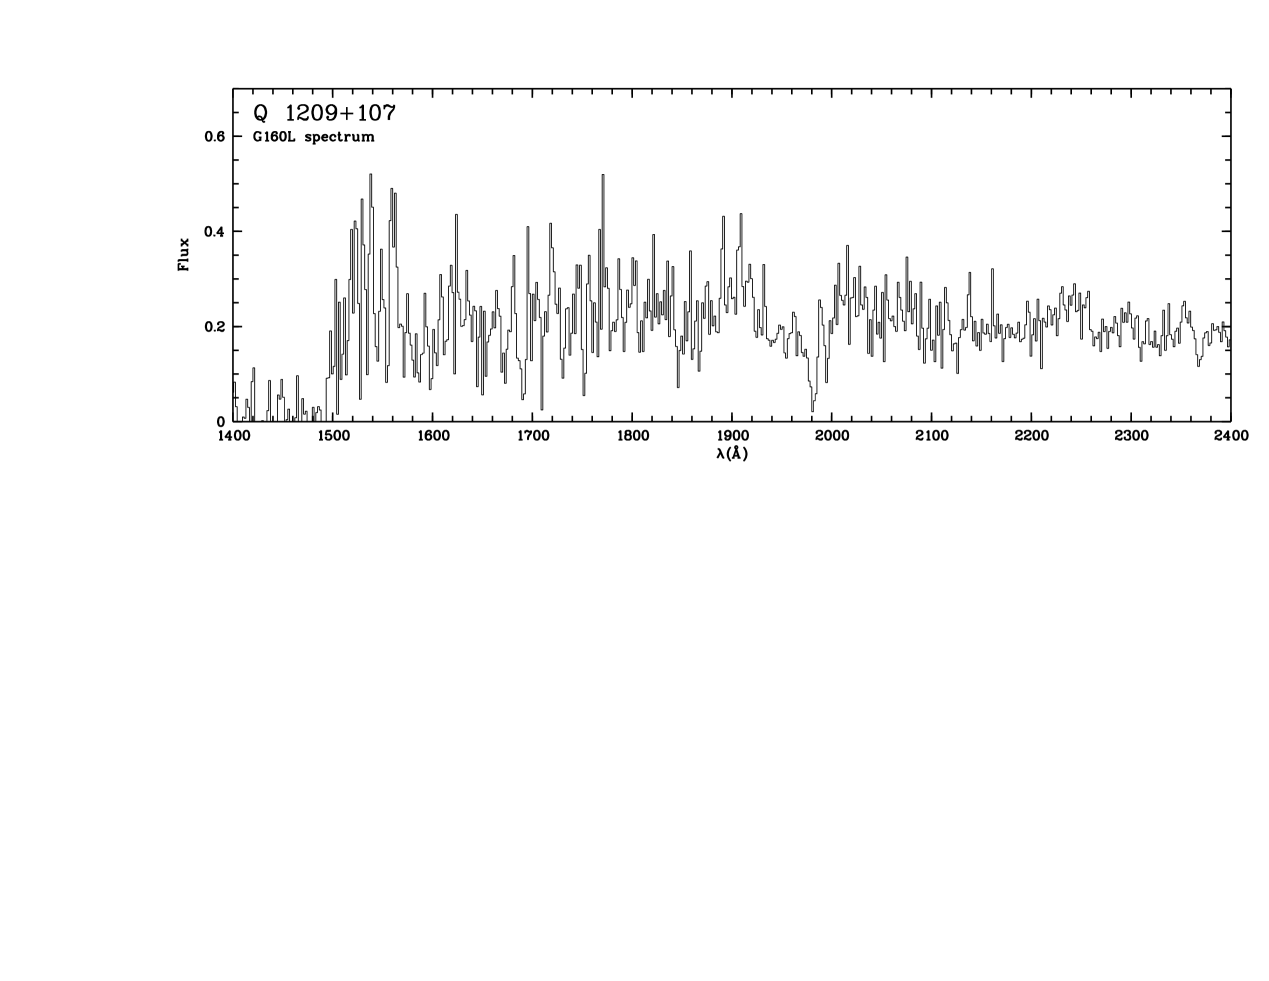
The G160L FOS spectrum (Fig. 4), although of relatively poor S/N ratio, provides significant information on the already known metal systems at , 0.6295 and 1.8434. First, these data confirm that the 0.6295 system is damped (see Sect. 4.1.4); additional narrow absorptions (Ly and N i1200) as well as a Lyman break are detected at this redshift. Ly at 0.3930 is also present and there are a few other possible features at 1.8434 (O iii702 at 1995 Å and O iii833 at 2369 Å).
| N | Ident. | |||||
|---|---|---|---|---|---|---|
| 1 | 1695.56 | ??.? | 12.5 | 1215.67 | Ly | 0.3948 |
| 2 | 1708.78 | 0.74 | 0.42 | 972.54 | Ly | 0.7570 |
| 3 | 1717.86 | 2.83 | 937.80 | Ly | 0.8318a | |
| 977.02 | C iii | 0.7583 | ||||
| 972.54 | Ly | 0.7664 | ||||
| 4 | 1739.35 | 1.18 | 0.64 | 949.74 | Ly | 0.8313 |
| 5 | 1744.53 | 0.77 | 1025.72 | Ly | 0.7008 | |
| 1250.58 | S ii | 0.3950 | ||||
| 6 | 1749.79 | 0.58 | 0.42 | 1253.81 | S ii | 0.3956 |
| 7 | 1754.95 | 1.25 | 0.87 | 1215.67 | Ly | 0.4436a |
| 8 | 1758.70 | 1.88 | 1.35 | 1260.42 | Si ii | 0.3953b |
| 9 | 1780.88 | 2.12 | 1.16 | 972.54 | Ly | 0.8312 |
| 10 | 1802.30 | 1.54 | 0.88 | 1025.72 | Ly | 0.7571 |
| 11 | 1813.61 | 1.76 | 1031.93 | O vi | 0.7575 | |
| 1025.72 | Ly | 0.7681 | ||||
| 12 | 1817.38 | 1.26 | 0.91 | 1302.17 | O i | 0.3957 |
| 13 | 1820.45 | 0.76 | 0.54 | 1304.37 | Si ii | 0.3957 |
| 14 | 1823.60 | 1.11 | 0.63 | 1037.62 | O vi | 0.7575 |
| 15 | 1828.00 | 0.88 | 0.59 | 1215.67 | Ly | 0.5037 |
| 16 | 1854.10 | 1.40 | 1854.72 | Aliii | -0.0003a | |
| 17 | 1862.65 | 1.85 | 1334.53 | C ii | 0.3957c | |
| 1862.79 | Aliii | -0.0001 | ||||
| 18 | 1868.90 | 1.60 | 1.00 | 1215.67 | Ly | 0.5373 |
| 19 | 1878.05 | 2.00 | 1.09 | 1025.72 | Ly | 0.8310 |
| 20 | 1897.52 | 0.98 | 0.53 | 1025.72 | Ly | 0.8499 |
| 21 | 1944.84 | 0.68 | 0.49 | 1393.76 | Si iv | 0.3954 |
| 22 | 1957.12 | 0.65 | 0.47 | 1402.77 | Si iv | 0.3952 |
| 23 | 2006.05 | 1.20 | 0.61 | 1025.72 | Ly | 0.9557a |
| 24 | 2018.65 | 0.83 | 0.50 | 1215.67 | Ly | 0.6605 |
| 25 | 2040.68 | 0.44 | 0.26 | 1199.55 | N i | 0.7012d |
| 26 | 2056.46 | 0.52 | 0.31 | 1215.67 | Ly | 0.6916 |
| 27 | 2067.78 | 2.47 | 1.45 | 1215.67 | Ly | 0.7009 |
| 28 | 2114.14 | 0.38 | 0.22 | 1215.67 | Ly | 0.7391 |
| 29 | 2120.39 | 0.71 | 0.40 | 1206.50 | Si iii | 0.7575 |
| 30 | 2130.50 | 1.25 | 0.90 | 1526.71 | Si ii | 0.3955 |
| 31 | 2136.60 | 1.94 | 1.11 | 1215.67 | Ly | 0.7575 |
| 32 | 2142.37 | 0.70 | 0.40 | 1215.67 | Ly | 0.7623 |
| 33 | 2149.52 | 1.90 | 1.07 | 1215.67 | Ly | 0.7682 |
| 34 | 2160.74 | 1.42 | 1.02 | 1548.20 | C iv | 0.3956 |
| 35 | 2164.63 | 1.36 | 0.98 | 1550.77 | C iv | 0.3958 |
| 36 | 2177.00 | 0.33 | 0.19 | 1238.82 | N v | 0.7573 |
| 37 | 2184.46 | 0.21 | 0.12 | 1242.80 | N v | 0.7577 |
| 38 | 2205.78 | 0.44 | 0.24 | 1215.67 | Ly | 0.8144 |
| 39 | 2209.79 | 0.33 | 0.18 | 1215.67 | Ly | 0.8177 |
| 40 | 2214.81 | 0.22 | 0.13 | 1260.42 | Si ii | 0.7572 |
| 41 | 2225.91 | 3.22 | 1.76 | 1215.67 | Ly | 0.8310 |
| 42 | 2244.32 | 0.73 | 0.52 | 1608.45 | Fe ii | 0.3953 |
| 43 | 2249.60 | 1.44 | 0.78 | 1215.67 | Ly | 0.8505 |
| 44 | 2310.24 | 0.37 | 0.19 | 1215.67 | Ly | 0.9004 |
| 45 | 2314.96 | 0.37 | 0.19 | 1215.67 | Ly | 0.9043 |
| 46 | 2331.13 | 1.40 | 1.00 | 1670.79 | Al ii | 0.3950 |
| 47 | 2344.50 | 0.86 | 0.86 | 2344.21 | Fe ii | 0.0001 |
| 48 | 2356.31 | 0.72 | 0.37 | 1215.67 | Ly | 0.9383 |
| 49 | 2374.63 | 0.95 | 0.95 | 2374.46 | Fe ii | 0.0001 |
| 50 | 2377.92 | 2.50 | 1.28 | 1215.67 | Ly | 0.9561 |
| 51 | 2383.22 | 0.93 | 0.93 | 2382.76 | Fe ii | 0.0002 |
| 52 | 2424.03 | 0.52 | 0.26 | 1215.67 | Ly | 0.9940 |
| 53 | 2447.97 | 1.18 | 0.67 | 1393.76 | Si iv | 0.7564a |
| 54 | 2464.89 | 0.76 | 0.43 | 1402.77 | Si iv | 0.7572 |
| 55 | 2522.14 | 0.38 | 0.22 | 1808.01 | Si ii | 0.3950 |
| 56 | 2576.68 | 0.24 | 0.24 | 2576.88 | Mn ii | -0.0001 |
| 57 | 2586.91 | 0.95 | 2586.65 | Fe ii | 0.0001 | |
| 1854.72 | Al iii | 0.3946 | ||||
| 58 | 2600.10 | 0.77 | 2600.17 | Fe ii | -0.0000 | |
| 1862.79 | Al iii | 0.3948 | ||||
| 59 | 2632.20 | 1.17 | 0.69 | 1548.20 | C iv | 0.7002 |
| 60 | 2636.58 | 0.63 | 0.37 | 1550.77 | C iv | 0.7002 |
| 61 | 2720.33 | 1.73 | 0.99 | 1548.20 | C iv | 0.7571 |
| 62 | 2724.85 | 1.24 | 0.71 | 1550.77 | C iv | 0.7571 |
| 63 | 2796.40 | 1.00 | 1.00 | 2796.35 | Mg ii | 0.0000 |
| 64 | 2803.49 | 0.76 | 0.76 | 2803.53 | Mg ii | 0.0000 |
| 65 | 2853.02 | 0.62 | 0.62 | 2852.96 | Mg i | 0.0000 |
| 66 | 3270.54 | 1.30 | 0.93 | 2344.21 | Fe ii | 0.3952 |
a Blend
b also S ii1259
c also also C ii*1335
d also N i1200
3.5 PKS 1229021
This object has already been the subject of several detailed optical studies. In particular, the high resolution data published by Lanzetta & Bowen (1992) suggest a high metallicity for the intervening gas since strong Mn ii lines are detected. We indeed find a large number of metal absorptions from the system at . In 1991, one of us observed this object with the IUE in order to detect the damped Ly line and determine the H i column density; surprisingly, near the expected wavelength of this feature, a cut-off was seen (this IUE spectrum is shown in the catalog of Lanzetta et al. 1993). Steidel et al. (1994a) detected a Mg ii doublet at 0.7570 and proposed that this system is responsible for the observed Lyman edge. Our data indicate that this Mg ii doublet belongs to an extensive metal line system with absorptions from Si ii, Si iii, Si iv, C iv, N v and O vi. We detect an additional C iv system at . Furthermore, a strong Ly line is seen at with several associated lines from the Lyman series; a careful examination of the optical data published by Steidel et al. (1994a) suggested the presence of weak associated Mg ii lines near 5120 Å. Measurements performed on the spectrum that C. Steidel kindly communicated to us confirm that shallow Mg ii absorption is indeed present (the 2796 Å line is seen at Å and with Å). On the basis of our higher resolution and better S/N ratio UV data, we find that the partial cut-off near 1670 Å is in fact due to this system. Fortunately, the damped Ly line at can nevertheless be seen, superimposed onto the attenuated continuum (Fig. 5).
| N | Ident. | |||||
|---|---|---|---|---|---|---|
| 1 | 1645.63 | 3.0 | 1.77 | 972.54 | Ly | 0.6921 |
| 2 | 1679.80 | 0.90 | 0.55 | 1025.72 | Ly | 0.6377 |
| 3 | 1711.37 | 0.82 | 0.58 | 1215.67 | Ly | 0.4078 |
| 4 | 1735.96 | 7.86 | 4.65 | 1025.72 | Ly | 0.6924 |
| 5 | 1753.86 | 0.28 | 0.16 | 1036.34 | C ii | 0.6924 |
| 6 | 1781.06 | 0.80 | 0.46 | 1025.72 | Ly | 0.7364a |
| 7 | 1799.72 | 1.01 | 0.68 | 1215.67 | Ly | 0.4804 |
| 8 | 1813.43 | 0.93 | 0.62 | 1215.67 | Ly | 0.4917 |
| 9 | 1903.44 | 0.40 | 0.26 | 1215.67 | Ly | 0.5658 |
| 10 | 1911.47 | 0.86 | 0.55 | 1215.67 | Ly | 0.5724 |
| 11 | 1990.53 | 1.45 | 0.88 | 1215.67 | Ly | 0.6374 |
| 12 | 2055.83 | 51.9 | 30.7 | 1215.67 | Ly | 0.6921 |
| 13 | 2111.73 | 1.03 | 0.59 | 1215.67 | Ly | 0.7371 |
| 14 | 2133.00 | 0.79 | 0.47 | 1260.42 | Si ii | 0.6923b |
| 15 | 2143.86 | 0.30 | 0.17 | 1215.67 | Ly | 0.7635 |
| 16 | 2149.72 | 0.83 | 0.47 | 1215.67 | Ly | 0.7683 |
| 17 | 2152.64 | 0.34 | 0.19 | 1215.67 | Ly | 0.7707 |
| 18 | 2179.61 | 0.28 | 0.16 | 1215.67 | Ly | 0.7929 |
| 19 | 2183.11 | 0.52 | 0.29 | 1215.67 | Ly | 0.7958 |
| 20 | 2203.60 | 0.28 | 0.16 | 1302.17 | O i | 0.6923 |
| 21 | 2207.59 | 0.24 | 0.14 | 1304.37 | Si ii | 0.6925 |
| 22 | 2224.00 | 0.24 | 0.14 | 1215.67 | Ly | 0.8294 |
| 23 | 2583.78 | 0.29 | 0.15 | 1526.71 | Si ii | 0.6924 |
| 24 | 2587.32 | 0.27 | 0.27 | 2586.65 | Fe ii | 0.0003 |
| 25 | 2600.13 | 0.41 | 0.41 | 2600.17 | Fe ii | 0.0000 |
| 26 | 2620.53 | 0.28 | 0.17 | 1548.19 | C iv | 0.6926 |
| 27 | 2722.13 | 0.24 | 0.14 | 1608.45 | Fe ii | 0.6924 |
| 28 | 2796.39 | 0.98 | 0.98 | 2796.35 | Mg ii | 0.0000 |
| 29 | 2803.51 | 1.62 | 1.62 | 2803.53 | Mg ii | 0.0000 |
| 30 | 2852.99 | 0.24 | 0.24 | 2852.96 | Mg i | 0.0000 |
a blend
b also S ii1259
3.6 3C 286
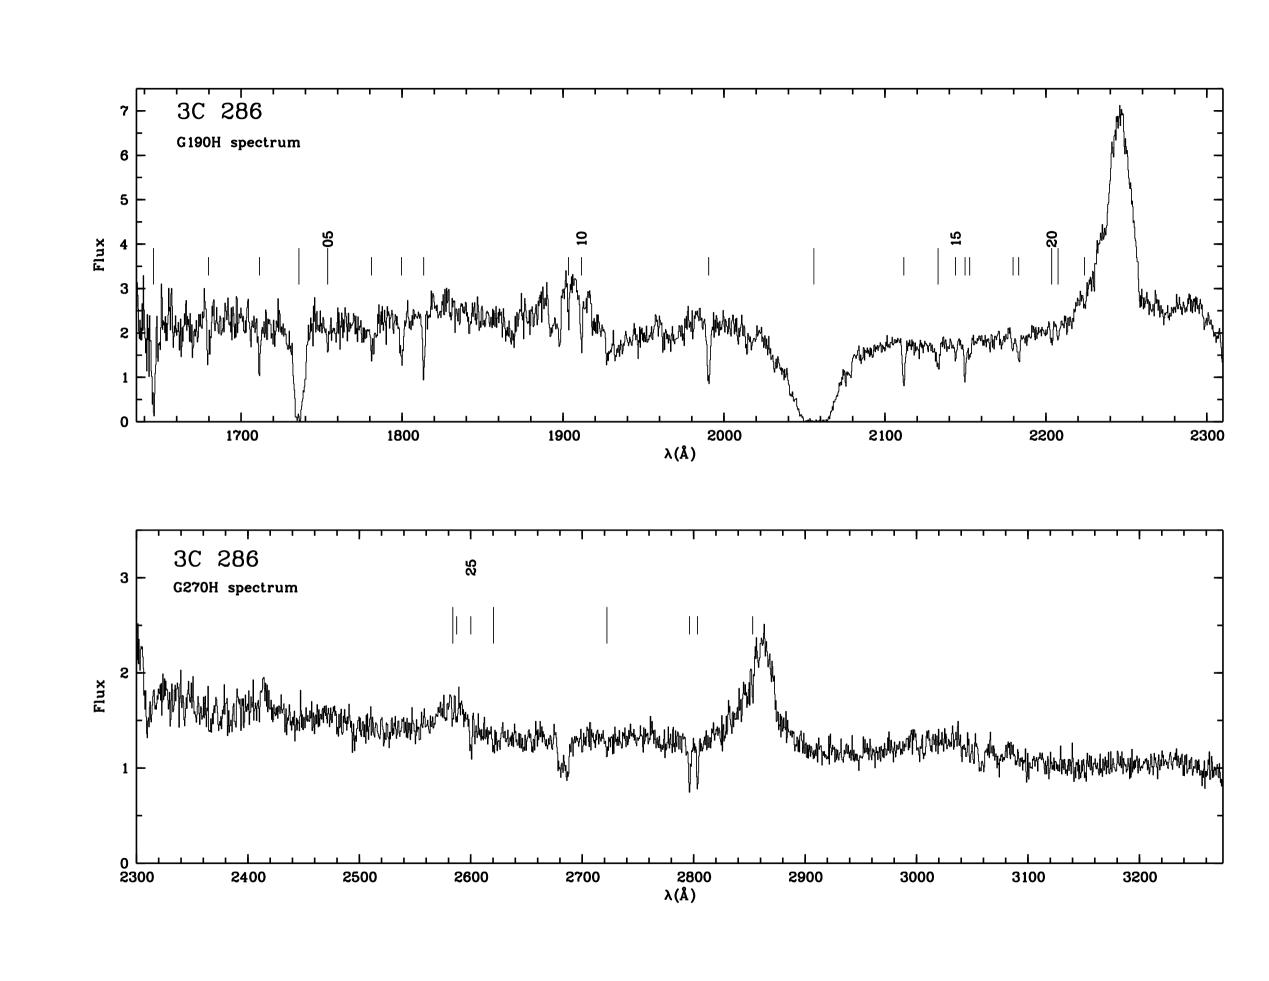
We do not detect any additional narrow metal system in the new FOS spectrum (Fig. 6), which makes the line identification much easier for this QSO than for the other ones observed at high resolution. The profiles of the O vi, N v and to a lesser extent, of the Ly and C iv emission lines suggest the presence of broad absorption from highly ionized gas at . In particular, two sharp edges are seen near 1925 and 2310 Å which, when attributed to the O vi and N v doublets, correspond to about the same redshift, , that is an infall velocity of 2700 km s-1 relative to the QSO. From the DLAS, we detect several new (mostly low-ionization) species in addition to those - Fe ii, Mg ii, Mg i, Zn ii, Cr ii and Ca ii - already seen by Meyer & York (1992) and Cohen et al. (1994). Given the strength of the Ly line, the C iv doublet is remarkably weak; the second (1551 Å) doublet line can barely be seen. C ii1335 lies just at the red end of the Ly emission line and its equivalent width strongly depends on the adopted shape for the adjacent continuum (Å in the normalized spectrum presented in Fig. 17). Weak N i1200 and Si iii1206 absorption can also be seen in the blue wing of the damped Ly line but their significance is difficult to assess quantitatively. Doublets from O vi, N v and Si iv are not detected, with good upper limits.
4 The properties of intermediate redshift damped Ly systems
4.1 H i column density and metal abundances
In the following, we discuss the determination of and metal abundances
for each DLAS. Regarding metal lines, the type of data presented here are not
appropriate to
decide whether they are optically thin or not. We then rely on the velocity
distribution
inferred from high resolution optical spectra (for species with a similar ionization
level), when
available. In order to get measurements or limits for several metals
from a given system, we use as much as possible already published optical
spectra. A curve of
growth analysis is performed in cases where no optically thin line has been
detected.
For consistency with
previous studies, we adopt the values given by Morton (1991) and follow the
revisions proposed by Tripp et al. (1996). Abundances are expressed in terms of
where represents
Solar abundances taken from Anders & Grevesse (1989).
In order to improve our ability to measure the abundance of minor elements, we
adapt
the stacking technique already used to search for specific features within a
whole
class of absorption systems (e.g. C iv lines from Ly forest systems: Lu
1991).
Some elements like Ni ii display several transitions in the same wavelength
range
with comparable values and which are likely optically thin. It turns out
that in the FOS
spectra presented in this paper, the resolution and S/N achieved are such that
these
lines are occasionally seen individually but at a marginal significance level.
We then extract a portion of the spectrum centered on the position where each
such
line from a given ion is expected and apply appropriate shifts so as to bring
the various features
at the same wavelength (the shifts are computed a priori, from the absorption
redshift
and rest wavelengths of the transitions). The individual spectra associated with
each line
are then averaged. In the optically thin limit, the column density can be
obtained
from the formula
where , and denotes the oscillator strength, rest equivalent width and wavelength (in Å) of the transitions considered (note that in the averaged spectrum, the ”composite line” is characterized by an equivalent width where is the number of lines). For undetected lines, all the quoted upper limits are values.
4.1.1 EX 0302223
The estimate of in this DLAS is complicated by the presence of the QSO O vi/Ly emission line, just redward of the damped Ly line at . Thus, before fitting the latter, the continuum has been defined in a way that leaves a reasonably symmetrical Ly absorption line profile. We get , where the quoted error is dominated by the uncertainty in the definition of the continuum level and by the possible presence of blended Ly forest lines (see Fig. 7). Our result is compatible with an independent estimate based on the same spectrum performed by Pettini & Bowen (1997); these authors have measured the Zn ii and Cr ii column densities and derived [Zn/H] and [Cr/H] .
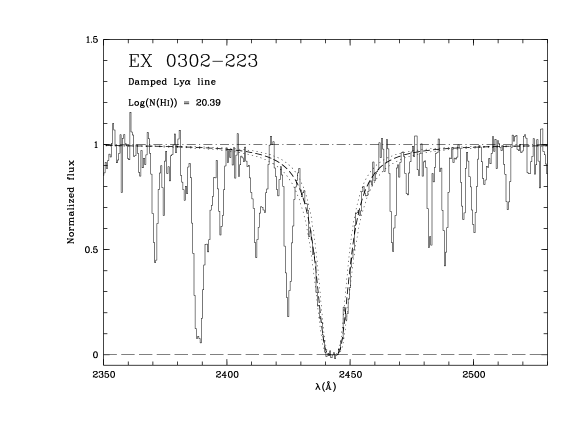
In their high resolution spectra, Petitjean & Bergeron (1990) have detected substructure in the Fe ii (2586 and 2600 Å), Mg ii and Mg i lines and determine . The HST spectrum provides measurements for the 1144 and 1608 Å Fe ii lines. Since in the high resolution data N(Fe ii) is dominated by one single component, a curve of growth analysis is appropriate. The equivalent width of the 1144 and 1608 Å lines appear to be well consistent with each other (both transitions have comparable values); when all four lines are considered, no unambiguous solution can be obtained and only a lower limit to the Fe ii column density can be inferred from the data, cm-2 (i.e. ; a better fit is obtained with in the range 14.6 – 14.8 but the 1144 and 1608 Å line measurements are not accurate enough to provide a reliable upper limit). We adopt the latter value in the following although it is larger than that given by Petitjean & Bergeron (1990): their results are based on the saturated 2586 and 2600 Å Fe ii lines and are therefore subject to large uncertainties (e.g. related to the unknown exact zero intensity level). We then infer [Fe/H] . In the HST spectrum, Ni ii1317 and 1370 are marginally present ( detection) with Å; the corresponding upper limit is [Ni/H] (the stacking procedure is useless in this case since the portions of the spectra involved are crowded). Similarly, from the non detection of Mn ii by Petitjean & Bergeron (1990), one gets [Mn/H]. Several lines from Si ii are present but unfortunately, all have comparable and large oscillator strength values and cannot be used to reliably determine .
4.1.2 PKS 0454+039
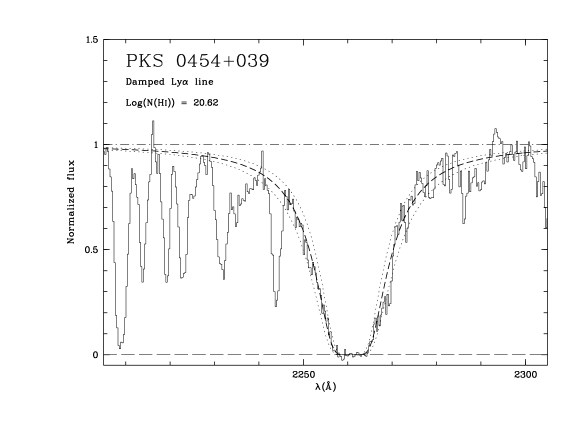
When fitting the damped Ly profile (Fig. 8), we have excluded a narrow feature near 2268 Å (presumably a Lyonly line) which induces some asymmetry. We then get , a value slightly smaller than that obtained by Steidel et al. (1995), . The difference is likely to arise from our exclusion of the 2268 Å feature; the latter tends to broaden the profile and is less visible on the lower S/N spectrum analyzed by Steidel et al. (1995). These values are compatible given the formal errors quoted above (which, moreover, do not include the uncertainty in positioning the continuum). Steidel et al. (1995) observed several weak transitions from Fe ii, Zn ii and Cr ii from which they determine the abundance of these three elements. Lu et al. (1996) present high resolution and high S/N data on various lines from this system. Several components are detected, spread over 160 km s-1; the major one has a width (FWHM) of about 30 km s-1. Lu et al. (1996) confirm that the 2249 and 2260 Å Fe ii lines used by Steidel et al. (1995) are optically thin.
Lines from Ni ii at 1710, 1742 and 1752 Å are found to be marginally present in our spectrum and since they lie in reasonably clean parts of the spectrum, we use the stacking technique discussed above. As can be seen in Fig. 9, a feature is present at 3146.0 Å, the expected wavelength of Ni ii1742 at 0.8596 with 0.18 0.06 Å.
This leads to a column density, , and a relative abundance [Ni/H] . The same procedure cannot be used in the more crowded region where Ni ii1317 and 1370 are expected; nevertheless, we check that these two features are individually marginally present (at about a level) with a strength compatible with the previous estimate. For Mn ii, Lu et al. (1996) get [Mn/H] 1.36.
4.1.3 3C 196
As mentioned above, the damped Ly line at 0.437 coincides with a Lyman edge and, in such a circumstance, the low resolution data available poorly constrains . To better assess how far the value already inferred by Cohen et al. (1996) depends on assumptions underlying the fitting procedure, we obtain an independent estimate of based on our new spectrum. In the latter, the damped Ly line goes down to zero at its center and there is no need to correct for the presence of scattered light. Our approach has been to introduce the minimum number of parameters. Three at least are required: the and values for H i at and at (given the large expected, the Ly profile is not expected to depend on the velocity distribution). We do not attempt to fit the Ly line at since Cohen et al. have shown that this requires the introduction of an additional parameter - the fraction of the broad line region covered by the absorbing gas (which has to be less than 1); the relative contribution of emission lines shortward of Å is expected to be small, so is no longer relevant. The strength of Ly, Ly, Ly and of the Lyman discontinuity can be used to constrain and at 0.871. We compute synthetic spectra for various (, ) values, degrade them to the resolution of the G160L spectra and compare them to the data.
We find that and km s-1 roughly account for the strength of Ly, Ly, Ly and for the possibly non-zero flux seen shortward of 1700 Å (note that the Cohen et al.’s spectrum also suggests a similar non-zero flux level, although the poor S/N ratio does not allow to be conclusive on this point). In attempting to fit the observed spectrum, we find that the match is not quite so good for the wavelengths of Ly and Ly; since this is not the case for the Cohen et al.’s spectrum, we believe that this problem arises from a lower S/N ratio or from distortions in the wavelength calibration and, to improve the fit, we allow slight wavelength shifts for these features. This solution is certainly not unique (higher and lower are also acceptable given the uncertainty in the flux level shortward of 1700 Å; one must also keep in mind that a single Gaussian may be a crude approximation of the real velocity distribution); however, this is not critical since any choice within the acceptable range of values gives about the same shape for the edge when seen at our resolution. We then compute profiles for the Ly line at 0.437, multiply these by the synthetic Lyman edge profile and compare the result to the data. We thus estimate (the corresponding fits are displayed in Fig. 10).
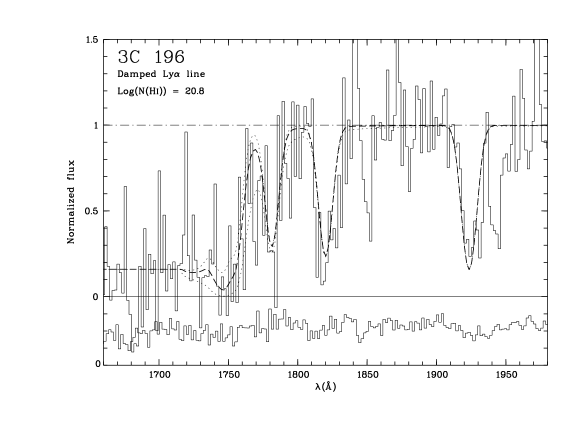
This is notably larger than the value of 20.2 derived by Cohen et al. (1996). As we understand it, the difference comes from two reasons. Firstly, the two spectra show departures which, although relatively small, have large effects on the results. In the earlier spectrum, the damped Ly line is less deep and an intensity peak is present just shortward of it (near 1740 Å) while this is much less clear in the latest data (this may be due to different line spread functions: a detailed comparison of the two spectra indicates that indeed, the latest has a significantly higher resolution). Secondly, in both spectra, the continuum is seen to fall off just shortward of 1805 Å, which cannot be due to the Lyman edge (the latter depresses the continuum only at Å). In their (low ) solution, Cohen et al. gives a large weight to metal lines at (S vi 933-944) and (N v 1238-1242) which induce the strong extra absorption required around 1766 and 1800 Å. In our solution, this is naturally produced by the red wing of the damped Ly line itself. We find the large solution more realistic because we doubt S vi at 0.871 and N v at 0.437 can be as strong as required (note e.g. that the Si iv doublet at 0.437 is not detected). Further, it appears unlikely that the strength of these lines be precisely such that their cumulative effect produces the observed coherent fall off. However, although we favor a value above 20.5, we admit that the value cannot be unambiguously determined with the present spectra; only higher resolution data could allow to better model the Lyman edge at 0.871, assess the role of metal and Ly forest lines and determine the true profile of the damped Ly line around its core which really constrains .
Regarding metals, Foltz et al. (1988) have detected in the optical Mg ii and Fe ii lines but the degree of saturation of the latter is such that they are useless for abundance estimates. One can nevertheless get an upper limit on the Fe ii abundance from the non-detection of Fe ii2367. With and a 3 upper limit on of 0.33 Å, we get [Fe/H] . The weak features from Mn ii and Ca ii are well resolved in the Foltz et al.’s spectrum (line widths exceed 100 km s-1) and are therefore likely to be optically thin. In this limit, we get from the intermediate strength 2595 Å transition, thus [Mn/H] (the two other Mn ii transitions give consistent results; we also checked that the measurements performed by Aldcroft et al. (1994), although less accurate, are in acceptable agreement with those of Foltz et al. 1988). Similarly, from the Ca ii K line, we get .
4.1.4 Q 1209+107
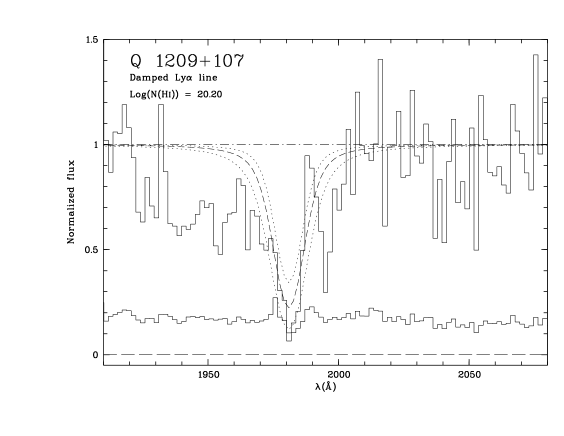
Despite the low resolution and S/N, the spectrum constrains well the H i column density at and an acceptable fit to the Ly profile is obtained for (Fig. 11). Acceptable fits can also be obtained by simultaneously decreasing N(H i) and increasing b; however, such solutions are ruled out by the profile of the Lyman edge (Boissé et al. 1998). To our knowledge, the only metal lines from which an abundance can be derived for this system are those of Fe ii (Young et al. 1982). From a curve of growth analysis applied to five transitions, we get , thus [Fe/H] . Although no high resolution spectrum is available for Q 1209+107, we believe that this determination is approximately correct because the line strengths clearly indicate that Fe ii2374 lies close to the linear part of the curve of growth (assuming this line to be thin yields the strict lower limit ). Young et al. (1982) do not detect the Mn ii triplet; we have used their values to derive the limit .
4.1.5 PKS 1229021
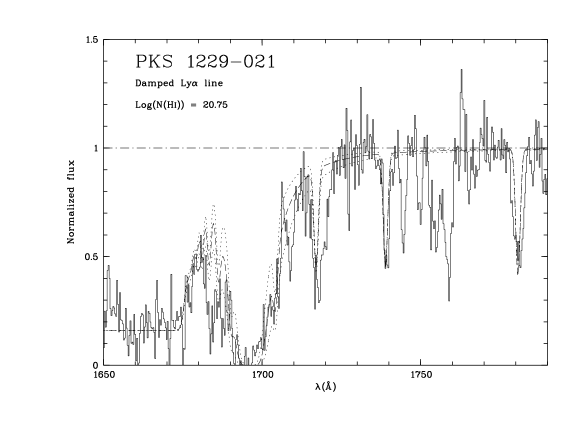
As in 3C 196, the determination of is complicated by the presence of an abrupt decrease of the continuum flux near the position of the expected damped Ly line due to a Lyman edge from the system. However, the situation is more favorable than for 3C 196 because the spectral resolution is higher. We proceed as above and compute the profile for both the Lyman series/edge at 0.831 and the damped Ly at 0.3950. After assigning a zero intensity level to the core of the damped Ly (which requires a 7% correction; this is the only case for which the offset is negative), it is apparent that the Lyman edge is not completely opaque. On the normalized spectrum, the level attained shortward of 1670 Å is 0.17 from which we derive . We then attempt to reproduce Ly, Ly, … lines from this system by varying : a single component does not provide a good fit to the data, the observed lines being slightly too broad for their depth (the fit for km s-1 is shown in Fig. 12). However, given the small velocity range involved, we have not attempted multi-component fits because this would not affect the edge profile. In the HST spectrum, the fall off of the intensity begins at Å: this is too large to be assigned to the edge but rather corresponds to the red wing of the damped Ly. In fact, at our resolution, the red half of the damped Ly line is nearly unaffected by the Lyman edge which is favorable for the determination of . After successive trials, we get .
PKS 1229021 has been observed at high spectral resolution by Lanzetta & Bowen (1992). The velocity distribution appears complex and includes narrow components spanning over 200 km s-1. In the FOS spectra, several lines that could be used for metal abundance measurements are expected. From Si ii, only Si ii1808 and Si ii1526 are of interest, other transitions being heavily blended. Assuming Si ii1808 to be optically thin, we get , which is to be considered as a lower limit. Including Si ii1808 and Si ii1526 in a curve of growth analysis suggests that the former line is nearly thin and leads to km s-1, a value roughly consistent with the profile observed for unsaturated lines by Lanzetta & Bowen (1992) and . However, since this estimate may be affected by the presence of saturated narrow components in the Si ii1526 line, we adopt for [Si/H] the thin limit, [Si/H] 0.76.
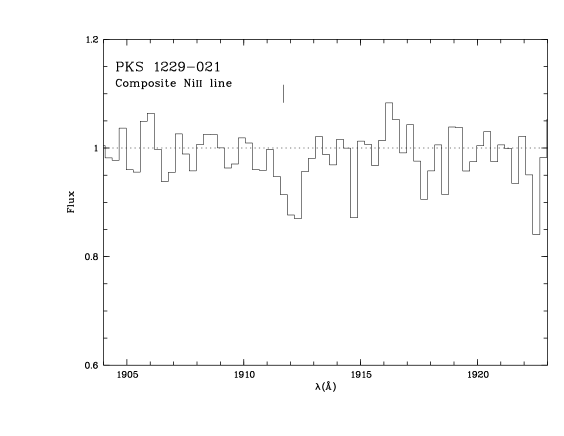
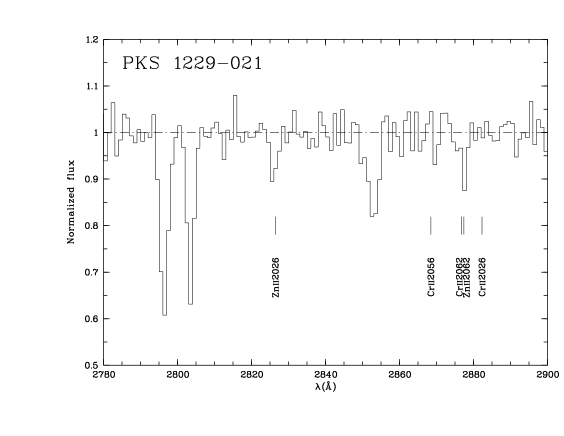
Lanzetta & Bowen (1992) observed the two Fe ii2586 and Fe ii2600 lines. Since the latter are strongly saturated, their estimate of heavily depends on the assumed velocity distribution (sum of discrete Gaussian components) and within this assumption, on the number of subcomponents introduced (in such a case, the approach developed by Levshakov & Kegel 1997 to infer column densities may be interesting to consider). Indeed, their would lead to an unrealistically large Fe relative abundance and is in contradiction with the non-detection in our spectrum of Fe ii2249 and 2260. By stacking the (assumed optically thin) two latter features, we get the upper limit . The corresponding relative abundance is [Fe/H] . We also stacked the Ni ii 1317, 1370 and 1454 Å lines (the Ni ii lines above 1700 Å fall near strong features and cannot be used) and the Cr ii 2056 and 2066 Å lines. Ni ii is clearly detected (Fig. 13) with Å, which corresponds to and [Ni/H] . On the other hand, Cr ii is not present; we get a 3 upper limit Å for the composite line which corresponds to or [Cr/H] . Shallow features are seen at the expected position of Zn ii2026 and 2062 with 0.06 Å and 0.09 Å respectively (Fig. 14). Using the first measurement which is both more accurate and uncontaminated by absorption from other species (Mg i2026 is not expected to contribute significantly contrary to Cr ii2062), we get and [Zn/H] .
From unsaturated Mn ii lines, Lanzetta & Bowen (1992) derive (sum of all subcomponents) which corresponds to [Mn/H] (since the three lines used are nearly thin over most of the profile, this estimate is not subject to the large uncertainties previously mentioned for Fe ii; the thin limit yields , 13.0 and 13.3 for Mn ii2576, 2594 and 2606 respectively). Ca ii H and K lines have been detected at 2 Å resolution by Steidel et al. (1994a). These lines are also seen in an unpublished higher resolution spectrum (0.35 Å FWHM) that P. Petitjean kindly made available to us, with two components at and 0.39516. Equivalent width values from these two spectra are in good agreement, and from the average of Ca ii3934 (0.27 Å), we get .
4.1.6 3C 286
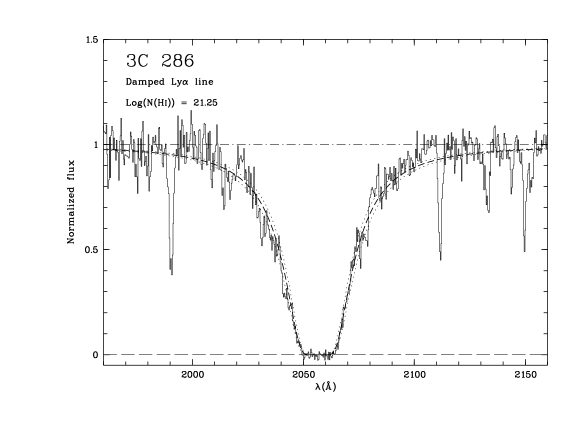
The normalization of the spectrum near the damped Ly line is uncertain due to the presence of adjacent emission lines. Therefore, when fitting the profile, we give much weight to the core of the line and get which is in good agreement with the value derived by Cohen et al. (1994) from G160L data (Fig 15).
The DLAS in 3C 286 might seem to be a good case for abundance determinations since the velocity distribution comprises one single component with km s-1, a value which is consistent with both 21 cm and Fe ii data (see Meyer & York 1992). However, such a low value implies high line opacities, even with abundances as low as 1/100 Solar. As a result, many of the new lines detected here all lie well beyond the linear part of the curve of growth despite their weakness. Since we have some a priori information on the velocity distribution we nevertheless attempt to derive N(Si ii) using the few transitions for which reliable measurements could be made (Si ii1260, 1304 and to a lesser extent, Si ii1526). A single Gaussian component with km s-1 is clearly inconsistent with the data. Si ii1260 and 1304 could be accounted for if km s-1 and but such a large difference between and appears unlikely. Further, the corresponding relative Si abundance would be extremely low (). It seems also that for any velocity distribution, Si ii1190 (which is barely seen) and especially Si ii1193 (undetected) should be notably stronger than observed, as compared to Si ii1260 or 1304; we may therefore suspect that one of the latter is affected by blending with a Lyonly feature and conclude that the present data do not allow to estimate N(Si ii) properly. S ii1259 is clearly present on the blue wing of Si ii1260 but higher resolution data would be needed to extract .
Constraints on can be derived from the absence of Mn ii2576 in the spectrum obtained by Cohen et al. (1994). With , one gets in the thin (i.e. large b) limit; adopting km s-1 instead yields a limit of 12.59 indicating that saturation effects might be not negligible in this case. We therefore adopt the latter value which implies [Mn/H] . Regarding Fe ii, our measurement of Fe ii1608 appears fully consistent with the curve of growth analysis given by Meyer & York (1992) who derive . The latter authors also give the abundance of Ca ii, . Finally, the tighter constraint that we can get on comes from our non-detection of Ni ii1317, which is expected on the blue side of the Ly QSO emission line where the noise level is low. The limit on is 0.080 Å; the thin limit cannot be used in this case and adopting km s-1, we find (instead of 13.55 in the thin limit) or [Ni/H] .
4.2 Temperature of the 21 cm absorbing gas
When both Ly and 21 cm absorptions are detected, useful constraints can be derived on the spin temperature of the gas, . The absorbers toward PKS 0454+039 and 3C 286 have been already discussed by Steidel et al. (1995) and Cohen et al. (1994). In the former, 21 cm absorption has not been detected by Briggs & Wolfe (1983) and therefore, only a lower limit on could be inferred, K (Steidel et al. 1995). The high resolution optical data recently obtained by Lu et al. (1996) can be used to get an even tighter constraint. Indeed, they find that the value for the main component is about 20 km s-1 (see e.g. the unsaturated Mn ii lines). The parameter relevant to the 21 cm absorbing H i cannot be larger which implies K adopting a single temperature model. Using a similar assumption, Cohen et al. (1994) infer K for the DLAS in 3C 286. Our result on at in 3C 196 cannot be used to constrain for that absorber because the radio source is essentially extended (and then probes lines of sight distinct from the optical one).
In PKS 1229021, the situation is more favorable since a significant fraction of the flux at about 1 GHz (the frequency of the redshifted 21 cm line is 1018 MHz) originates from a compact component coincident with the optical quasar (see radio maps published by Kronberg et al. 1992). Following Brown & Spencer (1979) we assume that 50% of the 1GHz flux is emitted by the compact component and that the latter is completely covered by the absorber (this corresponds to a size larger than 30pc). We then derive = 170K. Part of the extended emission could also be covered by the 0.3950 absorber which would result in an increase of . However, such an effect is unlikely to significantly affect the previous estimate because i) the 21 cm line is narrow (FWHM km s-1) which suggests that the size of the absorbing region is much smaller than that of a whole galaxy and ii) the absorber candidate (object #3 in Fig. 12 of paper I) does not cover the extended emission regions. On the opposite, part of the H i inducing the Ly absorption could be at relatively high temperature (e.g. 1000K) and would then be inefficient in producing 21 cm absorption, which would imply an even lower value for the rest of the gas (see the discussion by Wolfe et al. 1985). For instance, if 75% of the gas is at a temperature higher than 1000K, the remaining 25% has to be at less than 49K. We can therefore confidently conclude that, contrary to the DLAS in PKS 0454+039 and 3C 286 (see also Briggs & Wolfe 1983), a significant fraction of the absorbing gas is at a low temperature, typical of H i clouds in the Galactic disk.
4.3 Neutral carbon
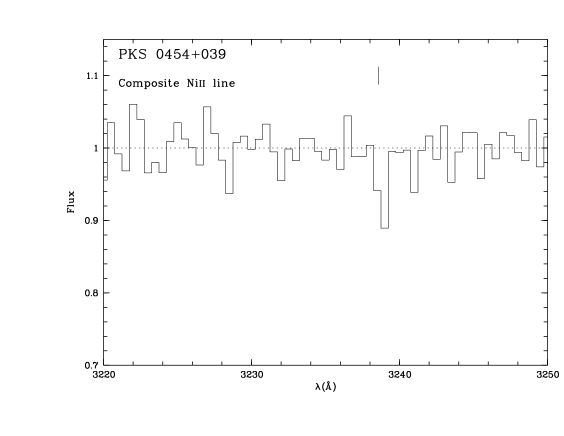
If physical conditions in the gas associated with the DLAS studied here were similar to those prevailing in the interstellar medium of our own Galaxy, neutral species should be present in detectable amounts. C i especially can be searched for through its strong 1277, 1328, 1560 or 1656 Å transitions. The latter have been detected in some high redshift DLAS (see e.g Blades et al. 1982; Ge et al. 1997) but, in several cases, stringent upper limits have been obtained (Meyer & Roth 1990; Black et al. 1987). In order to investigate the presence of neutral gas, we made a specific search for C i lines. For EX 0302223 and PKS 1229021, no useful constraint could be obtained because the features are expected in regions where either there are strong lines or is too large. On the opposite, C i1560 in PKS 0454+039 and C i1328 in 3C 286 are expected right onto one of the QSO emission line (N v and Ly respectively) where the spectra are locally of excellent quality. In PKS 0454+039, we do see a weak line at 2901.55 Å () with Å (Fig. 16).
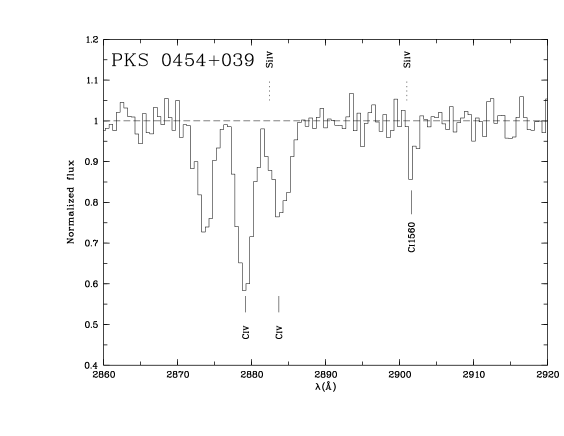
An alternative identification could be Si iv1402 (at ) from the weak metal system. Unfortunately, Si iv1393 coincides with C iv from the DLAS and cannot be used to estimate the strength of Si iv1402. The wavelength match strongly favors an identification with C i1560 and we consider the latter as likely; higher resolution data are needed to definitely establish the correct identification and the presence of C i. Similarly, in the G190H spectrum of 3C 286, there is a feature at 2248.87 Å () with 0.022 Å (Fig. 17). We consider the identification as certain because the line is also seen in the G270H spectrum (although with a lower S/N) and because the wavelength match is excellent.
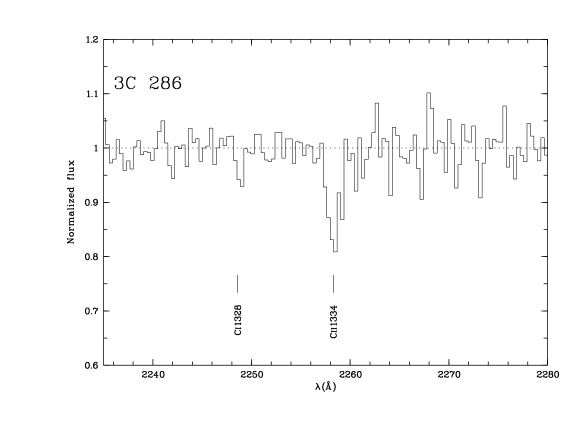
Assuming these lines to be optically thin we get and cm-2 for PKS 0454+039 and 3C 286 respectively. In the second case, the quoted value is a lower limit because of possible saturation effects (we get cm-2 assuming instead km s-1).
In order to compare the physical conditions in these absorbers to those in our Galaxy we consider the plot given by Jenkins & Shaya (1979). The DLAS in PKS 0454+039 appears close to that in Q 0013004 (Ge & Bechtold 1997) and to Galactic gas. On the other hand, the DLAS in 3C 286 is more like that in MC 1331+170 (Chaffee et al. 1988) and PHL 957 (Black et al. 1987), i.e. significantly deficient in C i with respect to Galactic gas. However, given the low metal abundance seen in the absorber toward 3C 286, the inferred C i/H i ratio suggests that physical conditions in the absorbers are relatively similar to those in our Galaxy and therefore, that there is enough dust to provide the required shielding from UV photons with energy higher than 11.26 eV.
4.4 Dust grains
Up to now, the evidence for dust associated with DLAS has been mostly statistical in nature, QSOs with DLAS showing in average steeper spectra than QSOs devoid of strong systems (Pei et al. 1991). The overall pattern of metal abundances also strongly suggests that selective depletion onto dust grains is effective in the absorbers (Pettini et al. 1997b; Kulkarni et al. 1997) although the interpretation of these data is still controversial (Lu et al. 1996; Prochaska & Wolfe 1996). The 2175 Å feature would be a less ambiguous signature and can be searched for in specific QSOs with DLAS. However, no clear detection has been obtained in any individual QSO (see e.g. Boissé & Bergeron 1988); this is generally taken as evidence for SMC or LMC-type extinction curves which display a less prominent feature. Recently, Malhotra (1997) found evidence for this feature in a composite spectrum of QSOs with Mg ii absorption.
Regarding our targets, the 2175 Å feature could be seen in PKS 0454+039 between the C iv and C iii QSO emission lines (near 4020 Å) in the excellent flux-calibrated spectrum obtained by Steidel & Sargent (1992). A shallow depression is present centered about 40 Å blueward of the expected position and with a full width of about 200 Å. Comparison with the composite spectrum computed by Zheng et al. (1997) reveals that this feature is most likely intrinsic to the QSO. In PKS 1229021, it is expected at 3030 Å near the end of our G270H spectrum: no broad depression with an amplitude larger than 10% is seen over a 300 Å width interval. Finally, in 3C 286, some break is seen near 3680 Å in the flux-calibrated spectrum presented by Aldcroft et al. (1994) which could be accounted for by a redshifted 2175 Å feature with a depth of 15 to 20%. The bluest part of the spectrum is noisy and probably affected by intrinsic broad absorption; thus, the reality of that feature is difficult to assess. The spectral index measured for PKS 1229021 and 3C 286 between the Ly and C iv emission lines are 0.9 and 0.8 respectively which suggests little reddening. In the former, some bending is seen shortward of the O vi emission line but again, comparison with the composite spectrum of Zheng et al. (1997) indicates an intrinsic origin.
4.5 H2 molecules
H2 and CO molecules have been searched for in the spectrum of QSOs with high redshift DLAS (see e.g. Black et al. 1987; Lanzetta et al. 1989). H2 has been detected in two cases only: at in PKS 0528250 (Foltz et al. 1988) and recently at in Q 0013004 (Ge & Bechtold 1997). The former system is peculiar as it is at , so the latter case is the only clear detection of H2 from gas which is likely to be disk material. Aside from these two positive cases, low upper limits have been inferred for f, the fractional abundance of H2 molecules (typically - ; Black et al. 1987). One major difficulty encountered in these studies is that H2 lines are expected in the dense Ly forest where they can hardly be distinguished from Lyonly features. At lower redshift, the Ly forest becomes less crowded and the situation is more favorable.
Among the four QSOs from our sample for which G190H or G270H spectra are available, three - EX 0302223, PKS 0454+039 and 3C 286 - could display H2 features (all the strong ones occur at Å). As emphasized by Black et al. (1987), anticoincidences are most significant and, in the spectrum of the three QSOs mentioned above, we have searched for windows which look free of any significant absorption and where strong H2 lines are expected (Morton & Dinerstein 1976; Foltz et al. 1988). Such regions can indeed be found (e.g. around 2035 Å in PKS 0454+039 or around 1757 Å and 1852 Å in 3C 286: see Fig. 2 in Boissé et al. 1998) which indicates that, at our detection limit, H2 is not present. The 3 upper limit on for unresolved H2 lines in the three QSOs is about 0.15 - 0.20 Å. Unfortunately, this value cannot be translated easily into a limit on because the excitation temperature and parameter are unknown. We can nevertheless obtain an upper limit by comparing the data to synthetic spectra computed by e.g. Foltz et al. (1988) and Lanzetta et al. (1989). For - km s-1 and in the range 100 - 1000 K, cm-2 appears as a conservative upper limit on . Such a column density implies an upper limit on of , and for EX 0302223, PKS 0454+039 and 3C 286 respectively.
4.6 Associated gas of high ionization
Among the four DLAS studied at 1.5 - 2 Å resolution, all have strong C iv - Si iv lines except that in 3C 286 (weak C iv, Si iv undetected). The O vi doublet from the DLAS could have been seen in PKS 0454+039 and 3C 286; it is present in the former absorber only, which displays an extensive range of ionization levels. N v lines are undetected in EX 0302-223, PKS 1229-021 and 3C 286 while they are possibly present in PKS 0454+039, blended with a group of Lyonly lines. We note that in the latter case, the line of sight to the QSO probes the halo of a compact galaxy. The upper limits on for undetected lines are in the range - Å. More data on C iv, N v and O vi absorption lines from low identified absorbers are needed to investigate the relation between the strength of high ionization features and the properties of the intervening galaxies.
5 Other metal-rich and Ly forest absorbers
5.1 The dwarf galaxy near PKS 0454+039
This galaxy, discovered by Steidel et al. (1993) has a redshift , and shows signs of star formation activity. Steidel et al. (1993) found no Ca ii absorption induced by this object in the spectrum of PKS 0454+039 although the impact parameter, kpc, is relatively small. However, Ca ii does not probe efficiently the outer regions of galaxies where Ca is expected to be mostly in the form of Ca iii. In Fig. 18, we display an enlarged portion of the G270H spectrum which shows unambiguously the presence of Mg ii absorption from this dwarf galaxy.
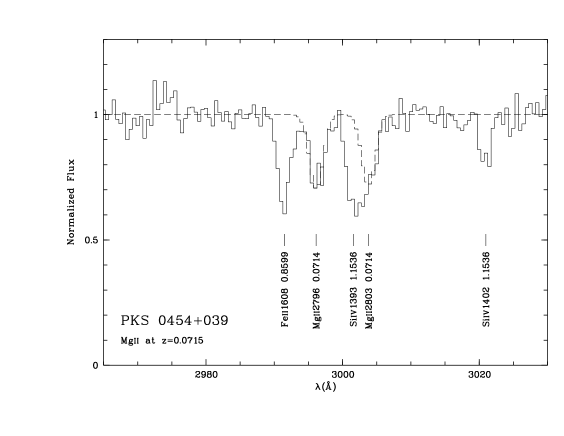
The 2796 Å line appears at , just in between the Fe ii1608 line from the DLAS and the Si iv1396 line at . The latter feature is severely blended with the second Mg ii doublet line. Absorption from the Fe ii2600 line is also definitely present; the other major Fe ii transitions (at 2344 and 2382 Å) are expected where strong lines from other systems occur.
In order to better probe the physical conditions in this absorber we searched
for 21 cm absorption. Observations were performed in absentee at the ARECIBO
radiotelescope by M. Lewis and his collaborators (on the 21st and 22nd of
October 1993). The velocity range covered was 20700 - 22700 km s-1 which
corresponds to a redshift range of 0.0690 - 0.0757; the channel width was
2.2 km s-1. To check the pointing,
a test galaxy was observed and detected. The continuum flux was measured
to be 390.7 mJy (four different calibration sources have been used which gave
concordant results). No significant absorption was detected;
the 3 upper limit is 2.4 mJy. Assuming that the velocity width of the
H i gas in front of the radiosource, , is larger than the channel
width, we get the following upper limit on :
cm-2.
This limit holds for a linear scale of kpc or below since the
radiosource appears unresolved with a beam of 0.35″ (Neff et al. 1989).
Our result indicates that the intervening dwarf galaxy near PKS 0454+039 does
not have a very
extended H i disk which is consistent with H i distributions observed in other
nearby dwarf galaxies (Carignan & Puche 1989; Jobin & Carignan 1989).
On the other hand, the detection of Mg ii and Fe ii absorption shows that, in this class of objects, ionized gas is present well beyond the optical disk. Therefore, a large total mass is not a necessary condition for a galaxy to display an extended ionized gas component, at least when star formation is occurring at a sufficiently high rate, as is the case in this galaxy. It should be noted that the impact parameter of this low redshift dwarf galaxy is 2.5 times smaller than the radius expected from the size - luminosity scaling law measured for brighter metal-rich absorbers (Guillemin & Bergeron 1997; the absolute magnitude is MAB(B)=17.02). This is also the only dwarf galaxy giving rise to Mg ii absorption in the available absorber samples although such objects could have been detected up to redshifts of 0.2 - 0.3 (Steidel et al. 1994b; Guillemin & Bergeron 1997).
5.2 Other cases
Three other galaxies close to the QSO lines of sight studied in this paper have measured redshifts. We have already mentioned the bright spiral near EX 0302223 which gives rise to Mg ii and Fe ii absorption at 0.118. We note that Fe ii2600 is stronger than Mg ii2796 which suggests a large value. On the other hand, the relative strengths of Fe ii lines suggest that Fe ii2374 and Fe ii2586 are nearly optically thin with which rules out a value of above 19 (the latter would correspond to [Fe/H] assuming that most of the Fe is in the form of Fe ii). There is however no contradiction since, as discussed by Bergeron et al. (1994), the strong evolution in redshift of the diffuse UV background implies that, at z , large values of the Fe ii2600/Mg ii2796 equivalent width ratio can be found in systems with - cm-2.
Another dwarf galaxy at low redshift and intermediate impact parameter, zgal = 0.199 and kpc, is present in the field of PKS 1229021 (G2 in Bergeron & Boissé 1991; G4 in Steidel et al. 1994a). In the spectrum of PKS 1229021 several strong lines lie in the region where the C iv doublet is expected; the latter is not detected at a limit of Å for individual lines. The expected Al iii1854 line coincides with another strong absorption feature, but Al iii1862 could have been detected and is not present at a level of 0.15 Å. This suggests that this dwarf galaxy does not have an extended gaseous halo. This is not unexpected from its luminosity, MAB(B)=18.0, since it lies just above the radius - luminosity scaling law of brighter metal-rich absorbers (Guillemin & Bergeron 1997).
A low redshift, z, bright, , galaxy is present in the field of PKS 0454+039 (Steidel et al. 1993). As expected from its large impact parameter, kpc, there is neither associated absorption from Mg ii (Steidel et al. 1993) nor from C iv at a upper limit of Å.
6 Discussion
One first goal of our study was to observe the Ly line from our candidate high systems. All of them turn out to have larger than cm-2, which confirms the validity of the Fe ii/Mg ii criterion used to select some of the systems (in EX 0302223 and Q 1209+107).
6.1 Metal abundances
The metal abundance estimates discussed in Sect. 4.1 have been gathered in Table 6. For all systems, relative abundances are given using our own determination of . The Zn ii and Cr ii column densities given by Meyer & York (1992) and Steidel et al. (1995) have been adjusted according to the values used in this paper (the N(Fe ii) derived by these authors from a curve of growth analysis have been adopted although they rely in part on values for Fe ii2249 and Fe ii2260 which were larger than the revised ones; these N(Fe ii) may then be slightly underestimated, by 0.1 to 0.2 dex). Thus, our abundance estimates can be directly compared to those given by Lu et al. (1996) and Pettini et al. (1997a). The uncertainty is typically 0.1 - 0.2 dex except for 3C 196 and Q 1209+107 which have a less accurate measurement. As is customary, relative abundances have been computed assuming and (Fe), etc (except for Ca which may be partly in the form of Ca iii).
| QSO | Si | Cr | Mn | Fe | Ni | Zn | Ca ii | ||
|---|---|---|---|---|---|---|---|---|---|
| EX 0302223 | 1.0095 | ||||||||
| PKS 0454+039 | 0.8596 | ||||||||
| 3C 196 | 0.4368 | 12.8 | |||||||
| Q 1209+107 | 0.6295 | ||||||||
| PKS 1229021 | 0.3950 | 12.3 | |||||||
| 3C 286 | 0.6922 | 12.5 |
We first compare the pattern of relative abundances observed at high redshift by Lu et al. (1996) (see also Prochaska & Wolfe 1996) and discussed by Pettini et al. (1997b) and Kulkarni et al. (1997) to that of low redshift absorbers. The estimates reported in Table 6 appear in rough agreement with the compilation of [X/Zn] and [X/Fe] values presented by Kulkarni et al. (1997) for high redshift systems. Although covering a broad range, values for [Mn/H] and [Ni/H] are roughly centered on the medians found at higher redshift, [Mn/Zn][Ni/Zn] (Kulkarni et al. 1997), whereas the values (including one upper limit) derived for [Fe/Zn] are all lower than that at higher redshift [Mn/Zn]. Then, to first order, depletion onto dust grains seems to be effective in low redshift absorbers as it is at high redshift (Pettini et al. 1994; Pettini et al. 1997b; Kulkarni et al. 1997); since in our Galaxy Zn is only slightly depleted, we shall follow Pettini et al. (1994) and use [Zn/H] as a metallicity indicator. The [Fe/H] value in PKS 1229021 is atypical in the sense that the upper limit inferred from our data appears very low when compared to [Mn/H] or, to a lesser extent, [Ni/H]. We note that in a recent study, Vladilo et al. (1997) find a [Mn/Fe] ratio of 0.4 in a candidate DLAS while our results on PKS 1229021 imply [Mn/Fe] ; both values appear high when compared to the high z estimates ([Mn/Fe] ). However, given the difficulties quoted above for the measurement of [Fe/H] in the PKS 1229021 DLAS, any conclusion (regarding e.g. the intrinsic nucleosynthetic pattern involved) would be premature and we stress that complementary observations (e.g. of Fe ii2367 or Fe ii2374) would be very valuable.
In the two cases where bright intervening spiral galaxies are present (systems in 3C 196 and Q 1209+107), the available Mn and Fe measurements suggest a relatively high metallicity. Assuming that the abundance of these elements relative to Zn is similar to that at high , one gets estimates for [Zn/H] of 0.2 and 0.6 in 3C 196 and Q 1209+107 respectively. For the former, the value estimated for [Zn/H] could be higher by 0.6 dex if the N(H i) value given by Cohen et al. (1996) had been adopted instead of ours. Similarly, for the latter, [Zn/H] could also be higher by about 0.3 dex as it was derived using [Fe/H] (see above and Table 6). Using the conservative estimates of [Zn/H] given above together with the measurement in PKS 1229021 ([Zn/H] 0.5), we find that the new low absorbers studied in this paper have [Zn/H] . Pettini et al. (1997a) have plotted all available measurements of [Zn/H] as a function of redshift (their Fig. 3). In this diagram, the three values quoted above indicate that systems with higher metallicities are present at lower redshift, as expected from cosmic chemical evolution (Pei & Fall 1995). Pettini et al. (1997a) also present a binned version of this plot (their Fig. 4); in the low redshift bin which includes four systems at , the column density weighted average metallicity is [Zn/H] at . Including our three new estimates yields a higher value, [Zn/H] at . A few other DLAS have been measured recently. In 3C 336, Steidel et al. (1997) find [Fe/H] and cm-2 at . Two more DLAS have also been discovered in the spectra of the bright QSOs HE 11221649 (at ) and HE 05154414 (at ) with values for [Zn/H] of and and for of cm-2 and cm-2 respectively (de la Varga & Reimers 1998). We checked that inclusion of the latter does not modify the above value for [Zn/H] (this is because they involve low H i column densities and because it is appropriate to consider the N(H i) weighted average).
To summarize, we find that extending the sample at lower redshifts brings [Zn/H] somewhat closer to the prediction of a metallicity approaching Solar values as goes to zero (Pei & Fall 1995), and further, that a large scatter is present, as at high redshift. The latter is likely to reflect the large variety of the observed absorber morphologies (paper I) and the spread in impact parameters (Phillips & Edmunds 1996).
6.2 The bias induced by dust and physical conditions in the absorbers
Several authors have considered that the extinction induced by dust within intervening galaxies may affect the statistics of distant QSOs (Ostriker & Heisler 1984; Boissé & Bergeron 1988; Fall & Pei 1993). Fall & Pei (1993) stressed that the same bias also affects the statistics of DLAS themselves, especially of those with the largest and developed a method to correct for these effects. Boissé (1994, 1995) pointed out that, because dust is closely linked to metallicity and to the formation of molecules, extinction probably results in a preferential selection of QSOs with systems displaying a low metallicity and H2 content.
It is noteworthy that the dust obscuration bias is expected to have the strongest effect at z 1, precisely in our range of interest (Fall & Pei 1995; their Fig. 5); this is because metallicity decreases while the extinction per dust grain in the observer’s frame increases (due to the rising extinction law) when going at higher redshift. Indeed, in the present study, we find that the two faintest QSOs (which could not be observed with the HST at a resolution appropriate to detect metal lines) display systems with relatively high metallicities. We also find no very large values (e.g. cm-2) while this could have been expected given the low impact parameters involved (e.g. in 3C 196). As discussed by Boissé (1995), the absence of such systems which would be quite easily recognized in the numerous low resolution optical spectra obtained so far, further supports the reality of a cut-off caused by extinction.
These results alone are only indicative but after the extensive work by Pettini et al. (1994, 1997a) and Lu et al. (1996), there now exists a reasonably large sample of systems with and [Zn/H] measurements (again, since Zn does not deplete onto grains, it is a good indicator of the amount of metals available to form dust) and effects of the extinction bias might become apparent in the data themselves. We then plot [Zn/H] as a function of H i column density, since the latter should determine to first order the strength of the effect (Fig. 19; the system in PKS 0528250 has not been included). We note a very clear deficiency of systems having at the same time a large and a high metallicity (the absence of data points in the bottom left part is just due to observational limitations). The available measurements appear to be distributed in the diagram as if the amount of metals along the line of sight, as estimated from N(Zn), were constrained to be less than about cm-2, which corresponds to the line drawn in Fig. 19. This result is all the more striking as, in an unbiased sample, one would have rather expected the opposite trend since the large values should correspond to the innermost parts of galaxies where the metallicity is presumably higher. To verify that the evolution of [Zn/H] in redshift does not affect our analysis (through a possible variation of with ), we consider separately measurements at (the median of values) and ; no tendency is seen for high systems to cluster at large .
One alternative explanation would involve the opacity of Zn lines; in the upper right part of Fig. 19, N(Zn ii) is large and the optically thin approximation could no longer be valid which would result in an underestimate of [Zn/H].
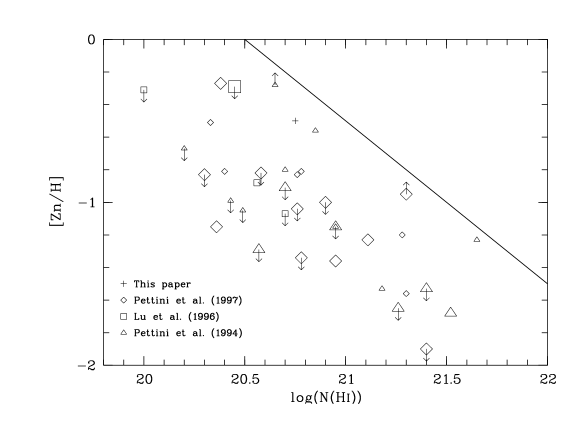
While this may be true in a few cases (two measurements in Fig. 19 are in fact given as lower limits) the high resolution data presented by Lu et al. (1996) indicates that the whole set of [Zn/H] values is unlikely to be affected by saturation effects. We then conclude that dust extinction is effective at inducing a preferential selection of QSOs with systems having a low metal content.
The upper bound on N(Zn) present in Fig. 19 can be interpreted as an upper bound on AV of about 0.3 for Galactic-type material; the latter is assumed to be characterized by [Zn/H] (Sembach et al. 1995) and we have adopted the /AV ratio given by Bohlin et al. (1978). For larger values of AV, significant effects are indeed expected to occur since in the rest frame of the absorber, it is the UV part of the extinction curve that is involved. It is often argued that, given the low dust-to-gas ratio inferred from the observed systems (Pei et al. 1991), the effects of extinction are necessarily small. Indeed, if extinction effects were estimated assuming the average dust-to-gas ratio inferred from the reddening of QSOs with DLAS, one would predict negligible effects in Fig. 19. However, this reasoning does not take into account the properties of the systems that are missed and which are very likely to be those with the largest dust-to-gas ratio. Fall & Pei (1993) precisely pointed out that the (unknown) dispersion in the dust-to-gas ratio is an important limitation in our ability to correct for the effects of this bias. Metal abundances in DLAS (as in nearby galaxies) show a large scatter at any redshift, and similarly large variations can be expected for the dust-to-gas ratio itself, including the possibility that galaxies with dust-to-gas ratio and metallicities even larger than Galactic exist, since we have no reason to believe that the Milky Way is particularly dust and metal rich. Fig. 19 confirms that in the available samples, a selection with respect to absorbing gas properties is present.
A direct consequence of the bias induced by dust extinction is that estimates of , the total amount of gas (see e.g. Wolfe et al. 1995; Storrie-Lombardi et al. 1996), are necessarily highly uncertain. First, the relative contribution to of large systems is important and these are precisely the most heavily biased. Second, H2, which is not taken into account, may represent a non-negligible fraction of the total gas mass. In the local Universe, this fraction is estimated to be in the range 30 - 50 % (Casoli et al. 1997). The evolution in redshift of this quantity is unknown but we already observe that by 1 - 2, galaxies form stars at a high rate which strongly suggests the presence of a large H2 mass. This is also indicated by CO observations of distant galaxies (Solomon et al. 1992; Omont et al. 1996; Alloin et al. 1997) which probably give a lower limit to the true amount of H2 because the CO to H2 conversion factor is likely to be higher due to a lower metallicity. Note however that, to first order, the uncertainty on the H2 amount does not affect the method developed by Fall & Pei (1993) since their estimate of extinctions is based primarily on the column density of metals, which is an observed quantity.
As noted above, the extinction bias is expected to have large effects at . This is also true at because the UV spectroscopic observations required to study these systems are very demanding in terms of QSO brightness. This tends to reduce the evolution of [Zn/H] (which further helps to understand the discrepancy discussed by Pettini et al. 1997a between the observed low bin and model predictions) and might also mimic an evolution of the shape of the distribution, such as that observed by Wolfe et al. (1995).
Since molecules and dust are closely related, the extinction bias is likely to affect the apparent H2 content as well. One point that has been overlooked when discussing absorption line studies is that such methods yield very little information on the densest phases of the interstellar medium where stars form. This is for two reasons. First, the surface coverage factor of the latter is quite small and therefore the probability to intersect intervening material of this type is very low. Second, any background QSO will be strongly dimmed by the associated extinction and will remain undetected or appear too faint for spectroscopic studies; this effect is reinforced by the marked tendency of molecules to assemble in dense opaque clouds, due to self-shielding. For galaxies at 1, we have ample evidence for the presence of dense and dusty molecular clouds like those in our own Galaxy (Wiklind & Combes 1996; Casoli et al. 1996). Nevertheless, when searching for dust and molecules from low systems in QSO spectra, we get essentially the same null result as at higher redshift!
Therefore, one must not draw any definite conclusion from the observed low amount of molecules and lack of clear signatures from dust grains in DLAS. Only the observation of fainter QSOs would lead to a more representative view of the interstellar medium in these distant galaxies (Boissé 1994, 1995). Even if H2 molecules have not been detected in our QSO sample, the likely detection of C i in two systems suggests that physical conditions (radiation field, density, …) are not very different from those in the Solar neighborhood, at least in some absorbers. A similar conclusion is reached by Ge & Bechtold (1997) for gas at .
6.3 Relation between damped absorber morphology and intervening gas properties
The galaxies proposed in paper I as the absorbers have not yet been confirmed
spectroscopically. This will be a difficult task because in ground-based
observations
a large fraction of the QSO light is superimposed onto the galaxy
emission and a redshift can be
measured only if the latter shows prominent spectral signatures. Additional
problems arise from the detection of several metal systems, each of them
implying
the presence of a galaxy close to the QSO line of sight. Since we now have a
detailed census of metal systems in four out of six QSOs from our sample, let us
summarize
the status of the proposed identifications and discuss their reliability:
- EX 0302223: four objects are present at low impact parameter (all
with a
relatively compact morphology). Given its lower impact parameter, galaxy #2 is
the best
candidate. The other three galaxies, of which two are very close and probably
form an interacting system, could give rise to the metal-rich systems at
and 1.3284. The absorber is identified with
a very bright galaxy at large impact parameter (Guillemin & Bergeron 1997).
- PKS 0454+039: there is little ambiguity in this case since only one
object is seen near the QSO. The galaxy is very compact and the QSO line
of sight probes regions which are outside the stellar component.
- 3C 196: the large spiral is very likely to be at 0.437 because its
luminosity would have to be extremely large if it were at 0.87.
This very extended galaxy does not show any [O ii]3727 emission
but the Ca ii absorption doublet has been tentatively identified; in galaxy
# 3, strong emission lines at a redshift close to that of the QSO have been
detected (Drouet d’Aubigny & Bergeron, in preparation). However, the latter
may not be the absorber, since the intervening gas does not cover
the whole broad line region and should thus be very close to the active nucleus
(Cohen et al. 1996),
- Q 1209+107: the proposed identification with galaxy #2 is reliable
because no other candidate is present close to the line of sight.
Furthermore, its color is consistent with a
spiral galaxy at ,
- PKS 1229021: although we could reject objects # 2, #4 and #6 as
potential absorbers since they are associated with knots in the QSO radio jet,
two objects (a compact galaxy, #3, and a low surface brightness galaxy, #5)
could be at 0.3950. Galaxy #3 is favored because of its lower impact
parameter,
- 3C 286: three fairly bright objects (#2a, #2b and #2c) have been
detected at less than 1 arcsec from the QSO line of sight. Al three could
contribute to the DLAS. Alternatively, since #2a and #2b are located roughly
symmetrically to the QSO, they could be part of the QSO’s host galaxy, #2c
being then the absorber.
Some of these identifications could be erroneous if, as in the case of 3C336 (Steidel et al. 1997), none of the galaxies close to the QSO line of sight turned out to be at the DLAS redshift. However, from a statistical point of view, the presence of galaxies at low impact parameter in all the studied cases cannot be due to chance and very likely, most of the proposed identifications are correct.
Among the gas properties that may be connected to absorber morphology let us consider metallicity and kinematics. We already noted that the two cases with intervening spiral galaxies correspond to relatively high metallicities. The low [Zn/H] value measured in 3C 286 in spite of the small impact parameter is consistent with the proposed absorber of fairly low surface brightness. This case may then be similar to the DLAS studied by Steidel et al. (1997): no galaxy could be detected despite an intensive search which suggests a faint object centered on the QSO. The two compact absorbers display intermediate metallicities; these galaxies are reminiscent of the blue nucleated galaxies that appear at 0.5 in galaxy surveys (Schade et al. 1996). The most intriguing case is the DLAS in PKS 1229021: although the amorphous aspect suggests an unevolved object, the Zn and Mn abundances are clearly higher than in the two previous cases, with a possibly unusual abundance pattern.
The absorber in PKS 1229021 is also remarkable for the kinematics of the absorbing gas. The asymmetrical velocity distribution revealed by the data obtained by Lanzetta & Bowen (1992) is the prototype of what Prochaska & Wolfe (1997) consider to be the signature of a massive disk. However, at first sight, such an interpretation of absorption profiles is not supported by the appearance of the damped absorber in HST images as discussed by Pettini et al. (1997a). Recent numerical simulations also confirm (at least for the high DLAS) that the presence of an edge-leading asymmetry is not an unambiguous signature of a rapidly rotating disk (Haehnelt et al. 1997). We also note that in the other case of a proposed low surface brightness galaxy (in 3C 286), the kinematics seems to be very different since all or most of the absorption arises from the single narrow component which induces the 21cm absorption line (Meyer & York, 1992).
Detailed information on the kinematics is also available for the damped Ly system in PKS 0454+039 (Lu et al. 1996). Absorption is spread more or less continuously over 140 km s-1 with four maxima and no characteristic asymmetry. No simple picture emerges from the yet very scarce systems for which the required data are available. A larger sample is necessary to check if the absorption profiles are related to the large-scale kinematics of the intervening galaxy itself (as proposed by Prochaska & Wolfe 1997) or rather are governed by e.g. the recent star formation activity (through supernovae explosions). In the present context, the two systems induced by bright spiral galaxies (in 3C 196 and Q 1209+107) are of much interest and would clearly deserve high resolution spectroscopic observations.
6.4 Perspectives
The results obtained in our study and the above discussion clearly show the need for complementary observations. Obviously, it is very desirable to confirm spectroscopically the candidate absorbers proposed in paper I, especially when several galaxies are present at low impact parameter. Then, it is important to improve the accuracy of some measurements presented in this paper and extend the set of metal elements considered in order to compare in more details the abundance patterns seen at low and high z. In particular, it is important to confirm the high metallicity suggested for the systems caused by intervening spiral galaxies in the spectra of 3C 196 and Q 1209+107. For the two latter cases, the absorber properties are very well characterized by HST images; high resolution optical spectra would provide the velocity distribution of the gas and thus help to establish the phenomena governing the kinematics of the absorbing material.
Moreover, the observed broad range of absorber morphologies and absorbing gas properties indicate that a larger sample is needed to get a correct overall view of the origin of low damped Ly systems. Possibly, some types of absorbers have not yet been detected; the recent study by Lanzetta et al. (1997) shows that early-type galaxies do also contribute to the damped Ly absorber population. Presently, only two or three absorbers of each type have been found and it is not possible to assess the relative contribution of the various classes of galaxies. Observations of several absorbers from the same class, but probed at different impact parameters and inclinations, would be crucial to understand the relation between the absorbing gas and the parent galaxy properties.
Finally, as discussed in Sect. 6.2, we strongly suspect that surveys of damped Ly samples drawn from the observation of fainter QSOs would reveal more systems with large N(H i) and high metallicity, whatever the redshift. However, the most reddened QSOs would not be observable in their UV rest-frame and the intervening gas properties should then be derived from observations at longer wavelengths. Nevertheless, searches for damped Ly absorption in QSOs fainter by two or three magnitudes could reveal absorption systems in which the presence of dust grains and molecules is much more conspicuous than in the systems investigated so far, and thus would allow a more comprehensive study of the evolution of the interstellar medium in galaxies. Spectroscopic surveys of fainter QSOs should then not only enlarge the present samples but also lead to a more representative view of the whole diversity of the damped Ly absorber population.
Acknowledgements.
We are grateful to Chuck Steidel and Patrick Petitjean for allowing us to use some of their data on PKS 1229021, and also to Murray Lewis and his collaborators who observed for us PKS 0454+039 with the ARECIBO radiotelescope. We also wish to thank Mike Fall for insightful comments on an earlier version of this paper and Ross Cohen, Françoise Combes, Max Pettini and Evelyne Roueff for helpful discussions on various aspects of this work.References
- (1) Aldcroft T.L., Bechtold J., Elvis M., 1994, ApJS 93,1
- (2) Alloin D., Guilloteau S., Barvainis et al., 1997, A&A, in press
- (3) Anders E., Grevesse N., 1989, Geochim. Cosmochim. Acta 53, 197
- (4) Bahcall J.N., Bergeron J., Boksenberg A., et al., 1993, ApJS 87, 1
- (5) Bergeron J., Boissé P., 1991, A&A 243, 344
- (6) Bergeron J., Petitjean P., Sargent W.L.W., et al., 1994, ApJ 436, 33
- (7) Black J.H., Chaffee F.H.Jr., Foltz C.B., 1987, ApJ 317, 442
- (8) Blades J.C., Hunstead R.W., Murdoch H.S., Pettini M., 1982, MNRAS 200, 1091
- (9) Bohlin R.C., Savage B.D., Drake J.F., 1978, ApJ 224, 132
- (10) Boissé, P., 1994, In: Montmerle T., Lada C.J., Mirabel I.F., Tran Thanh Van J. (eds) The Cold Universe, Editions Frontières, p. 379
- (11) Boissé, P., 1995, In: Meylan G. (ed) QSO Absorption Lines, Springer, p. 35
- (12) Boissé P., Bergeron J., 1988, A&A 192, 1
- (13) Boissé P., Boulade O., 1990, A&A, 236, 291
- (14) Boissé P., Le Brun V., Bergeron, J., Deharveng J.-M., 1998, In: P. Petitjean (ed) Structure and Evolution of the Intergalactic Medium from QSO Absorption Line Systems, Editions Frontières, in press
- (15) Briggs F.H., Wolfe A.M., 1983, ApJ 268, 76
- (16) Brown R.L., Spencer R.E., 1979, ApJ 230, L1
- (17) Burbidge E.M., Smith H.E., Weymann R.J., Williams R.E., 1977, ApJ 218, 1
- (18) Carignan C., Puche D., 1989, AJ 100, 641
- (19) Casoli F., Encrenaz P.J.E., Fort B., et al., 1996, A&A 306, L41
- (20) Casoli F., Sauty S., Gerin M., Boselli, et al., 1997, A&A, in press
- (21) Caulet A., 1989, ApJ 340, 90
- (22) Chaffee F.H.Jr, Black J.H., Foltz C.B., 1988, ApJ 335, 584
- (23) Cohen R.D., Barlow T.A., Beaver E.A., et al., 1994, ApJ 421, 453
- (24) Cohen R.D., Beaver E.A., Diplas A., et al., 1996, ApJ 456, 132
- (25) de la Varga A., Reimers D., 1998, In: P. Petitjean (ed) Structure and Evolution of the Intergalactic Medium from QSO Absorption Line Systems, Editions Frontières, in press
- (26) Fall S.M., Pei Y.C., 1993, ApJ 402, 479
- (27) Fall S.M., Pei Y.C., 1995, In: Meylan G. (ed) QSO Absorption Lines, Springer, p. 23
- (28) Foltz C.B., Chaffee F.H., Wolfe A.M., 1988, ApJ 335, 35
- (29) Ge J., Bechtold J., Black J.H., 1997, ApJ 474, 67
- (30) Ge J., Bechtold J., 1997, ApJ 477, L73
- (31) Guillemin P., Bergeron J., 1997, A&A, in press
- (32) Haehnelt M.G., Steinmetz M., Rauch M., 1997, ApJ, submitted
- (33) Jenkins E.B., Shaya E.J., 1979, ApJ 231, 55
- (34) Jobin M., Carignan C., 1989, AJ 100, 648
- (35) Kronberg P.P., Perry J.J., Zukowski E.L., 1992, ApJ 387, 528
- (36) Kulkarni V.P., Fall S.M., Truran J.W., 1997, ApJ 484, L7
- (37) Lanzetta K.M., Bowen D.V., 1992, ApJ 391, 48
- (38) Lanzetta K.M., Wolfe A.M., Turnshek, D.A., 1989, ApJ 344, 277
- (39) Lanzetta K.M., Turnshek D.A., Sandoval J., 1993, ApJS 84, 109
- (40) Lanzetta K.M., Wolfe A.M., Turnshek D.A., 1995, ApJ 440, 435
- (41) Lanzetta K.M., Wolfe A.M., Altan H., et al., 1997, AJ 114, 1337
- (42) Le Brun V., Bergeron J., Boissé P., Deharveng J.-M., 1997, A&A 321, 733 (Paper I)
- (43) Le Brun V., Bergeron J., 1997, A&A, submitted
- (44) Levshakov S.A., Kegel W.H., 1997, MNRAS 288, 787
- (45) Lu L., 1991, ApJ 379, 99
- (46) Lu L., Sargent W.L.W., Barlow T.A., et al., 1996, ApJS 107, 475
- (47) Malhotra S., 1997, ApJ, in press
- (48) Meyer D.M., Roth K.C., 1990, ApJ 363, 57
- (49) Meyer D.M., York D.G., 1992, ApJ 399, L121
- (50) Morton D.C., 1991, ApJS 77, 119
- (51) Morton D.C., Dinerstein H.L., 1976, ApJ 204,1
- (52) Neff S.G., Hutchings J.B., Gower A.C., 1989, AJ 97, 1291
- (53) Omont, A., Petitjean, P., Guilloteau, S., et al., 1996, Nature 382, 426
- (54) Ostriker J.P., Heisler J., 1984, ApJ 278, 1
- (55) Pei Y.C., Fall S.M., 1995, ApJ 454, 69
- (56) Pei Y.C., Fall S.M., Bechtold J., 1991, ApJ 378, 6
- (57) Petitjean P., Bergeron J., 1990, A&A 231, 309
- (58) Pettini M., Bowen D.V., 1997, A&A 327, 22
- (59) Pettini M., Smith L.J., Hunstead R.W., King D.L., 1994, ApJ 426, 79
- (60) Pettini M., Smith L.J., Hunstead R.W., King D.L., 1997a, ApJ 486, 665
- (61) Pettini M., King D.L., Smith L.J., Hunstead R.W., 1997b, ApJ 478, 536
- (62) Phillips S., Edmunds M.G., 1996, MNRAS 281, 362
- (63) Prochaska J. X., Wolfe A.M., 1996, ApJ 470, 403
- (64) Prochaska J. X., Wolfe A.M., 1997, ApJ, 487, 73
- (65) Schade D., Lilly S.J., Le Fèvre O., et al., 1996, ApJ 464, 79
- (66) Schartel N., Komossa S., Brinkmann, et al., 1997, A&A 320, 421
- (67) Sembach K.R., Steidel C.C., Macke R.J., Meyer D.M., 1995, ApJ 445, L27
- (68) Solomon P.M., Downes D., Radford S.J.E., 1992, ApJ 398, L29
- (69) Steidel C.C., Sargent W.L.W., 1992, ApJS 80, 1
- (70) Steidel C.C., Dickinson M., Bowen D.V., 1993, ApJ 413, L77
- (71) Steidel C.C., Pettini M., Dickinson M., Persson S.E., 1994a, AJ 108, 2046
- (72) Steidel C.S., Dickinson M., Persson S.E., 1994b, ApJ 437, L75
- (73) Steidel C.C., Bowen D.V., Blades J.C., Dickinson M., 1995, ApJ 440, L45
- (74) Steidel C.C., Dickinson M., Meyer D.M. et al. 1997, ApJ 480, 568
- (75) Storrie-Lombardi L.J., McMahon R.G., Irwin M.J., 1996, MNRAS 283, L79
- (76) Tripp T.M., Lu L., Savage B.D., 1996, ApJS 102, 239
- (77) Verner D. A., Tytler D., Barthel P. D., 1994, ApJ 430,186
- (78) Vladilo G., Centurion M., Falomo R., Molaro P., 1997, A&A 327, 47
- (79) Wiklind T., Combes F., 1996, In: Shaver P., (ed) Science with Large Millimetre Arrays, Springer, p. 86
- (80) Wolfe A.M., Briggs F.H., Turnshek D.A., et al., 1985, ApJ 294, L67
- (81) Wolfe A.M., Turnshek D.A., Smith H.E., Cohen R.S., 1986, ApJS 61, 249
- (82) Wolfe A.M., Lanzetta K.M., Foltz C.B., Chaffee F.H., 1995, ApJ 454, 698
- (83) Young P., Sargent W.L.W., Boksenberg A., et al., 1979, ApJ 229, 891
- (84) Young P., Sargent W.L.W., Boksenberg A., 1982, ApJS 48, 455
- (85) Zheng W., Kriss G.A., Telfer R.C., et al., 1997, ApJ 475, 469