08.09.2:HR 1017, HR 1865, IRAS 04296+3429, IRAS 22223+4327 – 08.16.4 – 08.01.1
Leen Decin. e-mail Leen.Decin@ster.kuleuven.ac.be
Photospheric composition of the carbon-rich 21 m post-AGB stars IRAS 22223+4327 and IRAS 04296+3429 ††thanks: Based on observations with the Utrecht Echelle Spectrograph, fed by the 4.2m William Herschel Telescope at La Palma
Abstract
We present a detailed chemical analysis on the basis of high-resolution, high signal-to-noise optical spectra of two post-AGB objects IRAS 22223+4327 and IRAS 04296+3429. Both display the unidentified 21 m feature in their IR-spectra. The analysis is performed using HR 1865(F0Ib) and HR 1017(F5Iab) as reference stars.
The spectroscopic indicators provide accurate atmospheric parameters of =6500 K, =1.0 and =5.5 for IRAS 22223+4327 and =7000 K, =1.0 and =4.0 for IRAS 04296+3429. Our high-resolution data are inconsistent with the significantly lower temperatures deduced from spectral-type determinations in the literature based on low resolution spectra and highlight the need of high-resolution spectroscopy for the determination of accurate fundamental parameters of chemically peculiar supergiants.
Both photospheres are found to be metal-deficient with [Fe/H]=0.4 and 0.7 respectively. C and N are found to be overabundant. Useful O-lines were only detected in the brighter IRAS 22223+4327 and the O abundance is found to follow the Fe deficiency : the C/O photospheric abundance is about 1.3, but due to the lack of oxygen lines it is difficult to determine accurately. This corroborates the fact that the carriers of the 21 m feature are formed in a carbon rich circumstellar chemistry. Moreover, these IRAS-stars have large overabundances of s-process-elements. The mean abundance of all the measured s-process-elements is [s/Fe]=+1.0 for IRAS 22223+4327 and +1.4 for IRAS 04296+3429. The distribution of the s-process elements can best be described as due to a distribution of neutron exposures with a low mean neutron exposure of . The 21 m stars form an interesting sub-group in the total post-AGB sample of stars, not only for their IR characteristics, but also in a broader context of stellar (chemical) evolution theory. They show, in contrast to other post-AGB stars, that the 3rd dredge-up has been efficient during their AGB evolution. The mean neutron exposure is lower than expected for their metallicity.
The spectroscopic parameters found for the massive spectral analogues (=7500 K, =2.0 and =3.0 for HR 1865 and =6500 K, =2.0 and =3.5 for HR 1017) agree well with the values found in the literature. Both stars display an enrichment in Na, which is commonly observed in massive supergiants but theoretically not well understood.
keywords:
stars: individual: HR 1017, HR 1865, IRAS 04296+3429, IRAS 22223+4327 – stars: post-AGB – stars: abundances1 Introduction
The late AGB and post-AGB phases are among the least understood in current low- and intermediate-mass stellar evolution theory, mainly because of the coarse understanding of the mass-loss mechanism(s) and internal convection. The theoretical understanding of the total chemical evolution and certainly the chemical enrichment due to the 3rd dredge-up phenomena are therefore still poorly understood (e.g. Lattanzio et al. 1996).
One of the tracers of the chemical evolution of the star is the chemical content of the dusty circumstellar envelope which is formed by the high mass-loss episode(s) during the late AGB phase. The infrared spectral region is often used to infer the envelope composition since not only the bulk of radiation is emitted in the IR but also because the IR-spectra are characterized by the chemistry. The main signature of O-rich dusty environments are silicate features at 9.7 m and 18 m while a C-rich chemistry is characterized by the presence of the SiC emission at 10-12 m and/or the presence of 3.3, 6.2, 7.7 and 11.3 m features which are usually attributed to the polycyclic aromatic hydrocarbons (PAHs). The spectrographs on board of ESA’s Infrared Space Observatory (ISO) are revealing now a wealth of detail concerning these 2 chemical types of circumstellar environments around evolved stars (see e.g. the ISO dedicated November 1996 issue of A&A).
Recently the detection of a strong broad emission feature at 21 m accompanied by unusually strong 3.4-3.5 and 6-9 m emission features in several post-AGB stars has been reported (Kwok et al. 1989; Hrivnak & Kwok 1991a,b; Kwok et al. 1995; Geballe et al. 1992; Henning et al. 1996). While the carrier of the broad feature is not yet identified (e.g. Begemann et al. 1996 and references therein), there are several observational indications that it is only present in a C-rich circumstellar chemistry: the 21 m stars usually also display strong PAH features at lower wavelengths; Hrivnak (1995) studied low resolution spectra and revealed the presence of circumstellar C2 and C3 and also Bakker et al. (1995,1996,1997) detected the optical circumstellar carbon molecules around 21 m stars; Omont et al. (1993) deduced a C-rich environment from the large HCN/CO millimetre-line ratio. Till now the 21 m feature is only observed in post-AGB stars and young PN’s and it is not clear whether the carrier is only produced during the transition from the AGB to the PN phase or already produced on the AGB but not excited.
Since the discovery of Justannont et al. (1996) that also HD 187885 may display a small 21 m feature, all known the post-AGB stars with photospheres showing the yields of an efficient 3rd dredge-up (Van Winckel 1997 and references therein), also display the 21 m feature in their IR spectrum. The study of the stellar photospheres of the 21 m stars is therefore not only interesting for the study of the carrier and excitation mechanism of the 21 m feature itself, but also in a broader context of stellar (chemical) evolution of low and intermediate mass stars.
In this paper, we report on a detailed chemical study of the stellar photospheres of two 21 m post-AGB stars: IRAS 22223+4327 and IRAS 04296+3429. The two objects are optically faint (V = 9.6 and 14.2 respectively) with a total optical flux which is smaller than the total infrared flux. Their spectral energy distribution is double-peaked, with visible and near-infrared components due to the reddened photosphere and a far-infrared component caused by the detached dust shell (Hrivnak & Kwok 1991a). The huge IR excess may indicate a relatively high initial mass. In the IRAS colour-colour diagram, the two stars are located in the region of post-AGB stars in between the late AGB stars and young PN’s (Omont et al. 1993). We used two bright massive supergiants HR 1017 ( Per) and HR 1865 ( Lep) of similar spectral type (F5Ib and F0Ib respectively) as reference objects (see Table 1).
2 Observations and data reductions
The chemical analysis of the programme stars is based on an accurate study of high-resolution optical spectra (/=50000, corresponding to a projected slit of 1.1”). The spectra have been obtained by one of us (EJB) with the Utrecht Echelle Spectrograph, fed by the 4.2m William Herschel Telescope at La Palma, Spain. The echelle spectrograph is equipped with a cross-dispersor so that the different orders are projected next to one another on the CCD. In the red part of the spectrum the consecutive orders are not overlapping. The wavelength coverage of the spectra is indicated in Table 1. The data were reduced using the echelle package of IRAF V2.9 in a standard way with optimal extraction of the orders.
3 Analysis
3.1 Atomic Data
For the line identification we mainly used the line lists by Thévenin (1989, 1990), which are based on the lines identified in the solar spectrum by Moore et al. (1966). These lists are completed with the line lists of Van Winckel (1995) and Bakker (1995). We first performed a complete identification of the high S/N spectra (S/N 250) of HR 1865 and HR 1017 which we used to identify and de-blend the lower quality spectra of the IRAS sources.
In recent years considerable efforts have been made in calculating improved model stellar atmospheres and oscillator strengths () for atomic transitions. Unfortunately, high precision gf-values are still unavailable for many elements. We have taken the excitation potential and the oscillator strengths mainly from the inverted solar abundance analysis of Thévenin (1989, 1990). The atomic data for O I, Mg I, Mg II, Si I, Si II, Ti I, Ti II, Cr I, Cr II, Fe II, Sr I, Sr II, Y I, Y II, Zr I and Zr II are obtained from the automatic data bank of Kurucz (http://cfa-www.harvard.edu/amp/data/kur23/sekur.html) and the mailserver of the ’Vienna Atomic Line Data Base’. For the Fe I oscillator strengths we used the critical compilation of Lambert et al. (1996).
3.2 Determination of the atmospheric parameters
We used the CDROM grid of LTE model atmospheres of Kurucz (1993) in combination with his abundance calculation programme WIDTH9. A model atmosphere is uniquely determined by the metallicity, the effective temperature (), the gravity () and the microturbulent velocity (). We used input models with a solar metallicity Z for HR 1865 and HR 1017 and Z=0.5 for the IRAS-sources with =2 .
The determination of these atmospheric parameters were solely based on our high-resolution spectra. Quantitative photometric analysis is hampered by the uncertainty on the amount of circumstellar reddening, the possible anomalous circumstellar reddening law and by the inaccurate calibration of the photometric systems for supergiants in general. The photometry can therefore only be used as a first guess for the finer spectroscopic analysis.
3.2.1 The effective temperature
A spectroscopic estimate for is found by forcing the abundances of an ion to be independent on the lower excitation potential of the transitions. For F-type supergiants, only Fe I lines are suitable for such an analysis since this method is only usable for ions with a large number of weak lines having a large spread in excitation potential. Moreover, for supergiants in the temperature range of our programme stars, non-LTE effects on the Fe I lines are small (Venn 1995b).
During our research it became clear that even a few unprecise oscillator strength values can limit the precision of this method considerably. When using the Fe I oscillator strengths of Thévenin we encountered the same problem for every star : the effective temperature determined on the base of the Fe I lines was some 500K higher than the temperature based on the Fe II lines. Moreover, the temperature estimates of the reference stars were higher than the temperatures found in the literature.
First we situated this discrepancy in the departure of local thermodynamic equilibrium (non-LTE effects). The LTE underabundance of iron due to overionisation of Fe I in F supergiants amounts from 0.03 dex (F8 supergiants) to 0.2 dex (F0 supergiants) (Venn 1995b; Boyarchuk & Lyubimkov 1983; Boyarchuk et al. 1985, 1988) A shift of 0.2 dex in abundance corresponds to a temperature shift of 200 K. It turned out, however, that for every star (= (Fe I)- (Fe II)) was too large (e.g. 700 K for HR 1865 and 400 K for HR 1017) to be caused solely by non-LTE effects. Note that by limiting our abundance analysis to lines with an equivalent width smaller than 150 m, we focus on lines formed in deeper layers where the non-LTE effects are known to be smaller.
We have then limited the Fe I lines to only those listed in the critical compilation of -values by Lambert et al. (1996). They re-discussed the Fe I gf-values by comparing the gf-values of several authors (see Lambert for references). By using these oscillator strengths, all problems concerning discrepancy of , or (non-LTE effects) disappear! It is extremely important to limit the used Fe I lines to transitions with a precise oscillator strength. For Fe II we don’t have any lines in common with Lambert. Therefore we have compared the -values of Thévenin with these of Lambert: the -values of Thévenin were systematically 0.190.08 smaller than these of Lambert, due to the fact that Lambert used 7.51 for the solar Fe abundance and Thévenin 7.67. We have thus increased the -values of Fe II of Thévenin with 0.19. The solar abundances of the other chemical elements are from Grevesse (1989). For HR 1865, HR 1017 and IRAS 22223+4327 we derived a temperature of 7500 K, 6500 K and 6500 K respectively (e.g. see Fig. 1).


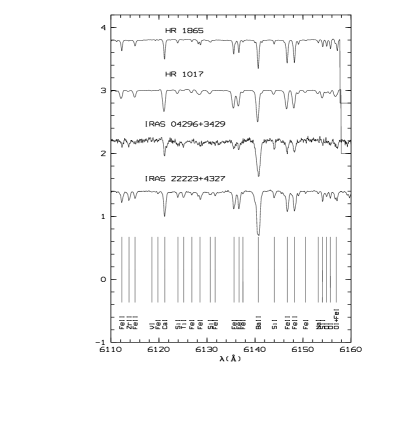
For the faint object IRAS 04296+3429 it turned out to be impossible to determine the effective temperature with this method due to the lack of good quality Fe I lines. A rough estimate is found when comparing the spectra of the IRAS-stars with those of the two reference stars. Figure 2 shows the spectra of the four programme stars in the wavelength coverage between 6110 and 6160 . This is an interesting spectral interval since besides the O I triplet and Ba II line, also Fe I and Fe II lines are present. The ratio of the Fe II line-strengths versus the Fe I lines gives an indicator of the effective temperature for these four stars of similar gravity.
The resemblance between the spectra of HR 1017 and IRAS 22223+4327 is striking. This is confirmed by our spectroscopic temperature assessment of =6500 K for HR 1017 and IRAS 22223+4327. For IRAS 04296+3429 the ratio of the Fe II to Fe I lines is higher than the ratio of HR 1017 and lower than this of HR 1865. We therefore estimate the temperature of IRAS 04296+3429 to be approximately 7000 K. To test the consistency of these , we have checked the excitation potential-abundance diagram of IRAS 04296+3429. The slope is small and positive, but it indicates that the temperature departure is still less than 300 K, within the bounds of the estimated accuracy.
Hrivnak (1995) has determined the spectral type of the IRAS sources on the basis of low resolution spectra and concluded that both IRAS 04296+3429 and IRAS 22223+4327 are G0Ia supergiants. This spectral classification was used by Kwok et al. (1995) and Bakker et al. (1996) to estimate the effective temperature of 5000-5500 K for both stars. This low temperature is, however, inconsistent with our high-resolution spectra! Not only because in the lower excitation potential-abundance plot, a significant upward trend shows up, but also because neutral lines of heavy elements should appear in the spectra at those temperatures. The strong Y I line at 6435 for instance, would have an equivalent width of 20 m for the abundance computed from the Y II lines at a temperature of 5500 K and log(g) = 1.0.
We want to stress the fact that for reddened, chemically peculiar supergiants, high-resolution data are definitely needed for accurate fundamental parameter determinations. The line regions, used in the low resolution spectra to infer the spectral type, are influenced by strong resonance lines of s-process elements like Ba and Y. With strong s-process enhancements, like observed in IRAS 05341+0852 by Reddy et al. (1997), the optical spectrum is even completely dominated by lines of s-process isotopes. In our opinion, the chemical peculiarity and certainly the strong enhancements of s-process isotopes, make standard spectral classification difficult.
3.2.2 Gravity and the microturbulent velocity
We derived the model gravity by implying that different ions of the same element yield the same abundances to within 0.1 dex. For F supergiants, the only element useful for this purpose is again Fe by the lack of alternatives with enough lines of both ionisation stages. The observed hydrogen Balmer lines are affected by emission so we did not use them to constrain the gravity. A change in the value by 0.5 makes the abundances derived for the two ionisation stages differ by in between 0.11 and 0.26 dex. The total uncertainty on the gravity of these objects is, however, more uncertain than the 0.3 this method suggests, since it does not take into account other uncertainties on the abundances which are more difficult to quantify, like non-LTE effects, systematic errors etc. Note that the main conclusions of this work (see discussion) are based on abundance ratios, which are much less influenced by uncertainties in effective temperature and gravity than absolute values.
The microturbulent velocity for each star has been determined by forcing the Fe I abundances to be independent on the equivalent width (Wλ) (see Fig. 1 for IRAS 22223+4327).
IRAS 04296+3429 has not enough lines available with a good range in equivalent width for a reliable estimate. We assumed =4.0 . Nevertheless, the value of microturbulence is not critical in this analysis since only weak lines (W150 m) are included in the final average abundances. The use of weak lines also means that radiative damping terms will not be important.
A synopsis of the atmospheric parameters for the four stars is listed in Table 1.
| m(v) | Obs. region | ||||
|---|---|---|---|---|---|
| magn. | K | ||||
| IRAS | |||||
| 04296+3429 | 14.2 | 7000 | 1.0 | 4.0 | 5560–10045 |
| IRAS | |||||
| 22223+4327 | 9.7 | 6500 | 1.0 | 5.5 | 4430-10045 |
| HR 1017 | 1.7 | 6500 | 2.0 | 3.5 | 4690–7340 |
| HR 1865 | 2.6 | 7500 | 2.0 | 3.5 | 4690–7340 |
3.3 Error analysis
3.3.1 Internal errors
The standard deviation on the abundance of the element for which we observed more than five lines is a good indicator of the consistency of the chemical analysis (e.g. see Table 2). A typical value for is between 0.10 and 0.25 dex.
For a good model in ionisation and excitation equilibrium, is mainly determined by non-systematic errors on the equivalent width and especially on the oscillator strength. The equivalent widths were measured by fitting a Gaussian curve to the absorption lines.
To check our -values for systematic errors, we compared our LTE abundance analysis of HR 1865 with a similar study of Venn (1995b). Venn mainly used the oscillator strengths of Führ et al. (1988); Wiese & Martin (1980); Führ et al. (1981); Wiese & Fuhr (1975) and O’ Brian et al. (1991). No systematic differences occur, so we continued to use the -values of Thévenin for most atomic species. Since we did not account for the hyperfine broadening of transitions of atoms with an odd atomic number, the abundances of these ions are slightly overestimated.
Other contributors to the scatter could be differential non-LTE effects and non-detected blends. The blends of the IRAS stars, which have broader lines, are detected by comparing the spectra with the narrow lined reference stars.
3.3.2 Inaccuracies on the model parameters
The model parameters (, and ) are not independent: a change in one parameter generally induces a shift in another for the spectroscopic requirements (ionisation balance, independence of the abundance of an ion versus the excitation potential and equivalent width) to be fulfilled. A typical shift of 0.5 dex in the gravity induces a temperature shift of 300-400 K, so that the ionisation balance still would be maintained. We refer to Table 3 of Van Winckel (1997) for a quantitative estimation of the influence of the different uncertainties on the abundance determination. The temperature uncertainty has by far the biggest influence on the abundance accuracy, especially for ions with the smallest occupation level since they are most influenced by uncertainties on the ionisation balance induced by errors on the temperature and gravity.
4 Results of the chemical analyses
In the Tables 2-5 we give the results of the abundance analysis for each programme star. For every ion we list the number of lines used, the mean equivalent width, the absolute abundance, the abundance ratio relative to the solar value and the internal scatter, if more than one line is used. A complete line list with the detailed atomic data can be obtained upon request. For the solar iron abundance we used the meteoric iron abundance of 7.51.
| HR 1865 | ||||||
| =7500 K | ||||||
| =2.0 | ||||||
| =3.0 | ||||||
| [Fe/H]=0.00 | ||||||
| ion | N | [el/Fe] | Venn | |||
| C I | 11 | 29 | 8.16 | 0.40 | 0.09 | 0.02 |
| O I | 5 | 34 | 8.44 | 0.49 | 0.02 | 0.24 |
| Na I | 3 | 67 | 6.72 | +0.39 | 0.11 | 0.20 |
| Mg I | 2 | 23 | 7.52 | 0.06 | 0.05 | 0.26 |
| Si I | 9 | 19 | 7.34 | 0.21 | 0.26 | 0.08 |
| S I | 3 | 29 | 7.22 | +0.01 | 0.06 | 0.22 |
| Ca I | 9 | 9 | 6.44 | +0.08 | 0.13 | 0.06 |
| Sc II | 1 | 14 | 3.27 | +0.17 | 0.23 | |
| Ti I | 4 | 16 | 4.97 | 0.02 | 0.07 | |
| Ti II | 2 | 101 | 5.07 | +0.08 | 0.09 | 0.19 |
| Cr I | 2 | 15 | 5.57 | 0.10 | 0.05 | |
| Cr II | 4 | 90 | 5.88 | +0.21 | 0.12 | 0.21 |
| Mn I | 3 | 17 | 5.46 | +0.07 | 0.13 | |
| Fe I | 59 | 36 | 7.50 | 0.01 | 0.12 | 0.15 |
| Fe II | 18 | 50 | 7.53 | 0.02 | 0.15 | 0.10 |
| Ni I | 28 | 17 | 6.18 | 0.07 | 0.14 | 0.08 |
| Cu I | 1 | 5 | 3.98 | 0.23 | ||
| Zn I | 1 | 17 | 4.36 | 0.24 | ||
| Y II | 8 | 47 | 2.41 | +0.17 | 0.16 | |
| Zr II | 5 | 18 | 2.98 | +0.38 | 0.21 | 0.19 |
| Ce II | 5 | 7 | 1.71 | +0.16 | 0.09 | |
| Nd II | 7 | 9.2 | 1.73 | +0.23 | 0.10 | |
| HR 1017 | |||||
| =6500 K | |||||
| =2.0 | |||||
| [Fe/H]=0.16 | |||||
| ion | N | [el/Fe] | |||
| C I | 10 | 47 | 8.43 | 0.03 | 0.11 |
| O I | 2 | 32 | 8.65 | 0.12 | 0.14 |
| Na I | 1 | 91 | 7.01 | 0.84 | |
| Al I | 1 | 25 | 6.31 | 0.00 | |
| Si I | 8 | 33 | 7.19 | 0.20 | 0.22 |
| Ca I | 7 | 78 | 6.24 | 0.04 | 0.11 |
| Sc II | 3 | 43 | 3.19 | 0.25 | 0.06 |
| Ti I | 7 | 16 | 4.84 | 0.01 | 0.14 |
| Ti II | 4 | 94 | 4.83 | 0.00 | 0.12 |
| Cr I | 7 | 44 | 5.50 | 0.01 | 0.18 |
| Cr II | 7 | 87 | 5.75 | 0.24 | 0.13 |
| Mn I | 6 | 26 | 5.32 | 0.09 | 0.16 |
| Fe I | 69 | 44 | 7.32 | 0.03 | 0.12 |
| Fe II | 12 | 47 | 7.39 | 0.04 | 0.07 |
| Ni I | 30 | 36 | 6.22 | 0.13 | 0.13 |
| Cu I | 1 | 36 | 3.98 | 0.07 | |
| Zn I | 1 | 38 | 4.03 | 0.41 | |
| Y II | 3 | 37 | 2.01 | 0.07 | 0.11 |
| Zr II | 2 | 33 | 2.64 | 0.20 | 0.25 |
| La II | 2 | 20 | 1.44 | 0.38 | 0.04 |
| Ce II | 5 | 17 | 1.37 | 0.02 | 0.06 |
| Nd II | 15 | 23 | 1.39 | 0.05 | 0.14 |
| IRAS 22223+4327 | |||||
| =6500 K | |||||
| =1.0 | |||||
| [Fe/H]=0.44 | |||||
| ion | N | [el/Fe] | |||
| C I | 8 | 70 | 8.63 | 0.51 | 0.14 |
| N I | 4 | 54 | 7.88 | 0.27 | 0.05 |
| O I | 3 | 24 | 8.50 | 0.01 | 0.04 |
| Al I | 4 | 16 | 6.15 | 0.12 | 0.10 |
| Si I | 14 | 46 | 7.43 | 0.32 | 0.17 |
| S I | 4 | 53 | 6.85 | 0.08 | 0.09 |
| Ca I | 6 | 58 | 5.97 | 0.05 | 0.08 |
| Ca II | 1 | 6 | 5.80 | 0.12 | |
| Ti I | 2 | 26 | 4.95 | 0.40 | 0.16 |
| Cr I | 7 | 45 | 5.19 | 0.04 | 0.11 |
| Cr II | 6 | 118 | 5.39 | 0.16 | 0.22 |
| Mn I | 1 | 38 | 4.92 | 0.03 | |
| Mn II | 1 | 50 | 5.20 | 0.25 | |
| Fe I | 41 | 57 | 7.08 | 0.01 | 0.13 |
| Fe II | 12 | 49 | 7.05 | 0.02 | 0.15 |
| Ni I | 19 | 35 | 5.95 | 0.14 | 0.19 |
| Y II | 4 | 128 | 3.44 | 1.64 | 0.09 |
| Zr II | 6 | 56 | 3.47 | 1.31 | 0.15 |
| Ba II | 1 | 13 | 2.67 | 0.98 | |
| La II | 16 | 68 | 1.96 | 1.18 | 0.17 |
| Ce II | 8 | 52 | 2.06 | 0.95 | 0.23 |
| Pr II | 5 | 47 | 1.32 | 1.05 | 0.24 |
| Nd II | 11 | 51 | 1.92 | 0.86 | 0.22 |
| Sm II | 10 | 54 | 1.24 | 0.68 | 0.25 |
| Eu II | 2 | 51 | 0.77 | 0.70 | 0.06 |
| IRAS 04296+3429 | |||||
| =7000 K | |||||
| =1.0 | |||||
| [Fe/H]=0.69 | |||||
| ion | N | [el/Fe] | |||
| C I | 7 | 87 | 8.81 | 0.94 | 0.18 |
| N I | 2 | 65 | 7.84 | 0.48 | 0.02 |
| Si I | 3 | 55 | 7.46 | 0.60 | 0.07 |
| S I | 1 | 57 | 7.13 | 0.61 | |
| Ca I | 3 | 35 | 5.93 | 0.26 | 0.16 |
| Fe I | 8 | 31 | 6.85 | 0.03 | 0.11 |
| Fe II | 10 | 74 | 6.80 | 0.02 | 0.12 |
| Ni I | 3 | 47 | 6.12 | 0.56 | 0.09 |
| Y II | 3 | 84 | 3.60 | +2.05 | 0.06 |
| Zr II | 4 | 33 | 3.41 | +1.50 | 0.11 |
| Ba II | 1 | 25 | 3.24 | +1.80 | |
| La II | 5 | 78 | 2.38 | +1.85 | 0.14 |
| Ce II | 2 | 30 | 2.14 | +1.28 | 0.05 |
| Nd II | 2 | 57 | 1.96 | +1.13 | 0.16 |
| Eu II | 1 | 45 | 1.04 | +0.35 | |
4.1 HR 1865 and HR 1017
Although our primary goal was to use the spectra of the narrow-lined supergiants HR 1865 and HR 1017 for line-identification purposes and to recognize possible blending in the spectra of the IRAS objects, we also performed a complete LTE abundance analysis of these two bright objects.
The non-variable HR 1865 is a very bright Galactic F-type supergiant which is often used as a standard star for Galactic and extragalactic research. The most recent extensive chemical study is by Venn (1995a,b). She deduced model-parameters of = 7400 and log(g) = 1.1 and = 4.0 which are similar to our findings. The difference between the two studies is given in Table 2. Generally the agreement is rather good with the noticeable exception of Mg I, S I and Sc II where the difference amounts to 0.26, 0.22 and 0.23 dex respectively. There are no Sc II and Mg I lines common in our analyses. The common S I lines (3 in total) have very similar equivalent widths, so the difference in results is due to slightly different atomic parameters and microturbulent velocity.
The most recent analysis of HR 1017 we found in the literature is by Luck & Lambert (1985). The atmospheric parameters they found are somewhat cooler than ours : = 6250, log(g)=0.90 and = 3.0. Their iron abundance is somewhat higher, but generally the agreement between the abundances is good.


4.1.1 Intermediate and heavy elements (Na-Zr)
Except for Na, the other elements do not seem to be enhanced (see Fig. 3). This corresponds to the abundance analysis of Venn and Luck & Lambert.
Both HR 1865 and HR 1017 display a strong sodium enrichment ([Na/H]=+0.39 and +0.68). Sodium enrichment in F-K supergiants was first reported by Luck (1977, 1978). Since then several authors have detected an enhancement of Na (see Venn 1995b and references therein). Boyarchuk & Lyubimkov (1983) proposed two possibilities for the Na-enrichment: 1) non-LTE effects in the tenuous and cool atmosphere, of which the corrections in the abundances are 0.1 dex for weak lines 2) during a NeNa proton capture reaction (22Ne(p,)23Na) Na could have been synthesized and after deep mixing with the interior (first dredge-up), Na-enrichment may occur in the stellar atmosphere (Venn 1995b). The Na-synthesis can only take place when the temperature is high enough. Therefore Na-enrichment is mass dependent: the more massive the star, the stronger Na will be enhanced. Takeda & Takada-Hidai (1994) calculated that HR 1865 is a less massive star than HR 1017 (M=17 M⊙ and M=14.5 M⊙); the Na enrichment displays the same trend.
Interestingly in an LTE analysis of several high-luminosity LMC/SMC Cepheids, Hill et al. (1995) did not found a general Na enhancement. Since the same temperatures and densities apply for the LMC/SMC Cepheid models, there is a hint that the Na enhancement of the Galactic Cepheids is real and not due to non-LTE effects. Detailed evolutionary models coupled with accurate nucleosynthetic networks are, however, needed in order to quantify the dependance of the nucleosynthetic yields and mixing ratios on the overall chemical composition, or other as yet unexplained difference in the LMC/SMC and Galactic supergiants.
4.2 IRAS 22223+4327 and IRAS 04296+3429
In Tables 4 and 5 we give an overview of the abundances relative to the solar value for IRAS 22223+4327 and IRAS 04296+3429.


4.2.1 Population
Both IRAS 22223+4327 and IRAS 04296+3429 are iron deficient, [Fe/H]=0.4 and 0.7 respectively. Together with the value of their galactic latitude (b=11.6 for IRAS 22223+4327 and b=9.1 for IRAS 04296+3429 ) this indicates that the IRAS-sources are low-mass objects of a relatively old population. The radial velocity deduced from the spectra are and for respectively IRAS 22223+4327 and IRAS 04296+3429 which are similar to values found in the literature (Omont et al. 1993). So far their is thus no evidence for radial velocity variations and binarity of the programme stars.
4.2.2 3rd dredge-up
Both stars display a strong enrichment of carbon ([C/Fe] = +0.5 and +0.9), an indication that the third dredge-up was effective. During this third dredge-up material out of the helium-burning shell is mixed into the stellar photosphere. Unfortunately, the O abundance is difficult to compute in this temperature-gravity domain. The only lines available are the O triplet at 6150 , but these are heavily blended with a Fe I and a Si I line. We only could determine the O abundance for the bright IRAS 22223+4327 and we obtain a C/O ratio of 1.3, but due to the large uncertainty of the O abundance this ratio is not very accurate. From the atomic photospheric lines alone the C/O ratio cannot be determined accurately enough to claim the objects to be real carbon stars (C/O 1). The sum of the CNO nuclei is therefore also rather uncertain and compared to the expected value for an unevolved star of the same metallicity we find only a CNO of +0.05.
The most convincing argument for mixing products of the helium-burning shell into the atmosphere are the large s-process elemental abundances. For IRAS 22223+4327 and IRAS 04296+3429 we could derive abundances of 9 respectively 7 s-process elements and all turned out to be significantly overabundant, even relative to the solar value. We will focus on the distribution of these elements in a separate section.
For metal deficient stars the abundances of s-process-elements scale with Fe for 1.5[Fe/H]0.0 (see Wheeler 1989). For IRAS 22223+4327 and IRAS 04296+3429 [s/Fe] is 1.0 and 1.4! There is thus no doubt that both IRAS stars are post 3rd dredge-up stars.
4.3 Intermediate-mass elements (Al-Ni)
For unevolved metal deficient stars a slight overabundance of the -elements reflects the chemical history of our Galaxy. The solar neighbourhood displays an increase of the [/Fe] ratio from 0.0 to +0.4 in the metallicity region from about solar to [Fe/H]=1.0 (Edvardsson et al. 1993) When we take into account the error bars in the -abundances, the overabundances of Si, S and Ni in IRAS 04296+3429 and Si and Ti IRAS 22223+4327 do not seem to be abnormal. We may conclude that the 3rd dredge-up did not enhance significantly the isotopes.
Also the odd elements are interesting tracers of internal nucleosynthesis and structure. Theoretical models predict an enrichment of Al and especially the Al/Mg ratio in stars where Hot Bottom Burning (HBB) has taken place (Lattanzio et al. 1996). In the deepest layers of the convective envelope the temperatures may reach about 82 million K, and substantial hydrogen burning via the CNO cycle will take place. Further, at these high temperatures 26Mg suffers substantial proton captures and produces 27Al during the interpulse phase. In theoretical evolutionary models, HBB is predicted only in intermediate mass stars, since the temperature of the bottom of the convective envelope only reaches in these models high enough values for the synthesis to take place. Although the high C abundance already indicates that HBB was not very effective in the IRAS objects, we carefully analysed the Al lines in our spectra of IRAS 22223+4327. The strongest optical lines at 8773 (multiplet number 9) are unfortunately heavily blended with the Phillips (2,0) band of the circumstellar C2. We therefore based or analysis of the lines of multiplet 10 (7835.3 and 7836.1 ) and multiplet 5 (6696.0 and 6698.7 ). The small overabundance of [Al/Fe] = 0.2 is not significant. Also the 7Li resonance line at 6707 Å is not detected, so we conclude that there is no evidence for even moderate HBB in IRAS 22223+4327. Unfortunately, there are no useful Mg lines in our spectra.
4.4 s-proces element distribution
Several theoretical studies of large nuclear reaction networks coupled with accurate AGB evolutionary codes exist (Malaney 1987a,b; Busso et al. 1992,1995) that enable us to characterize the s-process in the IRAS sources based on the photospheric s-process element distribution. The direct physical information on the efficiency of the internal nucleosythesis that can be deduced from the s-process distribution of an individual object, is unfortunately limited since the predicted photospheric distribution is not only determined by the nucleosythesis itself, but also by the theoretically less understood dredge-up process (Busso et al. 1995). The parameters governing the outcome of such chemical evolutionary models do therefore not only consist of nucleosynthetic quantities, but also of more ad-hoc adopted values governing the stellar evolution like mass-loss, dredged-up mass, frequency of dredge-ups etc. (Busso et al. 1992).
The ratio of light (Sr, Y, Zr) to heavy (Ba, La, Nd and Sm) s-elements gives a measure of the neutron exposure rate which is defined as where is the neutron density, the relative velocity of the neutrons and the seed nuclei. The pulsed neutron irradiation during the AGB evolution is parameterized by defining a mean neutron exposure defined a with the neutron exposure rate of a particular pulse and r the overlap factor which is the fraction of the inter-shell material that remains in the neutron-exposed region (Ulrich 1973). In most calculations, the neutron density and the overlap factor are adopted as constants and the efficiency of s-processing is indicated by one parameter .
For IRAS 22223+4327 we obtained the most complete s-process distribution. In the temperature-gravity domain of the moderately deficient programme stars, the Sr abundance is extremely difficult to measure due to the lack of weak lines. We therefore did not take this element into account to determine the [ls/Fe] ratio but following Busso et al. (1995) no correction factor is needed to account for unobserved elements from the light s-process trio. The mean abundance of the light elements Y and Zr is [ls/Fe] = +1.5 while for the heavy elements Ba, La, Nd and Sm [hs/Fe] = +0.9, hence the [hs/ls] = 0.6. Following Fig. 6 of Busso et al. (1995) the mean neutron exposure of the object can be estimated to be in between 0.2 and 0.25 .
IRAS 22223+4327 is located in this diagram in the locus of the Carbon stars and the high value of [ls/Fe] indicates a high mixing ratio between dredge-up material and residual mass of the envelope (Busso et al. 1995). This is not surprising since the post-AGB star is Carbon rich.
More surprising is, however, the low value of the mean neutron exposure of the object given its low metallicity. Indeed, several observational evidences exist that the neutron exposure increases with lower metallicity. In Fig. 1 of Busso et al. (1995), where they show the measured [hs/ls] values as a function of the iron abundance [Fe/H] of a sample of intrinsic and extrinsic S stars and Ba stars, a clear correlation is seen with an increase of 0.2 dex in [hs/ls] for a drop in metallicity from 0 to 0.5. While the mean trend of the Ba-stars indicate that an object with metallicity of 0.5, should have a [hs/ls] of 0.2, this ratio is only 0.6 for IRAS 22223+4327! Since the metallicity of Carbon stars is difficult to measure, no observational material is present for comparison.
In order to characterize more precisely the s-process efficiency, we made use of the abundance tables for s-process nucleosynthesis of Malaney (1987b). The tables list element abundance enhancements for exponential distribution of neutron exposures for different values using fixed neutron densities of and . To quantify the comparison between the observations and models we used the goodness-of-fit procedure as defined by Cowley & Downs (1980) and often used in the literature. For a description of the method we refer to Smith et al. (1997). In the comparison, we used the abundances of all the measured species : Y (Z=39), Zr(40), Ba(56), La(57), Ce(58), Pr(59), Nd(60), Sm(62) and Eu(63). For the uncertainty on the measured abundances we added quadratically a fixed value of 0.3 to the internal accuracy given in Table 5, this to account for uncertainties on the model atmosphere and uncertain values. Moreover, for species with less than 5 useful lines measured, we adopt an internal accuracy of 0.2 dex. We corrected the observed number densities for the initial abundance by adopting [s-process/Fe] = 0 and a metallicity of -0.5, but since the overabundance is large, this correction only marginally influences the result. For Eu, which is primarily an r-process element with a different chemical history than the s-process elements, we used the results of Woolf et al. (1995) to estimate the initial abundance. In this method, the quality of the fit is given by the quantity , with a lower value expressing a better fit. In Fig. 5 we plot our corrected abundance distribution together with Malaney’s (1987b) model predictions for an exponential neutron exposure with of () with an value of 0.6. For higher neutron efficiencies, the parameter increases fast (e.g. for = 0.3, is already more than tripled) and for the = 0.1 model we have = 3.7. Also the model with = 0.05 gives a good fit but the absolute enhancement of the s-process elements is, in this model, predicted to be too low in comparison with the observed values. We can conclude that the distribution of s-process elements in IRAS 22223+4327 points to a low s-process efficiency characterized by a .

The s-process distribution of IRAS 04296+3429 also points to a low s-process efficiency with the best fit again obtained for the models with . In this object, only 7 elements were taken into account in the fitting.
5 Discussion
| name | other names | b | V | 21 m | C2 | 3.3 m | 3.4 m | 30 m | molecular lines | references | |
|---|---|---|---|---|---|---|---|---|---|---|---|
| IRAS 04296+3429 | 9.1 | 14.2 | Y | Y | Y | Y | CO, HCN, CN | 7000K | 1, 3, 5, 8, 12 | ||
| IRAS 05113+1347 | 14.3 | 12.4 | Y | Y | Y | N | CN | 1, 7, 8, 11 | |||
| IRAS 05341+0852 | 12.2 | 12.8 | Y | Y | Y | Y | CN | 6500K | 11, 14 | ||
| HD 56126 | |||||||||||
| IRAS 07134+1005 | SAO 96709 | +10.0 | 8.2 | Y | Y | Y | N | ? | CO, HCN, CN | 7000K | 2, 3, 4, 10, 17 |
| HD 187885 | 7500K | ||||||||||
| IRAS 195001709 | SAO 163075 | 21 | 9.2 | weak | N | No CN | 8000K | 9, 15 | |||
| IRAS 20000+3239 | +1.2 | 13.3 | Y | Y | Y | CO, HCN, CN | 1, 7, 8, 11, 12 | ||||
| AFGL2688 | 6.5 | 14.0 | Y | Y | Y | HCN, CN | 13 | ||||
| IRAS 22223+4327 | DO 41288 | 11.6 | 9.7 | Y | Y | CO, HCN, CN | 6500K | 1, 7, 8, 11, 12 | |||
| HD 235858 | |||||||||||
| IRAS 22272+5435 | SAO 34504 | 2.5 | 8.7-9.5 | Y | Y | Y | Y | Y | CO, HCN, CS, CN | 1, 3, 6, 8, 17 | |
| IRAS 22574+6609 | +6.0 | Y | 5 | ||||||||
| IRAS 23304+6147 | +0.6 | 1.31 | Y | Y | Y | CO, HCN, CN | 1, 3, 5, 8, 16 |
1. Bakker et al. 1995 2. Bakker et al. 1997 3. Hrivnak et al. 1989a 4. Hrivnak et al. 1989b 5. Hrivnak & Kwok 1991a 6. Hrivnak & Kwok 1991b 7. Hrivnak et al. 1994 8. Hrivnak 1995 9. Justtanont et al. 1996 10. Klochkova 1995 11. Kwok et al. 1995 12. Omont et al. 1993 13. Omont et al. 1995 14. Reddy et al. 1997 15. Van Winckel et al. 1996a 16. Woodsworth et al. 1990 17. Zuckerman et al. 1986
The chemical composition indicates IRAS 22223+4327 and IRAS 04296+3429 to be ’bona-fide’ post-AGB stars: they display an enrichment of carbon with C/O higher than solar and especially high overabundances of s-process elements. For both stars the predicted heavy element abundances for an exponential distribution of neutron exposures with low value of the mean neutron exposure fit the observed s-process abundances best.
Note that not all stars, thought to be in-between the AGB and PN stage of stellar evolution, have all these chemical properties. E.g. HD 133656 ([Fe/H]=1) shows CNO enrichment, but no overabundance of the s-process-elements (Van Winckel et al. 1996b). Also SAO 239853 ([Fe/H]=0.8—1.0) (Van Winckel 1997) and HR 4912 (Luck & Bond 1989) are thought to be post-AGB stars without an enrichment of the s-process-elements. On the contrary, other 21 m stars like IRAS 07134+1005 ([Fe/H])=1.17; Klochkova 1995) and IRAS 05341+0852 ([Fe/H] = 0.9; Reddy et al. 1997) do also show overabundances of s-process-elements.
The two IRAS sources IRAS 22223+4327 and IRAS 04296+3429 belong to the small group of stars displaying the unidentified 21 m emission feature. The other best studied 21 m sources are listed in Table 6 (Kwok et al. 1989; Hrivnak & Kwok 1991a,b; Kwok 1993; Hrivnak 1995; Justtanont et al. 1996). Some of the sources are resolved in the 8-13 m window (Meixner et al. 1997) Note that the table does not include the new possible candidates given by Henning et al. (1996).
Table 6 shows that the 21 micron
sources have some common properties:
1. they are post-AGB stars with a central star of spectral type F or G and
luminosity class I (Kwok et al. 1995)
2. all have double-peaked energy distributions (Hrivnak 1995)
3. all are carbon-rich objects based on their optical, infrared or millimetre
spectra
4. all seven of which have been observed show HCN molecular lines
5. five sources display the 3.3 m emission band and three of them also an
unusually strong 3.4 m emission band
6. four display the 30 m emission band (Hrivnak 1995; Omont et al. 1995)
7. all the 21 micron sources of which the optical spectra
have been analysed (IRAS 22223+4327, IRAS 04296+3429, IRAS 07134+1005, IRAS 05341+0852 and HD 187885)
show an overabundance of s-process-elements, but also the reverse is true : all
field post-AGB stars known to be s-process enriched, also
display the 21 m feature.
The carbon-rich chemistry, as evidenced by the C2 circumstellar molecular lines and the photospheric analyses corroborates the suggestion of Hrivnak et al. (1989a) that carbon is a major constituent of the molecule producing the 21 m emission feature. So far the only star that evolved hot enough to display photospheric helium lines is HD 187885 (Van Winckel et al. 1996a) which only has a very weak 21 m feature. The effective temperature of 8000 K marks probably the region where the carriers of the feature are destroyed. High-resolution spectroscopy of more central stars and certainly accurate determinations of the effectieve temperatures are needed to test several theories concerning the nature of the IR features and the influence of changing properties of the stellar radiation field on them (Buss et al. 1990; Begemann et al. 1997).
So far, the study of heavy element nucleosynthesis to constrain 3rd drege-up models, concentrated on two groups of stars : the AGB stars (mainly Carbon stars, but also M stars that display s-process enhancements) and the Ba stargroup (Ba giants, Tc poor S stars, CH stars etc.). In the latter group the s-process enhancement is generally accepted to originate from mass-transfer episodes. These objects are binaries with one component being a cool old white dwarf (WD). The chemical peculiarities were build up when the star, which is now the primary, accreted s-process element enhanced material from the companion, which then was an AGB star and now is a cool white dwarf. The s-process distribution seen in these stars is thus not a direct result of internal mixing of the Ba-star itself, but a result of a not well understood accretion process of s-process enhanced material.
The study of the s-process element distribution of AGB stars themselves is made extremely difficult by the large photospheric molecular opacity that makes the modelling difficult and the detection of several species impossible (e.g. Utsumi 1985).
A systematic study of post-AGB stars in general and of the 21 m post-AGB stars in particular can in this debate contribute invaluable information. Indeed, not only the temperature-gravity domain of these stars makes it possible to detect a large number of s-elements by their atomic lines, but also the photospheric molecular opacity is negligible. Since the photospheric abundance is a direct result of the dredge-up process (contrary to the case of the Ba-stars) and a fair number of 21 m stars are now known, a systematic study of the s-process distributions can be used directly to constrain evolutionary models. In this first study the s-process distribution is characerized for IRAS 22223+4327 and IRAS 04296+3429 both with mean neutron exposure and for another objest IRAS 05341+0852, Reddy et al. (1997) find the . This value is certainly much lower than what might be expected from their metallicity if the 21 m stars would follow the same metallicity-neutron exposure relation of the Ba-stars (see Fig. 1 Busso et al. 1995). It is clear that a more homogeneous study of more sources is needed to compare carefully the different groups of stars.
Acknowledgements.
LD and HVW acknowledge support from the Science Foundation of Flanders. EJB acknowledges support form the National Science Foundation (Grant No. AST-9315124). This research has made use of the SIMBAD database, operated at CDS, Strasbourg, France and the Vienna Atomic Line Data-base (VALD), Vienna, Austria. The authors thank the anonymous referee for his interesting comments.References
- [] Bakker E.J., 1995, PhD thesis, Universiteit Utrecht, The Netherlands
- [] Bakker E.J., Waters L.B.F.M., Lamers H.J.G.L.M., Schoenmaker T., 1995, Ap&SS 224, 335
- [] Bakker E.J., Waters L.B.F.M., Lamers H.J.G.L.M., Trams N.R., Van Der Wolf F.L.A., 1996, A&A 310, 893
- [] Bakker E.J., Van Dishoeck E.F., Waters L.B.F.M., Schoenmaker T., 1997, A&A 323, 469
- [] Begemann B., Dorschner J., Henning Th., Mutschke H., 1996, ApJ 464, L195
- [] Begemann B., Dorschner J., Henning Th., et al., 1997, ApJ 476, 199
- [] Boyarchuk A.A., Lyubimkov L.S., 1983, Astrophysics 19, 385
- [] Boyarchuk A.A., Lyubimkov L.S., Sakhibullin N.A., 1985, Astrophysics 22, 203
- [] Boyarchuk A.A., Gubeny I., Kubat I., Lyubimkov L.S., Sakhibullin N.A., 1988, Astrophysics 28, 197
- [] Buss R.H. Jr., Cohen M., Tielens A.G.G.M., et al., 1990, ApJ 365, L23
- [] Busso M., Gallino R., Lambert D.L., Raiteri C.M., Smith V.V., 1992, ApJ 399, 218
- [] Busso M., Lambert D.L., Beglio L., et al., 1995, ApJ 446, 775
- [] Cowley C.R., Downs P.L., 1980. ApJ 236, 648
- [] Edvardsson B., Andersen J., Gustafsson B., et al., 1993, A&A 275, 101
- [] Führ J.R., Martin G.A., Wiese W.L., Younger S.M., 1981, J. Phys. Chem. Ref. Data 10, 305
- [] Führ J.R., Martin G.A., Wiese W.L., 1988, J. Phys. Chem. Ref. Data 17, Suppl. No. 4
- [] Geballe, T.R., Tielens, A.G.G.M., Kwok, S., Hrivnak, B.J., 1992, ApJ 387, 89
- [] Grevesse N., 1989, in AIP Conferences Series 183 : “Cosmoc Abundances of Matter”, ed C.J. Waddington, American Institute of Physics, New York, p.9
- [] Henning T., Chan S.J., Assendorp R., 1996, A&A 312, 511
- [] Hill V., Andrievsky S., Spite M., 1995, A&A 293, 347
- [] Hrivnak B.J., 1995, ApJ 438, 341
- [] Hrivnak B.J., Kwok S., 1991a, ApJ 368, 564
- [] Hrivnak B.J., Kwok S., 1991b, ApJ 371, 631
- [] Hrivnak B.J., Kwok S., Volk K.M., 1989a, ApJ 345, L51
- [] Hrivnak B.J., Kwok S., Volk K.M., 1989b, ApJ 346, 265
- [] Hrivnak B.J., Kwok S., Geballe T.R., 1994, ApJ 420, 783
- [] Justtanont K., Barlow M.J., Skinner C.J., Roche P.F., Aitken D.K., Smith C.H., 1996, A&A 309, 612
- [] Klochkova V.G., 1995, MNRAS 272, 710
- [] Kwok S., 1993, ARA&A 31, 63
- [] Kwok S., Volk, K.M., Hrivnak, B.J., 1989, ApJ 345, 51
- [] Kwok S., Hrivnak B.J., Geballe T.R., 1990, ApJ 360, L23
- [] Kwok S., Hrivnak B.J., Geballe T.R., 1995, ApJ 454, 394
- [] Kurucz R.L., 1993, CD-ROM set, Cambridge, MA : Smithsonian Astrophysical Observatory.
- [] Kurucz R.L., 1995, internet : http://cfa-www.-harvard. edu/amp/data/kur23/ sekur.html
- [] Lambert L.D., Heath J.E., Lemke M., Drake J., 1996, ApJ 103, 183
- [] Lattanzio J.C., Frost C.A., Cannon R., Wood P., 1996, in : R.T. Rood, A. Renzini (eds) Advances in Stellar Evolution. Cambridge, Cambridge U. Press (in press)
- [] Luck R.E., 1977, ApJ 212, 743
- [] Luck R.E., 1978, ApJ 219, 148
- [] Luck R.E., Bond H.E., 1989, ApJ 342, 476
- [] Luck R.E., Lambert D.L., 1985, ApJ 298, 782
- [] Malaney R.A., 1987a, ApJ 321 832
- [] Malaney R.A., 1987b, Ap&SS 137, 251
- [] Meixner M., Skinner C.J., Graham J.R., et al., 1997, ApJ 482, 897
- [] Moore C.E., Minnaert M.G.J., Houtgast J., 1966, National Bureau of standards Monograph 61
- [] O’Brian T.R., Wickliffe M.E., Lawler J.E., Whaling W., Brault J.W., 1991, J. Opt. Soc. Am. B.8, 1185
- [] Omont A., Loup C., Forveille T., et al., 1993, A&A 267, 515
- [] Omont B.E., Moseley S.H., Cox P., et al., 1995, ApJ 454, 819
- [] Reddy B.E., Parthasarathy M., Gonzalez G., Bakker E.J., 1997, A&A in press.
- [] Smith V.V., Cunha K., Jorissen A., Boffin H.M.J., 1997, A&A 315, 179
- [] Takeda Y., Takada-Hidai M., 1994, Publ. Astron. Soc. Japan 46, 395
- [] Thévenin F., 1989, A&AS 77, 137
- [] Thévenin F., 1990, A&AS 82, 179
- [] Ulrich, R.K., 1973, in: D.N. Schramm & W.S. Arnett (eds) Explosive Nucleosyntheis. Austin. Universit of Texas Press, p. 139
- [] Utsumi, K., 1985, in : M. Jashek & P.L. Keenan (eds) Cool Stars with Excesses of Heavy Elements. Reidel, Dordrecht, p. 243
- [] Van Winckel H., 1995, PhD thesis, KULeuven, Belgium
- [] Van Winckel, H., 1997, A&A 319. 561
- [] Van Winckel H., Waelkens C., Waters L.B.F.M., 1996a, A&A 306, L37
- [] Van Winckel H., Oudmaijer R.D., Trams N.R., 1996b, A&A 312, 553
- [] Venn K.A., 1995a, ApJ 449, 839
- [] Venn K.A., 1995b, ApJS 99, 659
- [] Wheeler J.C., Sneden C., Truran J.W. Jr., 1989, ARA&A 27, 279
- [] Wiese W.L., Führ J.R., 1975, J. Phys. Chem. Ref. Data 4, 263
- [] Wiese W.L., Martin G.A., 1980, NSRDS-NBS 68
- [] Woodsworth A.W., Kwok S., Chan S.J., 1990, A&A 228, 503
- [] Zuckerman B., Dyck H.M., Claussen M.J., 1986, ApJ 304, 401