Galactic Free-Free and H Emission
GEORGE F. SMOOT
LBNL, SSL, Physics Department
University of California
Berkeley, CA 94720
e-mail: Smoot@cosmos.lbl.gov
Abstract: This document provides a brief summary estimate of Galactic free-free emission and H emission and their relationship. Particular emphasis is placed on estimating the potential free-free emission in the region of significant confusion for CMB anisotropy measurements. Existing x-ray, ultraviolet and H emission provide limits on the radio free-free emission and vice versa. These limits are generally somewhat smaller than the observed “free-free” (signal ) microwave signal. If these preliminary results true, then some previously neglected source may be present. Physics argues that H emission is still the best tracer for Galactic free-free emission and thus a tool for diagnosing if there is a previously neglected source.
1 INTRODUCTION
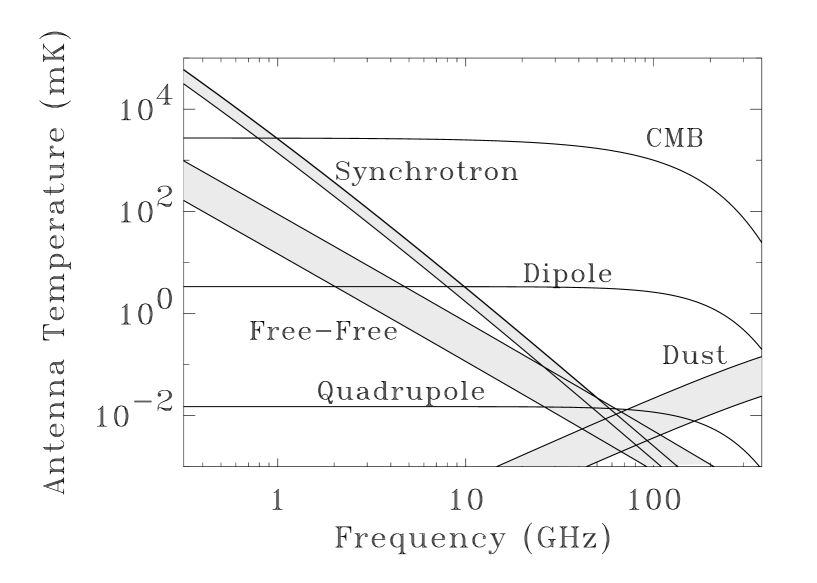
Free-free emission is the least well known of the three diffuse Galactic emissions which dominate the mm and cm wavelength sky. Figure 1 shows versus frequency the approximate relative intensity of the Galactic synchrotron, free-free, and dust emission in relation to the cosmic microwave background (CMB).
2 Free-Free Emission
Radio-frequency free-free emission arises from the interaction of free electrons with ions, and consists of thermal bremsstrahlung radiation. Free-free emission is the bremsstrahlung (braking radiation) that occurs when a fast charged particle (in this astrophysical case thermally hot electrons) is accelerated in an encounter with an atom, molecule, or ion. Free-free emission is so named since the electron starts in a free (unbound) state and ends in an unbound state as opposed to being captured into a bound state (free-bound emission) or making a transition from one bound level to another (bound-bound emission). When the electron enters the Coulomb field, it is accelerated and emits radiation in a readily calculable manner. In an astrophysical plasma, such as those that exist in our Galaxy one must integrate over the total distribution of electrons and ions to obtain an expression for the volume or line of sight emissivity. The velocity averaged Gaunt factor takes into account the distributions and the quantum mechanical cutoff in scattering emission.
The volume absorptivity/emissivity of a plasma for electron-ion bremsstrahlung is [15], [20]
| (1) | |||||
| (2) | |||||
| (3) | |||||
| (4) |
where the approximation is for and is the velocity averaged Gaunt factor. Integration along the line of sight gives the formula for the optical depth to free-free as
| (5) | |||||
| (6) | |||||
| (7) |
where the emission measure is defined as: . The brightness spectrum has a spectral index, with weak dependency on the temperature and density of the interstellar plasma and the observing frequency. The Gaunt factor accounts for this small dependency.
This formula (Eqn. 7) is based on the assumptions that the interstellar plasma is electrically neutral, that the temperature of the electrons along the line of sight is roughly constant, that the electron temperature is greater than 20K, the frequency is smaller than 100 GHz, and that the Gaunt factor can be expressed as a product of powers of the frequency and the electron temperature. [19],[20].
3 Free-Free Signal
Free-free emission is the least well known of the Galactic emissions. It is not easily indentified at radio frequencies, except near the Galactic plane. At higher latitudes free-free emission must be separated from synchrotron emission by virtue of their differing spectral indices. At frequencies less than about 10 GHz synchrotron emission dominates at intermediate and high latitudes. At higher frequencies where free-free emission might be expected to exceed the synchrotron component, the signals are weak and survey zero levels are indeterminate.
4 H Emission
At present most of the information currently available about the source of free-free radiation at intermediate and high latitudes comes from H surveys.
4.1 Relation between H & Free-free Emission
Diffuse Galactic H is thought to be a good tracer of diffuse free-free emission since both are emitted by the same ionized medium and both have intensities proportional to emission measure (the line of sight integral of the free electron density squared, ).
The intensity of H emssion is given [16],[11] by
| (12) |
for and where varies from 0.9 for K to 1.2 for K,
| (13) |
at a wavelength Angstroms.
Combining the free-free and H equations one finds a relation between the low-temperature H intensity and the free-free emission
| (14) | |||||
| (15) |
so that for example , , and . A typical measured value for is order of 1 .
4.2 Results from H Surveys
The major H structures form the well-known Local (Gould Belt) System which extends 30∘-40∘ from the plane at positive in the Galactic centre and at negative latitude in the anticentre. The HI and dust in the Local System may be traced to 50∘ from the Galactic plane. Other H features are also found extending 15∘-20∘ from the plane [23].
Quantitative measurements are now available from accurate spectroscopy (e.g. Reynolds 1992, Bartlett et al. 1997). To first order the H may be approximately modelled as a layer parallel to the Galactic plane with a half-thickness intensity of 1.2 Rayleigh (R). The rms variation in this H emission is roughly 0.6R on degree scales.
The four-year COBE DMR sky maps at different frequencies have been utilized to isolate emission with antenna temperature which varies proportional to frequency to the -2.15 power () [9] in an attempt to provide a large angular scale map of free-free emission at 53 GHz. This low-signal to noise map is consistent with the H large scale model with a free-free half height amplitude of K. The rms free-free signal on a 7∘ scale was estimated to be K.
The H images of the NCP area made by Gaustad et al. (1996) have been analyzed by Veeraraghavan & Davies (1997) to provide an estimate of the spatial power spectrum on scales of 10′ to a few degrees. The power law index is -2.3 0.1 over this angular range. The rms amplitude is 0.12 cosec() Rayleighs on 10 arcmin scales.
It has been assumed that the free-free component could be modeled using measurements of H emission, (e.g. [22], [18]) which measure the density of free electrons. However, recent results showing more significant correlation of dust and apparent free-free emission have been interpreted as presenting us with a surprize[9][3][11]. Alternative explanations have been suggested including rotating dust grains[5]. It still appears that mapping the H emission is the best way to determine the free-free emission and separate out any other component.
Although Galactic H emission is correlated with the Galactic free-free emission, it is not straightforward to estimate the Galactic free-free emission from the H sky maps. The H sky maps are contaminated with H from the Earth’s geocoronal emission. The geocoronal emission varies both diurnally and seasonally with the solar Lyman flux. This variation ranges from 2 to 25 Rayleigh.
The geocoronal and Galactic H emissions are separable in principle, since the Doppler shift of the Earth’s motion around the solar system separates the lines. Making this separation requires spectral measurements and is less effective as one moves toward the ecliptic poles where the separation is negligible. There is also the issue of another atmospheric line (OH) that partially blocks the positive Doppler shift side so that only during restricted seasons can part of the geocoronal effect be removed well in this manner.
5 Galactic Corona and High Temperature Regions
The ROSAT 1/4 keV survey of the soft x-ray background is being used to map out the hot gas in the local bubble but more importantly to show the existence of the long hypothesized [25] hot Galactic corona.
In 1956 Spitzer[25] suggested that the Galactic halo was filled with hot gas. A primary argument was the existence of cool gas clouds high above the Galactic plane, which he reasoned must be confined by a hotter ambient medium. This hot medium must be continually being resupplied with energy as cooling would soon set in. The favored current model is of fountains of hot ionized material produced by large groups of supernovae.
The dust in the Draco complex appears as a “shadow” in the soft x-ray background providing direct evidence that a large portion of the soft x-ray background comes from the Galactic halo. The ROSAT soft x-ray data and HI maps have been used to model the hot ionized interstellar medium, e.g. [21], to obstain estimates of the temperature and emission measure ().
The x-ray temperature estimates are on the order of K which are consistent with the predictions based upon the virial temperature K of the halo.
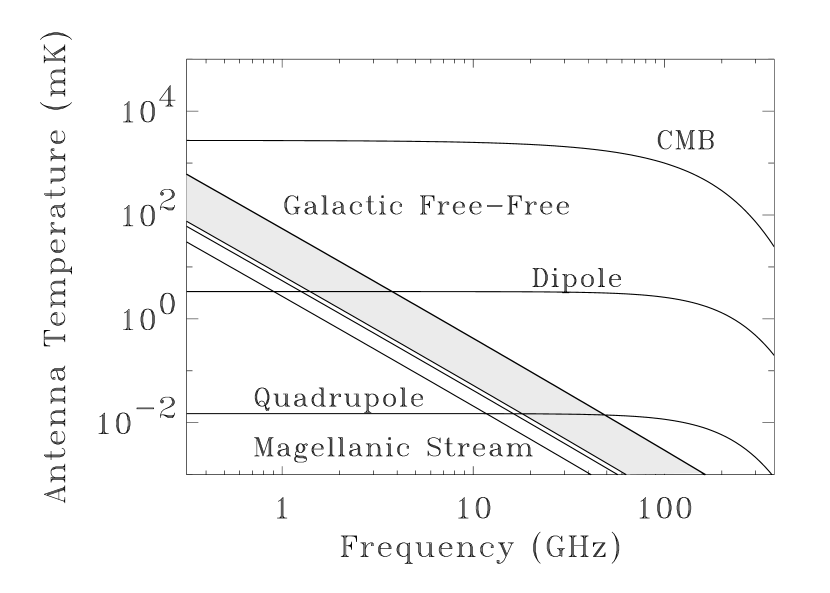
6 Emission form the Magellanic Stream
The Magellanic Stream is a long filament of H I clouds which stretches over 100∘ across the sky which trails behind the Magellanic Clouds in their orbit around the Galaxy[12]. In ram pressure explanations for the origin of the Magellanic Stream, the Stream is swept out of the Magellanic Clouds by the diffuse ionized corona of the Galactic halo. The Stream is a chain of clouds connected by lower-density gas. These clouds generally have a high-density concentration and gradient on the leading edge[6] and H emission is observed on some of these clouds[30]. The H emission is best explained by ram pressure heating from the hot Galactic corona.
7 Estimates of Free-Free Emission
Table 1 presents measurements and estimates of the Galactic ionized emission regions.
| Region | T | (30 GHz) | ||
|---|---|---|---|---|
| (K) | () | () | () | |
| Local Bubble | 0.004 [21] | |||
| Disk Region ( 1 kpc) | 2.9 csc [16] | 1 | 5 - 40 | |
| Halo | 0.024 [21] | |||
| Magellanic Stream | 0.5-1.0 [30] | 0.2-0.370.02 | 2-4 | |
| Local Group Corona |
Using the formulae relating the free-free emission to the plasma temperature and emission measure and to H emission one derives the signals shown. The numbers for the Galactic free-free emission derived this way are a factor of two below what one finds using the slope (fitting to csc) COBE DMR free-free map. The DMR free-free map does not have a strong signal-to-noise ratio and shows a high degree of correlation with the Galactic dust emission[9] which may or may not be free-free emission[5]. For that reason it is more reliable and consistent to trace the properties of the ionized interstellar medium through its H emission. The major question is: How much hot ( K) gas is there in the interstellar medium? Could there be enough to make up the factor of two? The x-ray and pulsar dispersion measurements put a tight limit on the possible additional free-free emission. The pulsar dispersion measurements are consistent with an emission measure of approximately 1 csc /() if all the ionization is spread evenly and uniformly. The estimate is higher by the fractional filling factor. The filling factor is estimated to be of order 0.1 to 0.4, increasing with increasing Galactic latitude.
8 X-ray Emission Information
The volume emission by thermal bremsstrahlung is
| (16) | |||||
| (17) |
Integrating over the line of sight one finds
| (18) | |||||
| (19) | |||||
| (20) |
X-ray emission is a good tracer of radio free-free emission when the plasma is sufficiently hot to produce x-rays via thermal bremstrahlung. That is they both arise from the same mechanism but are the opposite extremes of . Thus they have essentially the same coefficients except the Boltzmann suppression factor is very important for x-rays. One can then use the x-ray observations to provide an estimate and upper limit versus temperature for the radio free-free emission.
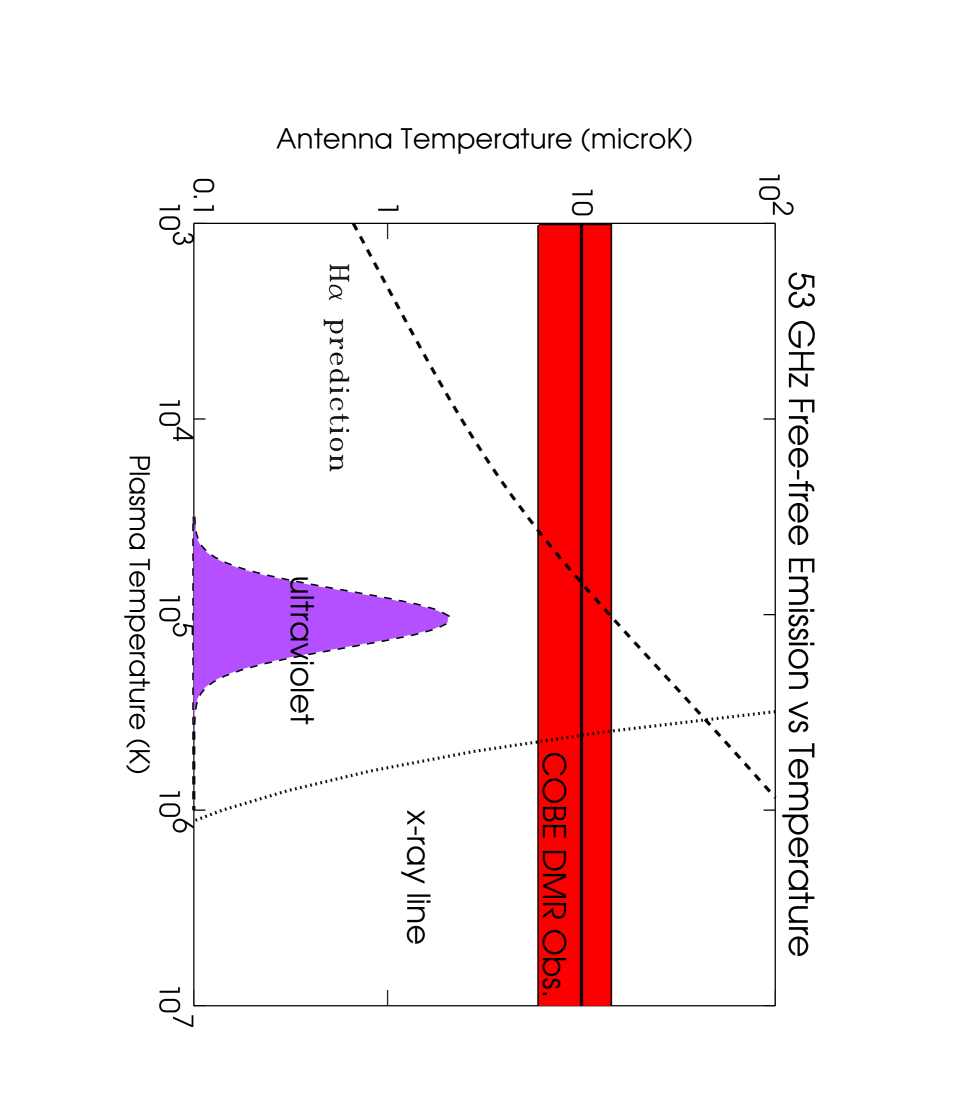
A summary of the observations, H prediction, and the x-ray limits are shown in Figure 3. (Note that the OVRO [11] observations of about 200 K at 14.5 GHz extrapolate to be roughly 13 K at 53 GHz; however, since the signal is at such a small angular scale, one would have predicted a smaller number by a factor of roughly 10.)
9 Ultraviolet Observations
Current H and x-ray observations leave room for plasma in the K range to produce significant radio free-free. One would not be surprised that a rising Galactic fountain of hot supernova gas would cool from K to this level. However, measurements in the ultraviolet can constrain this possibility. Ultraviolet observations of O VI [8], [4] indicate the presence of halo hot gas in the temperature range . The mean density of the gas is of order 0.01 cm-3 with scale height of less than 1 kpc and filling factor greater than 0.1. This can be used to limit the radio free-free emission. This limit is generally below 0.1 K. The plot in Figure 3 shows a significantly higher limit both to be very conservative and so that the limit would show on the plot.
10 Geocoronal Free-free & H Emission
The Earth’s corona produces H emission. About 12% of the hydrogen atoms excited by solar Lyman photons return to their ground state through the emission of H photons [24]. This geocoronal emission varies both diurnally and seasonally with the solar Lyman flux. The amplitude variation ranges from about 2 to 25 Rayleighs.
Geocoronal H emission is not expected to be a tracer of geocoronal free-free emission as most of the hydrogen is not significantly ionized but excited via solar Lyman. The mean temperature of the geocoronal hydrogen ranges from 900 K to 1300 K.
The geocoronal H emission is a potential interference for observing the Galactic H emission. Doppler effect allows separation because of the motion of the Earth around the Sun and the relative motion of the plasma. However, such a separation requires high resolution spectral measurement and analysis instead of simple imaging.
11 H & Free-Free vs. Dust Emission Correlation
A number of groups have found a significant correlation between dust and microwave “free-free” (antenna temperature spectral index ) emission by cross correlation between 100 m IRAS and DIRBE maps and the observed emission [9],[11],[3],[29]. and H-dust correlation [10], [13]. Table 2 provides a summary of results on the dust vs H & free-free emissions. Table 2 shows clearly that the estimated “free-free” emission correlation to the dust implies a larger total signal than the H. This is the same conclusion one tentatively reaches from Figure 3 which gives the predicted signal level or upper limits from the H, ultraviolet, and x-ray observations.
| Free-free–Dust Correlation | ||||
|---|---|---|---|---|
| Authors | frequency | |||
| ( K (MJy/sr)-1) | (GHz) | (deg) | (deg) | |
| Leitch et al. [11] | 75 | NCP | ||
| Kogut et al. [9] | 31.5 | |||
| 53 | ||||
| 90 | ||||
| Costa et al. [3] | 40 | NCP | ||
| H–Dust Correlation | ||||
| Authors | frequency | |||
| ( Rayleigh (MJy/sr)-1) | (deg) | (deg) | ||
| Kogut 1997 [10] | H | |||
| Kogut 1997 [10] | H | NCP | ||
| McCullough [13] | H | |||
| Implied from Free-free K | ||||
| Leitch et al. [11] | 6 | NCP | ||
| Kogut et al. [9] | 50 | |||
| Costa et al. [3] | NCP | |||
There is also an inconsistency between the estimates from the microwave estimates of “free-free” signal emission unless there is significantly more correlation between the “free-free” signal and the dust emission at smaller angular scale.
12 Conclusions
The estimation of radio (e.g. 53 GHz) free-free emission is not a completely settled issue. It is possible that some of the signal seen is due to rotating dust or some other no yet understood source. However, it is possible that the signal level and the correlation with dust will be readily accounted for by simple emission from warm ( K) plasma which is well traced by its H emission. The issue will be resolved when there are both high quality H and microwave observations and the results can be carefully cross correlated. At that point we will be able to determine what is the level of the other sources.
Acknowledgments. — This work supported in part by the DOE contract No. DE-AC03-76SF00098 through the Lawrence Berkeley National Laboratory and NASA Long Term Space Astrophysics Grant No. 014-97ltsa.
References
- [1] A. Banday, and A. Wolfendale, 1990 MNRAS, 245, 182
- [2] Bartlett, J., Marcelin, M, et al. Strasbourg-Marseille Collaboration
- [3] A. de Oliveria-Costa et al. 1997 ApJ, 482, L17, astro-ph/9705090
- [4] Dixon, W. Van Dyke & Davidsen, A.F., 1996 ApJ, 465, 288.
- [5] B.T. Draine & A. Lazarian 1997 ApJ astro-ph/9710152
- [6] Jones, B.F., Klemola, A.R., & Lin, D.N.C., 1994 A.J. 107, 1333.
- [7] Gaustad, J., McCullough, P. & van Buren, D., 1996. PASP, 108, 351.
- [8] Hurwitz, M. & Bowyer, S. 1996 ApJ, 465, 296.
- [9] A. Kogut et al. 1996 ApJ, 460, 1, astro-ph/9509151
- [10] A. Kogut 1997 AJ, 114, 1127 astro-ph/9706282
- [11] E. Leitch, A.C.S. Readhead, T.J. Pearson, & S.T. Myers 1997 astro-ph/9705241
- [12] Mathewson, D.S. Cleary, M.N., & Murray, J.D., 1974, Ap. J. 190, 291.
- [13] McCullough, P.R. 1997 A.J., 113, 2186 astro-ph/9703128
- [14] McKee, C.F. 1993 ‘Back to the Galaxy,’ ed. S.S. Holtz & F. Verter (New York) AIP 499
- [15] Oster, L. (1961) Rev. Mod. Phys. 33, 525
- [16] Reynolds R.J., et al. 1998, WHAM (Wisconsin H Mapper) home page: http://www.astro.wisc.edu/wham/
- [17] Reynolds R.J., 1992, ApJ, 392, L35.
- [18] R.J. Reynolds, and D.P. Cox, 1992, ApJ.L, 400, 33
- [19] Rohlfs, K. (1990) “Tools of Radio Astronomy” Springer-Verlag
- [20] G.B. Rybicki, and A.P. Lightman, 1979, ’Radiative processes in astrophysics’, (Wiley, New York USA)
- [21] S.D. Sider, T.J. Sumner, J.J. Quenby, & M. Gambhir 1996, Astron, Astrophys 305, 308-315.
- [22] J.H. Simonetti, et al., 1996, ApJ.L., 458, 1
- [23] Sivan, J.P., 1974. AA Suppl. 16, 163.
- [24] Shih, P., Roesler, F. & Scherb, F. 1985 J. Geophys. Res. 90, 477.
- [25] Spitzer, L. 1956 Ap. J. 124, 20.
- [26] Spitzer, L. 1978 “Physical Properties of the Interstellar Medium” (New York: John Wiley & Sons)
- [27] Spitzer, L. 1990 ARA&A 28, 71
- [28] Valls-Gabaud, D. 1998 Pub. Astron. Soc. Australia, Vol. 15
- [29] Veeraraghavan, S. & Davies, R.D., 1997 in Particle Physics and the Early Universe, eds. Bately, R., Jones, M.E. & Green, D.A.
- [30] B.J. Weiner & T.B. Williams 1997, Astron J., astro-ph/9512017